


— Solutions —
—Products—
 Consumer hotline +8618073152920
 WhatsApp:+8615367865107
Address:Room 102, District D, Houhu Industrial Park, Yuelu District, Changsha City, Hunan Province, China
Industrial & Energy
Time:2025-11-14 17:08:05 Popularity:534
Driven by global energy transition and China’s “dual carbon” goals, the PV industry has become a core pillar of clean energy. By 2024, China’s cumulative PV capacity exceeds 600 GW. However, actual plant efficiency is constrained by solar radiation, irradiance angles, and other factors. The “build-heavy, monitor-light” approach leads to significant energy waste.
Solar radiation is the primary energy source for PV generation; its monitoring accuracy directly impacts power forecasting, O&M strategies, and ROI. Current plants face inaccurate radiation data, delayed tracker response, and untimely component fault detection. Traditional equipment suffers from low precision, weak anti-interference, and poor data integration. To address this, NiuBoL integrates sensing and intelligent control expertise to launch a full-chain solution covering “radiation monitoring – efficiency analysis – intelligent control”, supporting the entire lifecycle of PV plants.

Traditional monitoring uses basic photosensitive components with errors up to ±10%+, ignoring dynamic factors like cloud cover. Satellite data lacks on-site calibration, causing power forecast deviations >15%.
PV trackers can boost efficiency by 15%–25%, but traditional systems rely on timed or simple triggers, with >30-second delays in cloudy conditions. Some lack precise radiation data, leading to angle offsets that reduce efficiency.
Components suffer efficiency decay from dust, hot spots, etc. Manual inspections are inefficient (500 panels/day avg.), missing hidden cracks. Without radiation-power correlation analysis, O&M decisions are blind, costing 8%–12% of total investment.
Radiation, panel temperature, and power data are stored in silos without unified analysis. Managers cannot quickly link “radiation changes → power fluctuations,” hindering optimization strategies.
Achieve “precise radiation sensing, intelligent tracking optimization, efficient O&M management, and 10%–20% efficiency gain” via high-precision equipment and a “sensing – transmission – analysis – control” system. Reduce O&M costs by >30%.
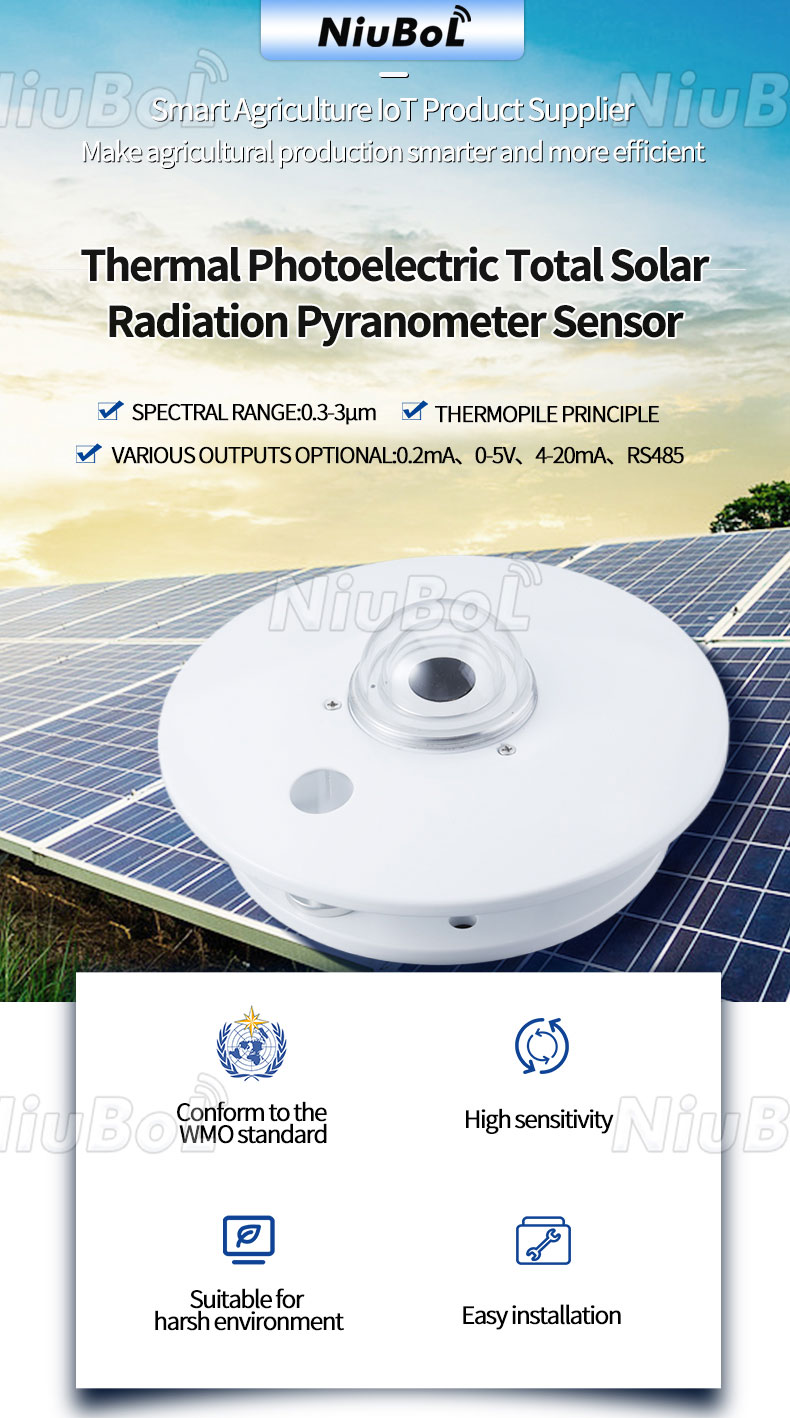
- High-Precision Radiation Sensing: NiuBoL sensors use silicon photodiode design; pyranometers adopt thermopile principle. Jointly monitor 0–2000 W/m² with ±2% accuracy, distinguishing direct/diffuse radiation.
- Intelligent Tracking Control: Combines solar trajectory algorithms with real-time radiation data; tracker response ≤500 ms, auto-switching between precision tracking and energy-saving standby.
- PV Big Data Analytics: Cloud platform includes efficiency models for 72-hour power forecasting (≥90% accuracy) and auto-fault detection via radiation-power correlation.
- IoT Linkage Control: Seamless integration of sensors, trackers, and inverters; auto-adjusts parameters during radiation spikes.

- Range: 0–2000 W/m²
- Accuracy: ±2%
- Resolution: 1 W/m²
- Response: ≤10 ms (captures radiation surges)
- IP65, -40℃~85℃
- Built-in temperature compensation
- RS485/LoRaWAN, wireless range up to 2000 m

- ISO 9060 Class B compliant
- Accuracy: ±2%
- Annual stability error: ≤1%
- Quartz glass dome, wind/dust-proof
- Analog/digital dual output

- Dual-axis: Horizontal 0–360°, Vertical -15°~90°
- 20%–25% efficiency gain vs. fixed mounts
- ≤500 ms response in cloudy conditions using real-time radiation data
- NiuBoL Panel Temperature Sensor (NBL-W-PPT): -50℃~100℃, ±0.5℃
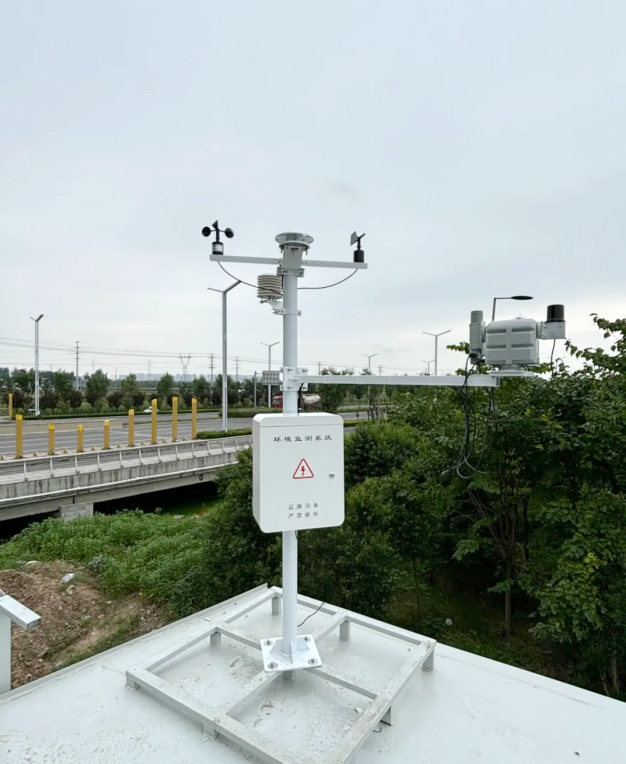
- Environmental Sensors: Monitor temperature, humidity, wind speed for data correction
- Supports 16 sensors, industry-standard protocols
- 4G + Ethernet dual communication for high reliability
- Generates evaluation reports and high-accuracy power forecasts
- Real-time visualization of plant status
- NiuBoL PV O&M App: Real-time monitoring (update ≤3s), fault handling, efficiency reports, device management
- Web Terminal: Plant operations, permissions, large-screen control center for strategic decisions

- On-site survey to plan sensor placement: 10 sets per 50 MW (large plants), 1–2 per rooftop (distributed)
- Post-installation: Calibrate with standard radiation source (error ≤±2%), 72-hour trial run for parameter optimization
- Sensors collect every 0.1s, upload every 1s to cloud
- Sync panel power data
- Platform cleans outliers, integrates multi-source data, uses time-series analysis to uncover radiation patterns, builds “radiation-power” model for fault ID and forecast refinement
- Tiered alerts for radiation/power anomalies and equipment faults
- Optimize tracking and O&M plans using efficiency reports
- Submit power forecasts to grid for absorption planning and revenue boost

- More Reliable Data: Dual-device monitoring, ±2% accuracy (80% error reduction vs. traditional), supports direct/diffuse separation
- Superior Efficiency: Fast tracker response captures 10% more light, 20% lower energy consumption
- More Efficient O&M: 95% fault detection accuracy, 5× O&M efficiency, >30% cost reduction
- Comprehensive Coverage: Full lifecycle (site selection, construction, operation), suits new and legacy plant upgrades

- Desert dust: Auto dust-blowing
- Coastal salt spray: Anti-corrosion coating
- High-altitude UV: Reinforced UV protection
- Supports Modbus, OPC UA
- Data migration tools for historical data import and unified management
Data Transmission Chain
Front-end devices → Collector (preprocess & aggregate) → Cloud (store & analyze) → App (display) — forming a complete closed loop.

A1: All PV plant types; supports new builds and legacy upgrades.
A2: 10%–20% gain; small plants recover in 1.5–2 years, large in 2–3 years.
A3: Fully operational.
A4: Modular install; ≤30 min downtime per component. ≤5 days for 1 MW, ~30 days for 100 MW+.
A5: Annual calibration; mechanical parts serviced every 2 years. Annual cost: 3%–5% of equipment value.
The NiuBoL Solar Radiation & PV Monitoring Solution tackles core pain points with four key technologies, building a full-chain system: high-precision front-end devices, data collectors as hubs, cloud platform as core, multi-end systems as output — achieving dual goals of efficiency gain and cost reduction.
Proven in multiple deployments, it delivers >15% efficiency improvement and >35% O&M cost savings. Moving forward, NiuBoL will integrate AI and IoT for continuous innovation, launching more solutions to drive high-quality development in the PV industry.
Prev:Power Station Weather Monitoring — Weather Station for Power Plants
Next:no more
Related recommendations
Sensors & Weather Stations Catalog
 Agriculture Sensors and Weather Stations Catalog-NiuBoL.pdf
Weather Stations Catalog-NiuBoL.pdf
Agriculture Sensors Catalog-NiuBoL.pdf
Related products
 Combined air temperature and relative humidity sensor
 Soil Moisture Temperature sensor for irrigation
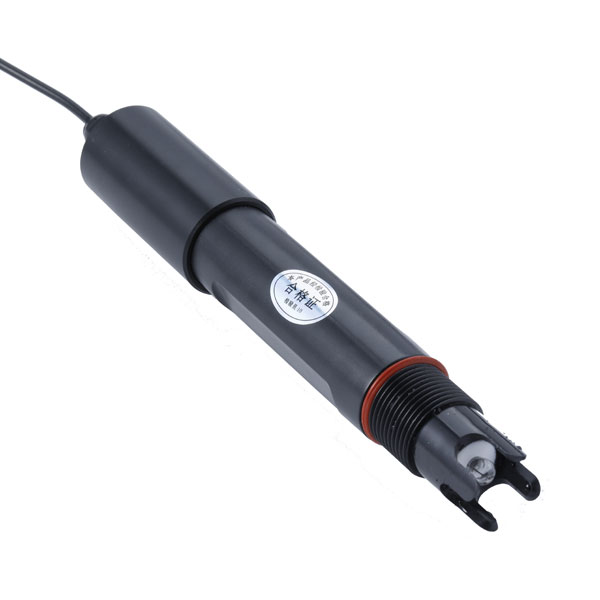 Soil pH sensor RS485 soil Testing instrument soil ph meter for agriculture
 Wind Speed sensor Output Modbus/RS485/Analog/0-5V/4-20mA
 Tipping bucket rain gauge for weather monitoring auto rainfall sensor RS485/Outdoor/stainless steel
 Pyranometer Solar Radiation Sensor 4-20mA/RS485

Screenshot, WhatsApp to identify the QR code
WhatsApp number:+8615367865107
(Click on WhatsApp to copy and add friends)

