

— Products —
 Consumer hotline +8618073152920
 WhatsApp:+8615367865107
Address:Room 102, District D, Houhu Industrial Park, Yuelu District, Changsha City, Hunan Province, China
Ambient Sensors
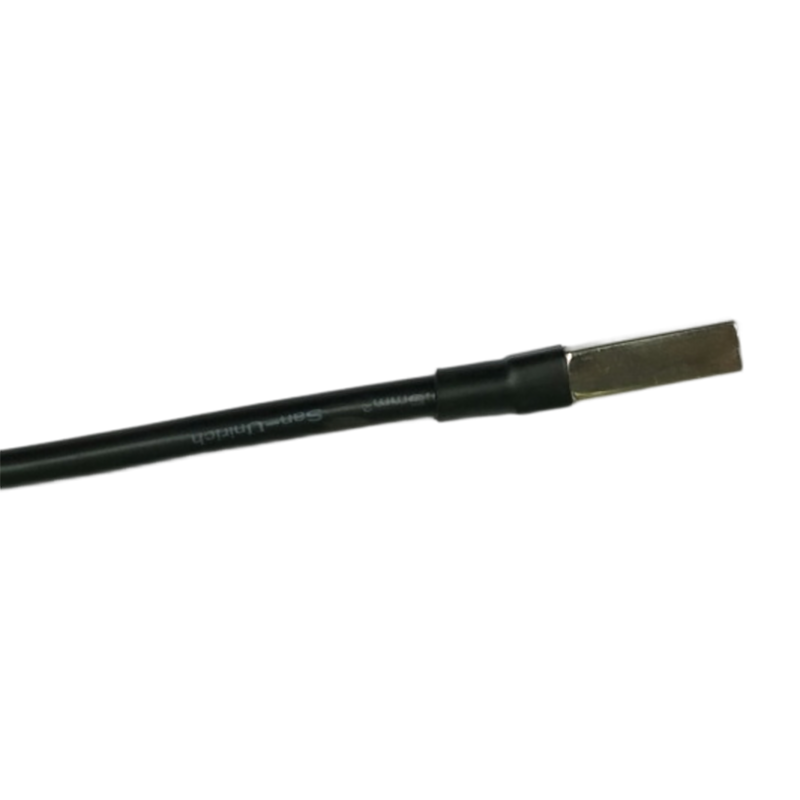
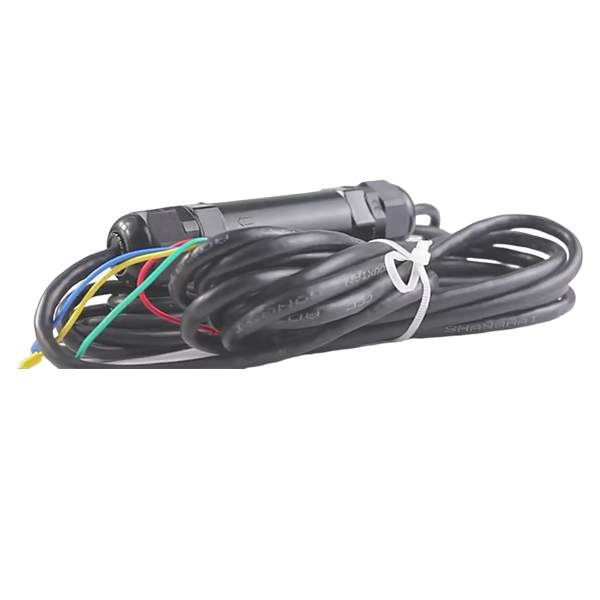
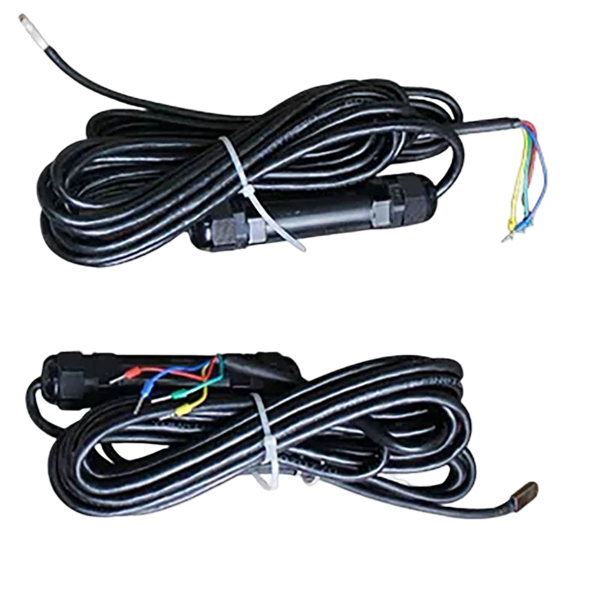
Install the NBL-W-PPT PV module temperature sensor with suitable rear-surface contact, cable restraint and 4-20mA, voltage or RS485 system integration.
Tel/WhatsApp:+8615367865107
Email:Arvin@niubol.com +Nearly 100 partner companies in more than 75 countries. We are committed to providing high-quality, practical products to meet your needs and help you solve problems. Our products comply with international standards and are certified with ISO, CE and RoHS.Product Details
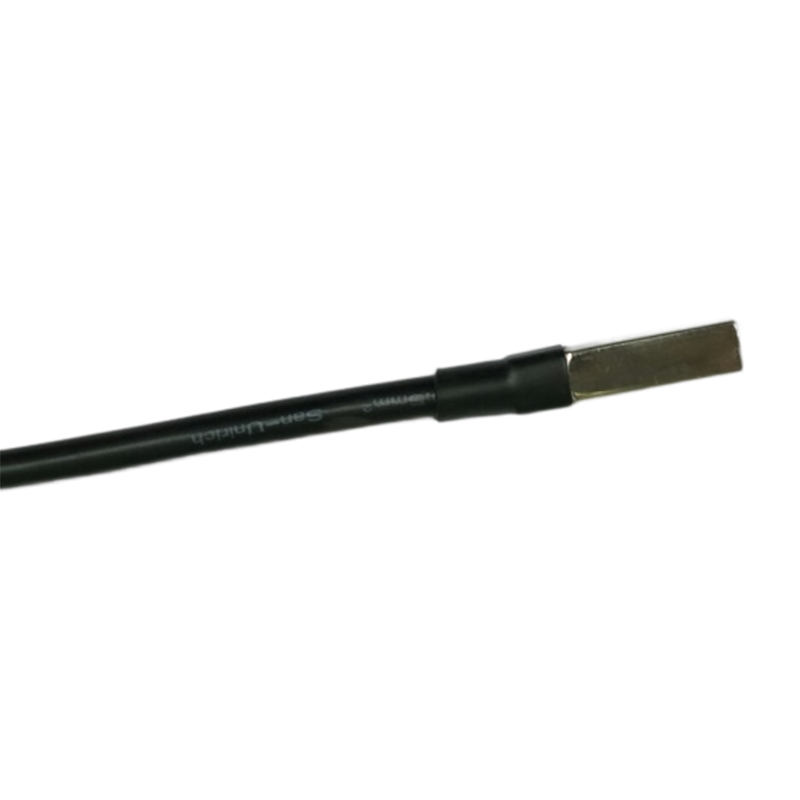
The NBL-W-PPT PV module temperature sensor measures -50 to 100 degrees C with published accuracy of +/-0.5 degree C. It can be ordered for 5, 12 or 24 VDC and 4-20mA, 0-2.5V, 0-5V or RS485 output. Measurement quality depends on intimate rear-surface thermal contact, representative module selection, secure cable routing and correct electrical scaling.
| Parameter | Specification |
|---|---|
| Range | -50 to 100 degrees C; optional -20 to 50 degrees C |
| Accuracy | +/-0.5 degree C |
| Supply options | 5, 12 or 24 VDC |
| Output options | 4-20mA, 0-2.5V, 0-5V or RS485 |
| Standard cable | 5 m |
| Voltage load | RL >= 1 kohm |
| Current load | RL <= 250 ohms |
| Operating environment | -50 to 100 degrees C; 0-100% RH |
| Probe weight / power | 125 g / 0.15 W |
| Mounting | Thermally conductive silicone on module rear surface |
The instrument measures temperature at its bonded rear-surface point. It does not directly measure cell temperature everywhere on the module or identify every hot spot. State how the value will be used in performance analysis.
Avoid a module that is shaded, unusually ventilated, damaged or located at an array edge unless that condition is intentional. Record row, table, module position and sensor location so the reading can be reproduced.
PV output changes with irradiance, module temperature, spectral conditions, soiling and electrical availability. The module-temperature channel supplies one required input; it should be time-aligned with irradiance and AC/DC production before performance conclusions are drawn. Use the coefficient and reference conditions for the actual module type.
One point may be adequate for a small uniform array, while a utility plant can contain different orientations, mounting systems, blocks and airflow. Select reference modules by design zone and document why each is representative. Additional points should answer a defined comparison rather than merely increase channel count.
A field sensor provides measurements through its ordered electrical interface. Remote transmission is a separate system layer:
Sensor → RS485 / analog signal → PLC, RTU or data logger → 4G / Ethernet / Wi-Fi → SCADA, cloud platform or private server
Confirm each interface boundary, including power, isolation, registers or analog scaling, polling interval, timestamp handling and recovery after an interruption.
Clean and prepare the selected rear surface according to the project method. Apply the specified thermally conductive silicone and hold the NBL-W-PPT in place during initial bonding. Voids or partial detachment cause delayed or biased response.
Route cable along the module support and provide strain relief so the sensor pad does not carry cable weight. Protect against sharp edges, UV, water traps and movement during maintenance or tracker operation.
PV performance calculations often use plane-of-array irradiance, module temperature, electrical output and availability on a common time base. The temperature point must have a defined module and mounting position. Use the governing project procedure for filtering, uncertainty and reference conditions rather than a generic correction factor.
If the instrumented module is replaced, record the old and new module identity, electrical rating, position, bonding date and any overlap comparison. Moving only the sensor to another module can introduce a step in the historical record even when the sensor itself has not changed.
A high or low reading may result from real module conditions, partial detachment, damaged cable, incorrect scaling or a nonrepresentative module. Compare nearby modules, irradiance, wind and electrical operation before classifying the event as a module fault.
Sensor accuracy is only one part of the result. Thermal contact, module variation, position, cable and reference comparison add uncertainty. Record these factors when the temperature channel is used for contractual performance assessment or research.
Operating condition: A large array needs representative module temperature for performance review.
System approach: Install selected reference points by array block and synchronize with irradiance and power data.
Project value: Engineers can interpret thermal operating conditions without treating one module as the whole site.
Operating condition: Roof heat and restricted airflow create strong local variation.
System approach: Document the selected module and keep cable protected from roof edges and maintenance traffic.
Project value: Operators gain a traceable thermal channel for the actual roof environment.
Operating condition: Comparative testing requires repeatable sensor contact and location.
System approach: Use the same rear-surface position and bonding method across samples.
Project value: The laboratory can compare modules with controlled installation uncertainty.
Keep the sensor cable clear of connectors, drainage paths and sharp frame edges. On tracker systems, check the full range of motion and service position. Cable clips and loops should not shade cells or pull against the bonded sensor as temperature and structure move.
For 4-20mA or voltage versions, confirm input impedance, common reference, isolation and engineering conversion at the logger. Simulate or compare at two or more temperatures where practical. Store the configured range in the SCADA channel record so a future transmitter replacement does not silently change scaling.
Module cleaning, replacement, repowering and cable work can disturb the temperature point. Include the sensor in work permits or maintenance instructions and inspect it after the affected task. Record rebonding or module replacement because either action changes the measurement history.
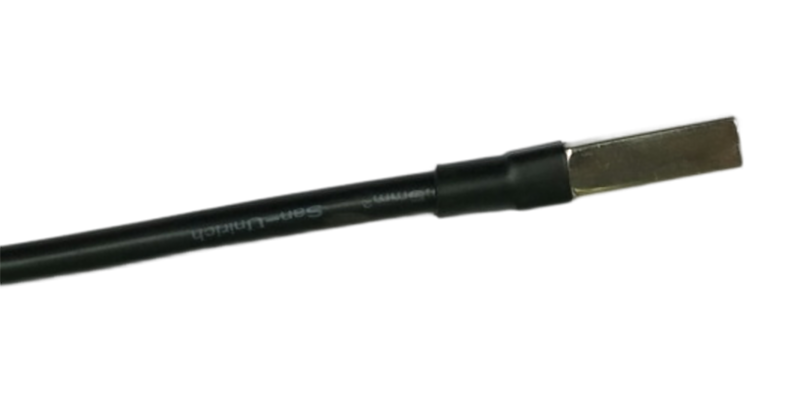
Order one output that the logger or PLC supports. Program the exact analog scale or Modbus register information, check supply voltage at the sensor and label the module and channel consistently.
Compare with a suitable contact reference after stabilization and observe response through a natural heating or cooling cycle. Confirm the same value, timestamp and module identity in SCADA, then inspect adhesion after severe weather.
The product configuration can be selected when the following operating and interface requirements are defined:
It measures the bonded rear-surface point, which can be used as a module-temperature input under the project's method.
Usually not without a documented sampling basis; array blocks and mounting conditions can differ.
Choose the native input of the logger or PLC and confirm range and scaling before ordering.
Cable load can weaken the thermal bond and create intermittent wiring faults.
No. Module temperature responds to irradiance, wind, mounting and electrical operation.
Inspect adhesion, cable restraint, connectors and data continuity.
Range, supply, output, cable, quantity, mounting materials, logger and required documents.
For a quotation, provide the measurement range, application, required accuracy, output, supply voltage, cable length, quantity, installation conditions and controller or data logger. NiuBoL can then confirm the model-specific configuration and documentation.
Prev:CO2 Humidity and Temperature Sensor
Next:6-in-1 Air Quality Sensor (PM2.5, CO, CO2, O3, SO2, NO2)
Sensors & Weather Stations Catalog
 Agriculture Sensors and Weather Stations Catalog-NiuBoL.pdf
Weather Stations Catalog-NiuBoL.pdf
Agriculture Sensors Catalog-NiuBoL.pdf
Water Quality Sensor Catalog-NiuBoL.pdf
Related recommendations
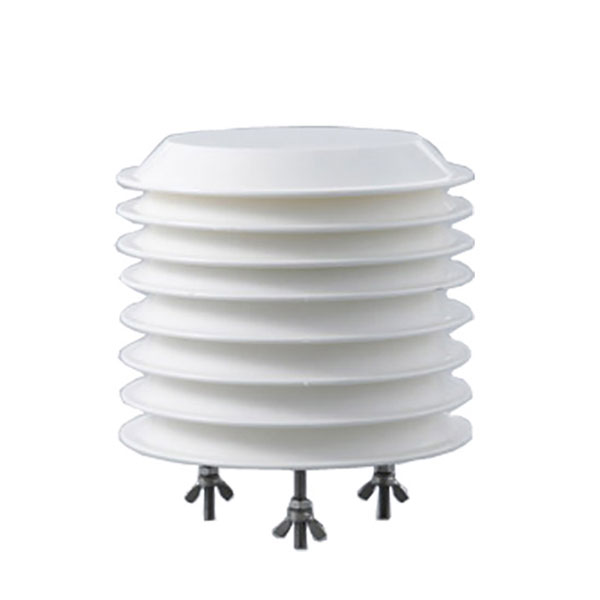 Combined air temperature and relative humidity sensor
 Particulate Matter Sensors (PM1, PM2.5 & PM10)
 6-in-1 Temperature, Humidity, Pressure, Illuminance, CO2, and CO Sensor
 CO2 Humidity and Temperature Sensor
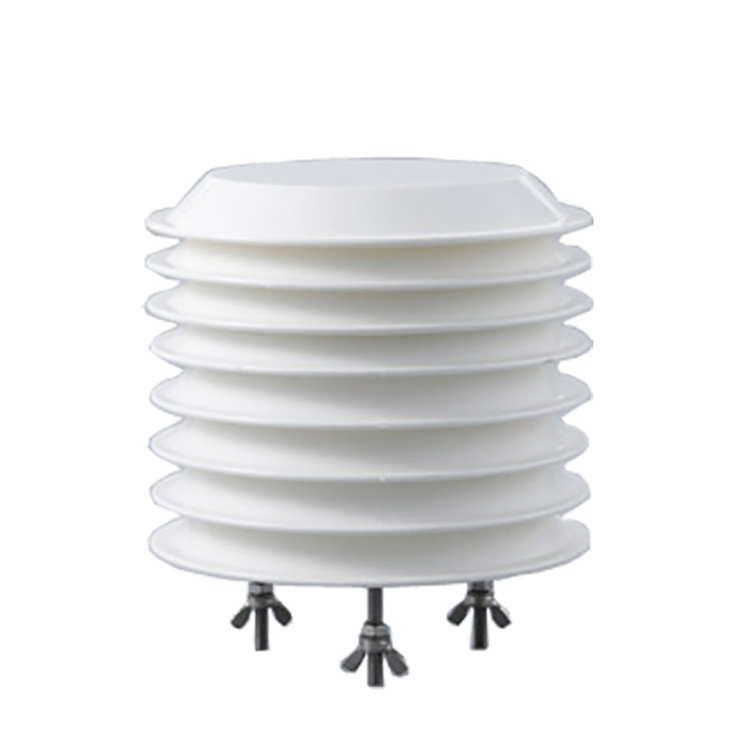 Measures air temperature and relative humidity pressure Sensor
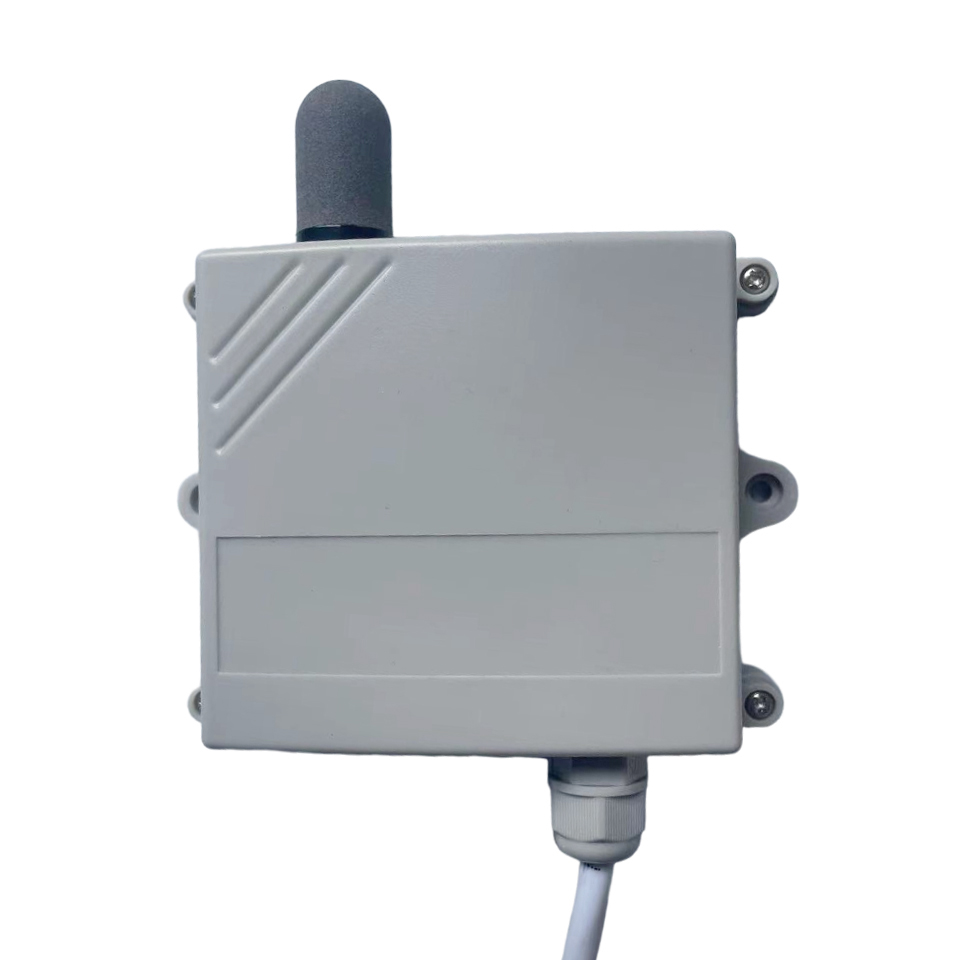 Wall-mounted temperature and humidity sensors used in storage warehouses, greenhouses

Screenshot, WhatsApp to identify the QR code
WhatsApp number:+8615367865107
(Click on WhatsApp to copy and add friends)