


— Blogs —
—Products—
 Consumer hotline +8618073152920
 WhatsApp:+8615367865107
Address:Room 102, District D, Houhu Industrial Park, Yuelu District, Changsha City, Hunan Province, China
Product knowledge
Time:2025-05-08 17:00:22 Popularity:1398
Predicting crop growth using data is a complex and meticulous process, encompassing the full workflow from data collection to model application. It significantly enhances the scientific and efficient management of agricultural production. The following is a detailed and practical guide, tailored to real-world agricultural scenarios.

Data is at the core of crop growth prediction. The collection phase must ensure diversity, timeliness, and reliability. Key methods include:
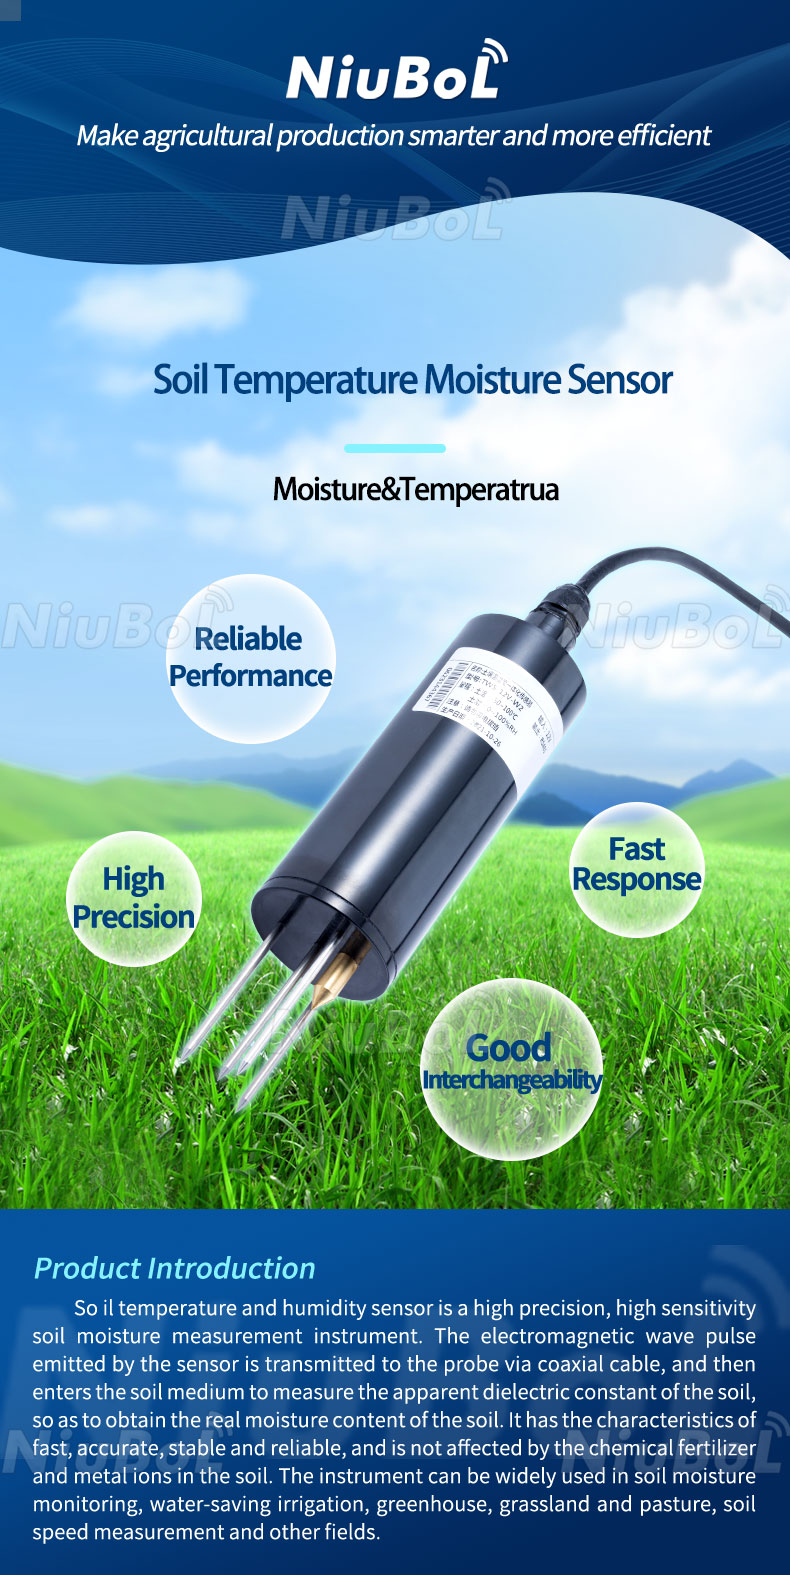
Soil Monitoring: Deploy soil moisture, pH, and nutrient (N, P, K) sensors in critical field areas. Sensors should be distributed based on plot size and soil type to avoid data bias.
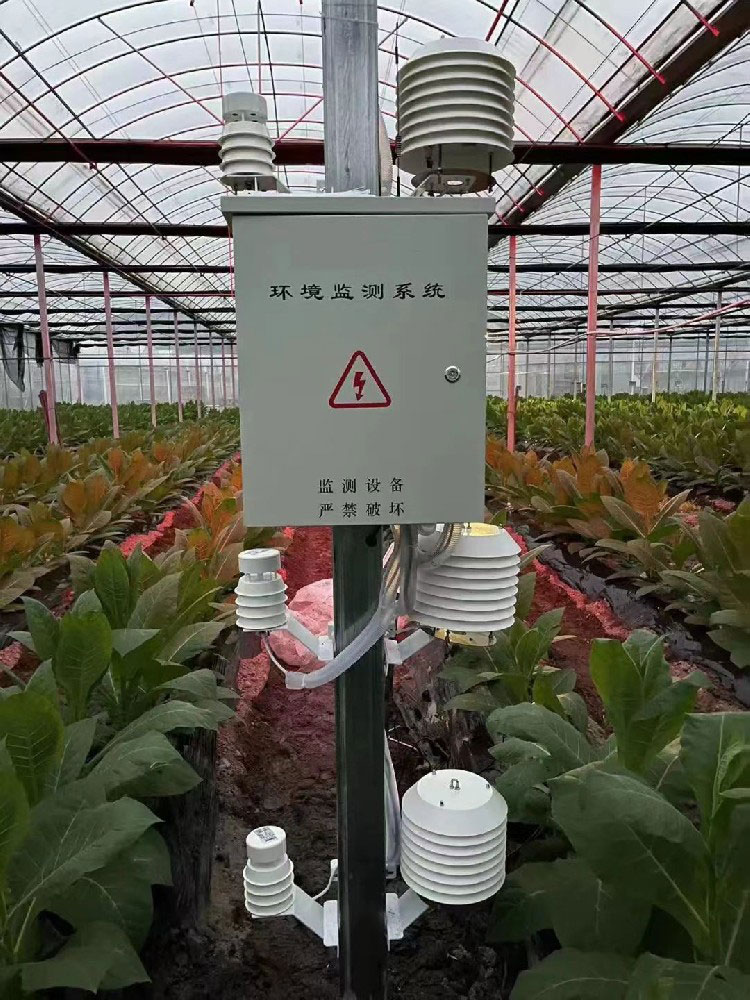
Weather Data Acquisition: Install micro weather stations or connect to regional weather APIs to collect temperature, humidity, rainfall, solar radiation, and wind speed data. Ensure data resolution matches crop growth stages (e.g., hourly or daily).
Remote Sensing: Use drones equipped with multispectral or hyperspectral cameras to scan fields regularly, obtaining NDVI, chlorophyll content, and other indicators of crop health. Satellite imagery can supplement drone data for broader coverage.
Historical & Management Data: Organize past crop yield, variety traits, irrigation logs, fertilization plans, and pest/disease records. These provide long-term trend insights.
Auxiliary Data: Record field geography (e.g., slope, drainage), planting density, and planting dates to capture environmental and human-influenced factors.
Notes: Ensure sensors are calibrated and maintained regularly to avoid data drift. Data must span the full crop lifecycle to prevent gaps in critical stages like flowering or grain filling.
Raw data often contains noise, missing values, or inconsistent formats. Preprocessing ensures usable data:
Data Cleaning: Identify and remove anomalies, such as extreme values from sensor failures or invalid weather readings. Use statistical methods (e.g., Z-scores) or domain knowledge.
Standardization: Align different data sources (e.g., sensors, satellite images) to a common time and spatial resolution. Aggregate hourly weather into daily averages to match soil data.
Missing Data Handling: Apply linear interpolation or mean filling for short-term gaps. For longer gaps, estimate using nearby field data or historical trends. Use machine learning (e.g., KNN) for complex cases.
Data Integration: Merge multi-source data (soil, weather, remote sensing) into a unified dataset with synchronized time and location.
Tip: Automate preprocessing workflows to reduce manual work and track each step with a log for troubleshooting.
The goal is to extract high-quality features that impact crop growth:
Direct Features: Soil moisture, daily average temperature, cumulative rainfall, NDVI.
Derived Features: Growing Degree Days (GDD), soil moisture deficit index, rainfall uniformity.
Time-Series Features: Trends over time, such as changes in NDVI or moisture levels before and after irrigation.
Correlation Analysis: Use statistics (e.g., Pearson correlation) or visualization to identify relationships, like rainfall’s lag effect on soil moisture or temperature’s link to pest outbreaks.
Advanced Analysis: Apply PCA or clustering to reduce dimensionality and highlight key variables.
Practical Tip: Collaborate with agronomists to select meaningful features and avoid model overfitting due to excessive inputs.

Model Selection: Choose models such as linear regression, time series analysis, neural networks, or random forests based on data characteristics.
Model Training: Train models on historical data and fine-tune parameters to enhance accuracy.
Model Validation: Use a separate validation set to evaluate prediction performance.
Models must integrate into real agricultural operations for decision-making:
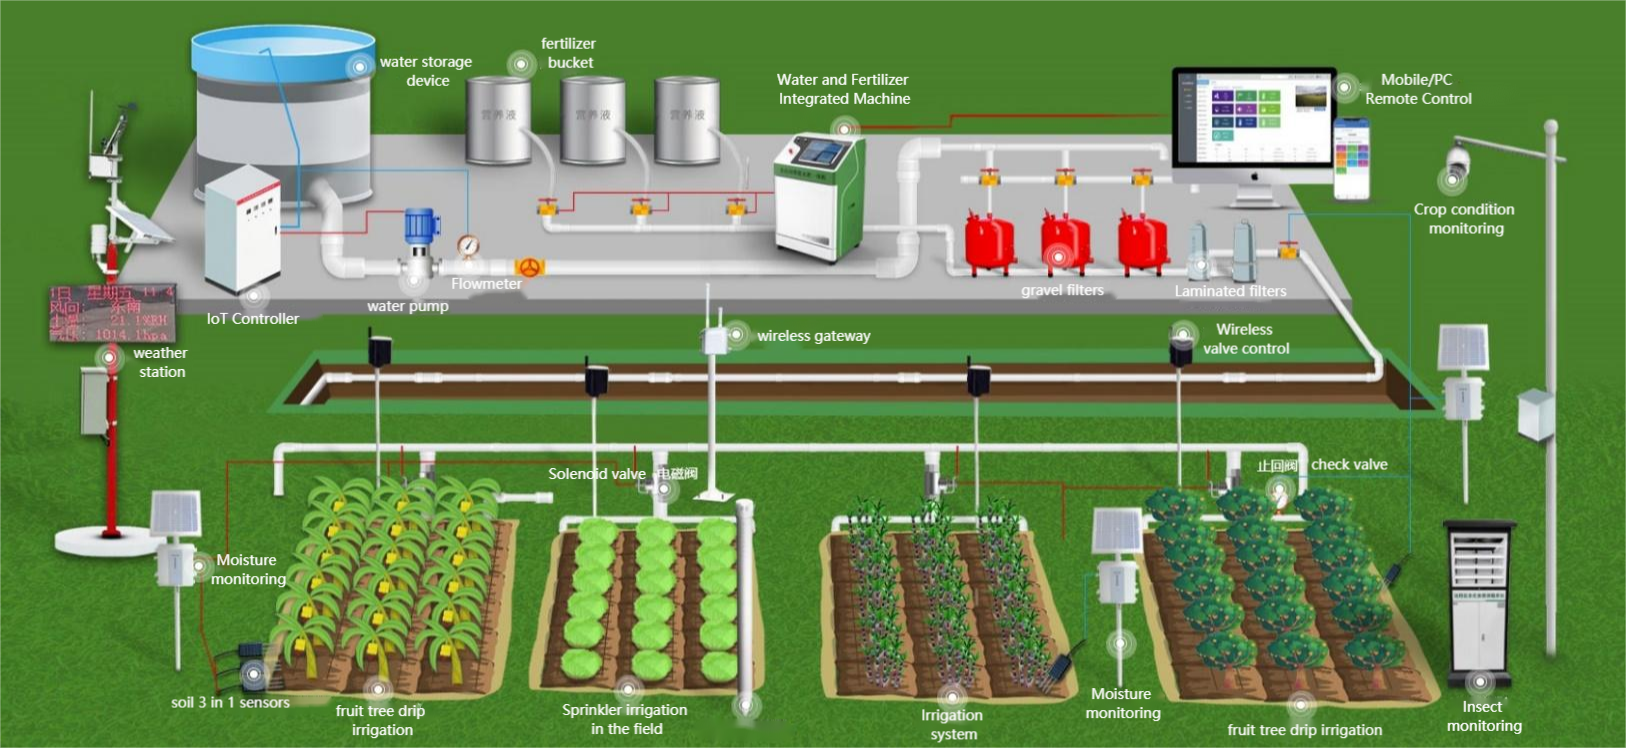
System Integration: Embed the model in IoT platforms or mobile apps, connecting with sensors, weather stations, and irrigation systems to enable real-time data input and prediction output.
Real-Time Prediction: Based on current data (e.g., today’s soil moisture and forecasted weather), predict upcoming growth states, water needs, disease risk, or expected yield.
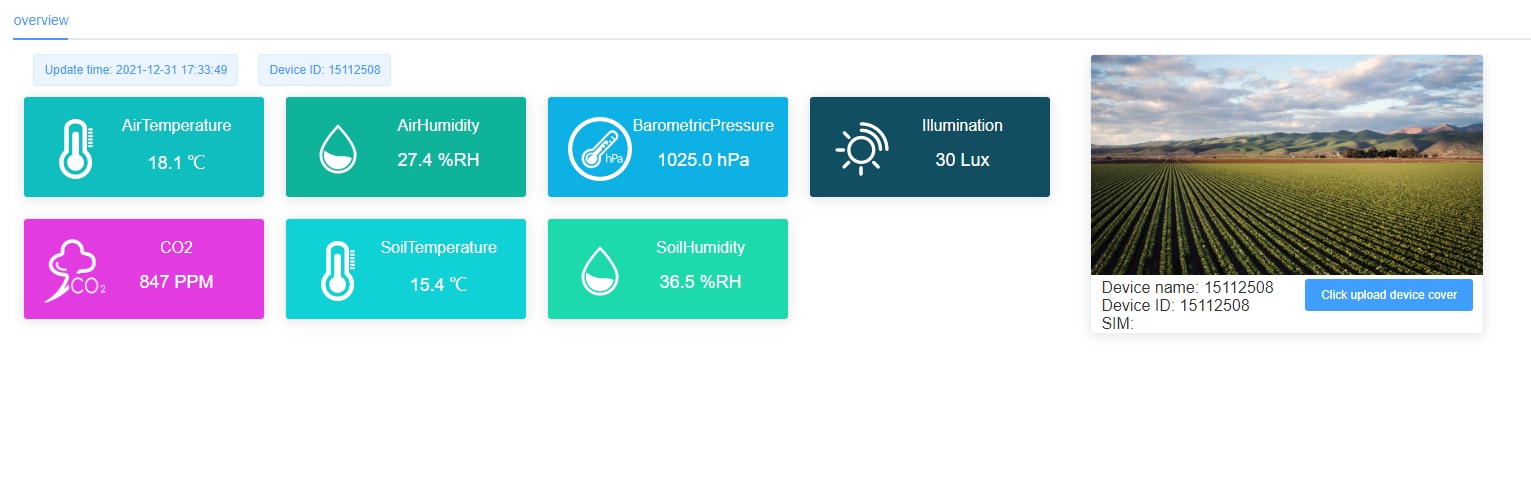
User Interface: Provide intuitive visual dashboards to farmers, displaying predictions like crop health scores or irrigation suggestions with actionable guidance.
Technical Note: Ensure system reliability and secure data transmission, especially in remote areas where offline prediction support may be necessary.

The value of predictions lies in actionable outcomes:
Visualization: Display model results through graphs (e.g., growth curves, yield forecasts) or heatmaps (e.g., field health distribution).
Expert Collaboration: Data scientists and agronomists should interpret results together, combining algorithmic predictions with local knowledge. For instance, a predicted moisture deficit might be confirmed in the field before irrigating.
Irrigation: Adjust timing and volume based on predicted water needs.
Fertilization: Apply nutrients based on predicted deficiencies.
Pest & Disease Control: Identify high-risk areas early and guide targeted spraying.
Farmer Training: Use demo fields or mobile apps to introduce data-driven agriculture and improve adoption.
Key Point: Align predictive recommendations with practical costs—avoid overly aggressive measures.
Agricultural conditions evolve; models must adapt:
Data Refresh: Continuously collect new seasonal data (e.g., updated soil or weather conditions).
Model Retraining: Retrain models each season or year. Use incremental learning to lower computational costs.
Feedback Loops: Compare predicted results with actual yields or pest incidence to find discrepancies and refine models.
Tech Upgrades: Incorporate new sensors, higher-resolution imagery, or advanced algorithms (e.g., reinforcement learning) to improve performance.
Long-Term Goal: Build regional agricultural data platforms to enable cross-area predictions and resource optimization.
Data Quality: Small farms may lack robust data; use shared regional datasets or low-cost sensors.
Cost of Technology: Equipment like sensors and drones can be expensive; promote subsidies or cooperative ownership.
Farmer Acceptance: Some farmers may distrust technology; use demo projects and training to build confidence.
Regional Variability: Climate, soil, and crop differences require tailored models—not a one-size-fits-all approach.

By systematically collecting, processing, analyzing, and modeling data, crop growth prediction can provide precise agricultural guidance—helping farmers optimize resource use, reduce risk, and boost yield. Success depends not only on advanced technology but also on practical agricultural experience and local adaptation. As IoT, AI, and remote sensing continue to evolve, data-driven agriculture will drive the next leap in precision farming and contribute to global food security.
Prev:Complete Guide to Installing and Commissioning a Greenhouse Weather Station
Next:Field microclimate weather stations:monitoring system for smart agriculture
Related recommendations
Sensors & Weather Stations Catalog
 Agriculture Sensors and Weather Stations Catalog-NiuBoL.pdf
Weather Stations Catalog-NiuBoL.pdf
Agriculture Sensors Catalog-NiuBoL.pdf
Water Quality Sensor Catalog-NiuBoL.pdf
Related products
 Combined air temperature and relative humidity sensor
 Soil Moisture Temperature sensor for irrigation|NBL-S-THR
 Soil pH sensor RS485 soil Testing instrument soil ph meter for agriculture |NBL-S-PH
 Wind Speed sensor Output Modbus/RS485/Analog/0-5V/4-20mA
 Tipping bucket rain gauge for weather monitoring auto rainfall sensor RS485/Outdoor/stainless steel
 Pyranometer Solar Radiation Sensor 4-20mA/RS485

Screenshot, WhatsApp to identify the QR code
WhatsApp number:+8615367865107
(Click on WhatsApp to copy and add friends)
