





— Download —
 Consumer hotline +8618073152920
WhatsApp:+8615367865107
Address:Room 102, District D, Houhu Industrial Park, Yuelu District, Changsha City, Hunan Province, China
All products

Integrate a NiuBoL PM2.5 sensor into an air quality station. Check laser-scattering limits, airflow, humidity and RS485 commissioning before requesting a project quote.
Tel/WhatsApp:+8615367865107
Email:Arvin@niubol.com +Nearly 100 partner companies in more than 75 countries. We are committed to providing high-quality, practical products to meet your needs and help you solve problems. Our products comply with international standards and are certified with ISO, CE and RoHS.Product Details
Quick Answer: This NiuBoL PM2.5 sensor estimates airborne particulate mass concentration by laser scattering, using a built-in fan and RS485 output. Its range is 0-1000 micrograms/m3. The specified error is the greater of +/-15% or +/-10 micrograms/m3 at 25 degrees C and 50% RH. Select it for an optical monitoring channel with representative airflow and a planned comparison method, not as an automatically equivalent replacement for every reference analyzer.
| Parameter | Specification |
|---|---|
| Measurement principle | Laser scattering; built-in fan |
| PM2.5 range | 0-1000 micrograms/m3 |
| Specified error | Greater of +/-15% or +/-10 micrograms/m3, at 25 degrees C and 50% RH |
| Minimum detectable particle diameter | 0.3 micrometres |
| Supply | 12-24 VDC |
| Output | RS485; confirm the ordered channel configuration |
| Standard cable | 2.5 m |
| Operating conditions | -20 to 60 degrees C; 0-99% RH |
| Power | 350 mW |
The upper range is equivalent to 1 mg/m3. Check that against the expected concentration before specifying the unit for a dusty process area. A range suitable for ambient trends does not establish suitability for a hot exhaust, dense process stream or personal exposure measurement.
At 20 micrograms/m3, 15% is 3 micrograms/m3, so the stated 10 micrograms/m3 term is larger. At 200 micrograms/m3, 15% is 30 micrograms/m3 and becomes the larger term. Both calculations apply at the specified conditions of 25 degrees C and 50% RH.
This matters when a project expects small differences between low background readings. A display showing different integer values does not establish that every small difference is resolved with the same accuracy. Choose an acceptance method that includes the reference instrument and field conditions rather than demanding agreement to the last displayed digit.
The instrument estimates mass concentration from light scattered by particles passing through the optical chamber. Particle size, shape, refractive index and aerosol composition influence the conversion. It is suitable for continuous trends and network monitoring, but it is not automatically equivalent to a gravimetric reference method for every dust type.
The 0.3 micrometre figure describes particle diameter, not a 0.3 microgram/m3 mass-concentration detection limit. PM2.5 is a particle-size fraction; it does not mean that all detected particles have the same diameter. Keep the reported mass unit separate from particle counts or another dust fraction in the platform.
The internal fan must draw representative air through the inlet and outlet. Keep the unit vertical as instructed and leave clearance around both openings. Do not mount it directly in the discharge of another fan, inside a sealed cabinet or against a wall that recirculates exhaust air.
Keep the intended inlet and outlet paths open when adding weather protection. A sealed station cabinet can protect electronics while preventing the PM channel from sampling outside air. A nearby cooling-fan discharge can instead dominate the sample and make the station measure its own enclosure exhaust.
Do not add a fine filter ahead of the sensing inlet merely to keep dust out; removing the particles changes the quantity being measured. Long hoses, improvised screens or added blowers also need an evaluated sampling design. Use the inlet arrangement intended for the selected sensor and enclosure.
Choose a height and setback that match the monitoring objective. Roadside exposure, site-boundary assessment and general ambient background require different positions. Shield the electronics from direct precipitation without blocking airflow, and keep the inlet away from enclosure exhaust, generator fumes and dusty maintenance areas.
For a boundary station, record the point's relation to likely sources and prevailing airflow. For an indoor ventilation investigation, choose whether the point represents occupied air or another defined location. A roadside point, a general background point and a position next to a supply diffuser should not be compared as interchangeable exposures.
High humidity can make hygroscopic particles grow and can cause optical readings to rise. Condensation can contaminate the chamber. Oil mist, pollen and sticky process dust may foul the optical path or fan. Review the expected aerosol before choosing a location or interpreting differences from a reference monitor.
The operating humidity interval does not extend the 25 degrees C, 50% RH error statement to condensing conditions. Review near-saturation events with humidity and inspection information. An optical rise during a humid period may need a different investigation from a wiring interruption that removes the channel entirely.
Specify any drying or conditioning arrangement with the measurement method. It can affect the aerosol reaching the chamber and should not be added as an undocumented correction. Oil aerosols and sticky process material also require suitability review; a cleaning schedule alone does not establish compatibility with every industrial aerosol.
The standalone NiuBoL PM2.5 RS485 version uses Modbus RTU, 9600 baud, 8 data bits, one stop bit, no parity and at least 1000 ms between communications. Confirm that configuration with the delivered firmware before adding the sensor to the installed bus.
The family includes PM2.5 and combined PM2.5/PM10 arrangements. State which channels are required and map the supplied values accordingly. A PM2.5-only order does not become a two-fraction instrument because the logger has room for a second tag.
Verify the engineering unit and averaging period at both the local logger and final platform. A compatible data logger or gateway handles storage and onward transport. Successful polling alone does not check the fan, inlet exposure or optical conversion.
At continuous 350 mW operation, the sensor alone uses approximately 8.4 Wh over 24 hours. Add logger, communications and any conditioning equipment separately for a solar-powered station. Confirm the operating procedure before cycling power to save energy; a permitted polling interval is not a documented startup or stabilization time.
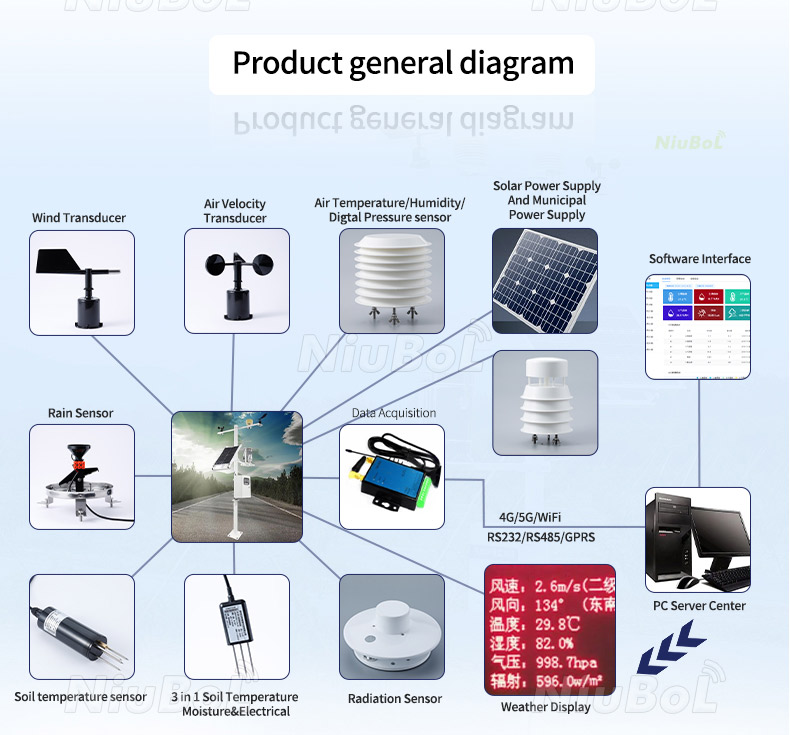
Colocate the assembled enclosures under a planned common exposure before deployment. Include normal variation rather than deriving a correction from one observation. If one channel differs, first check the configuration, inlet clearance, fan and enclosure airflow while the units are still accessible together.
For a field comparison, align timestamps and averaging and record humidity, particle sources and service events. Different aerosol composition can change an optical instrument's relationship with a reference. Retain the comparison method and its applicable conditions instead of treating one fitted correction as universal.
Inspection frequency depends on particle loading and site conditions. Track fan behaviour, inlet obstruction, persistent zero or saturated readings and drift from a comparison instrument. Use the model's cleaning and replacement instructions; opening an optical chamber without an approved procedure can create a larger error.
Record a response check after an inlet repair or approved cleaning operation. A stable zero can represent clean air, blocked sampling or a failed acquisition path; a persistent upper value can represent over-range or a fault. Inspect those possibilities before accepting either extreme as an environmental event.
When the station also needs ozone or another gas, use a separate suitable gas channel. A particulate reading cannot establish a gas concentration, and the gas instrument has its own inlet and service requirements. The gas-sensor configuration below is separate from the PM2.5 channel.

Check the absolute error term as well as percentage error and the required decision tolerance. At low concentrations, the 10 micrograms/m3 term can dominate the specification. Use a reference comparison under the intended conditions rather than judging capability from display increments.
Not while expecting representative outdoor particle sampling. Design weather protection around the intended open sampling path and avoid enclosure exhaust recirculation. Verify airflow in the assembled cabinet, not only with a bare sensor on a bench.
No. The error expression is specified at 25 degrees C and 50% RH, and wetting affects the instrument. Review humid events, condensation and aerosol behavior using the actual deployment method.
No. Order the required particle channels and verify their individual definitions. A shared protocol family does not make two size fractions interchangeable or guarantee that both are supplied.
Not solely from the product range and RS485 interface. Such uses require the appropriate measurement method, performance evidence and applicable acceptance. Specify an optical ambient channel only for duties supported by its complete configuration.
Provide concentration expectations, particle source, humidity and temperature, indoor or outdoor exposure, required fractions and receiving equipment. Include enclosure airflow, service access and the intended comparison method so NiuBoL can review the actual sampling arrangement.
Choose the PM2.5 sensor around concentration range, aerosol and inlet exposure. Verify the conditional error specification, keep the sampling path representative and compare the completed installation before relying on network trends. Send NiuBoL the site conditions and acquisition requirements for configuration review.
Sensors & Weather Stations Catalog
 Agriculture Sensors and Weather Stations Catalog-NiuBoL.pdf
Weather Stations Catalog-NiuBoL.pdf
Agriculture Sensors Catalog-NiuBoL.pdf
Water Quality Sensor Catalog-NiuBoL.pdf
Related recommendations
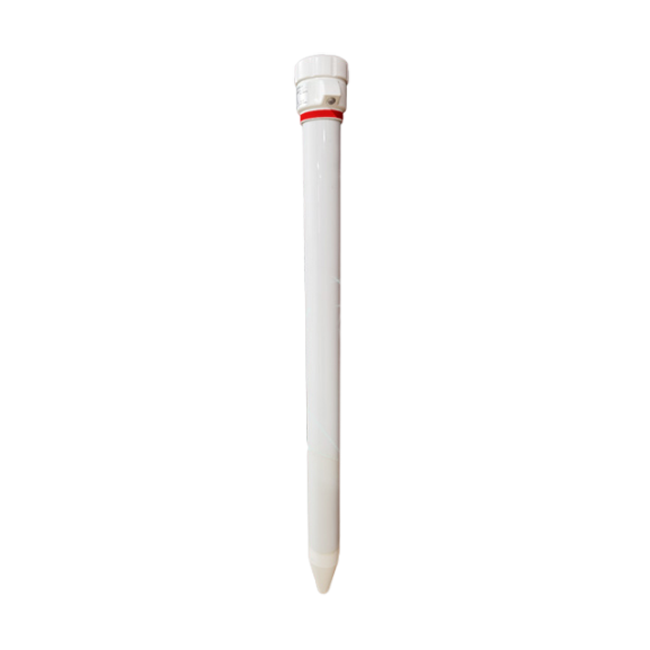 Multi-Depth Soil Sensor RS485
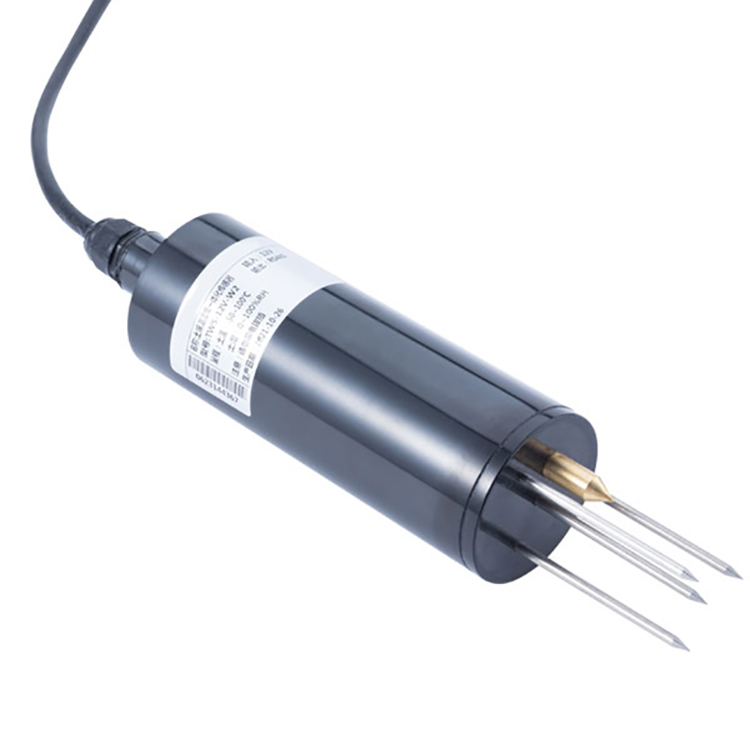 TDR Soil Moisture Sensor
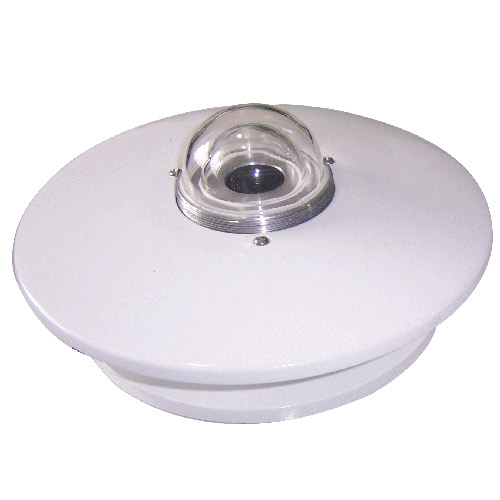 Pyranometer Solar Radiation Sensors
 Soil ph sensor
 Tipping Bucket Rain Gauge
 Air Temperature and Humidity Sensor


Screenshot, WhatsApp to identify the QR code
WhatsApp number:+8615367865107
(Click on WhatsApp to copy and add friends)

