





— Download —
 Consumer hotline +8618073152920
WhatsApp:+8615367865107
Address:Room 102, District D, Houhu Industrial Park, Yuelu District, Changsha City, Hunan Province, China
All products

Connect a NiuBoL illuminance sensor to lighting and greenhouse controls. Check the Lux range, output scaling and humidity limits before requesting a project quotation.
Tel/WhatsApp:+8615367865107
Email:Arvin@niubol.com +Nearly 100 partner companies in more than 75 countries. We are committed to providing high-quality, practical products to meet your needs and help you solve problems. Our products comply with international standards and are certified with ISO, CE and RoHS.Product Details
Quick Answer: This NiuBoL illuminance sensor measures light in Lux over a 0-200000 Lux range, with RS485, 4-20mA or 0-5V output options. It suits a control or monitoring requirement expressed in illuminance, not a substitute measurement of crop photon flux or solar power. Check the -10 to 70 degrees C and 0-80% RH operating limits before selecting it for a humid greenhouse or exposed site.

| Item | Specification |
|---|---|
| Range | 0-200000 Lux |
| Spectral band | 380-730 nm |
| Accuracy | +/-7% |
| Supply | 12 or 24 VDC |
| Outputs | RS485, 4-20mA or 0-5V |
| Cable | 2.5 m |
| Load | Voltage output: at least 1 kohm; current output: up to 300 ohm |
| Environment | -10 to 70 degrees C; 0-80% RH |
| Weight | 170 g |
Illuminance weights visible light according to human visual response and is reported in Lux. A pyranometer reports radiant power in W/m2, while a PAR sensor reports photosynthetic photon flux density. The three quantities are related to different detector responses and cannot be converted with one universal factor for sunlight, LEDs and mixed greenhouse lighting.
Select this sensor when the control or reporting requirement is illuminance. For crop-light research based on photons, specify a PAR sensor. For photovoltaic yield or energy balance, specify a solar radiation sensor. This distinction prevents a low-cost channel from producing a technically inappropriate dataset.
A lighting controller that switches at an agreed illuminance threshold can use Lux directly. A crop trial specifying PPFD needs a photon-based measurement, and a PV monitoring system specifying W/m2 needs irradiance. Converting a Lux trend into another quantity with an unvalidated fixed factor does not correct the detector's different response.
The 0-200000 Lux span is useful when bright conditions must remain in range. It does not, by itself, establish performance near a low switching threshold. When control depends on small changes at low light, ask for the applicable accuracy basis, resolution and low-level response rather than selecting only by full-scale range.
Likewise, the 380-730 nm wavelength interval is not a separate set of wavelength channels. A single Lux output cannot tell the controller how much light came from each color of an LED fixture.
The specified humidity range ends at 80% RH. A greenhouse can exceed that limit during normal operation, particularly around cooling, misting or nighttime conditions. Review the actual exposure with NiuBoL and select a suitable configuration when the expected environment lies outside the listed limits. General descriptions such as outdoor or greenhouse use do not override a numerical operating limit.
The listed working temperature starts at -10 degrees C. A site with lower winter temperatures needs a suitable alternative or an engineered arrangement that preserves the intended optical measurement. Placing the sensor behind a window or inside a convenient cover can change the light reaching it; protection must not be assumed optically neutral.
Mount the sensing surface in the required measurement plane. For horizontal illuminance, level it and prevent a mast, crossarm or cable from casting a shadow across it. For a specified work plane, use that plane and record the orientation. The roof, crop canopy and work surface can experience different light levels, so the installation point must match the controlled area.
For the NBL-W-LUX V3.0 current-output version, calculate Lux = (I - 4) / 16 x full-scale Lux, where I is in mA. For the 0-200000 Lux version, the following values are electrical scaling checks, not expected daylight levels at a particular site.
| Input signal | 0-200000 Lux conversion |
|---|---|
| 4 mA | 0 Lux |
| 8 mA | 50000 Lux |
| 12 mA | 100000 Lux |
| 20 mA | 200000 Lux |
| 2.5 V on the 0-5V version | 100000 Lux |
Use the actual ordered span if it differs. Applying the 200000 Lux conversion to a lower-range transmitter creates a scale error that cannot be repaired by cleaning the optical surface. Check the tag at both the PLC or logger and the receiving platform; a correct current input can still be displayed with the wrong engineering range.
The specified current-output load is no more than 300 ohms, while the voltage-output input resistance is at least 1 kohm. Compare those requirements with the receiving hardware and connection arrangement. A nominal 4-20mA input alone does not establish compatibility, and a signal test must follow the wiring diagram for the delivered version.
Verify an analog input with a suitable isolated test source while the sensor is disconnected as required by the test procedure. This checks the input and scaling. A second check with the installed sensor and a suitable light reference is still needed to assess the optical measurement.
The digital version uses RS485 Modbus RTU. Use 9600 baud, 8 data bits and no parity for the V3.0 configuration, with at least 1000 ms between communications; match the delivered stop-bit setting. Establish communication with one instrument before adding other addressed devices to the bus.
Confirm the delivered register definition and numerical conversion against the instrument's engineering value. Do not choose a multiplier simply because the first value looks plausible. A stable reference comparison at more than one light level can reveal a scale error that a successful Modbus response cannot.
RS485 carries the local measurement. A logger or gateway provides onward transmission if the project needs remote monitoring. Keep the Lux channel in Lux through that path; changing its label to PPFD or W/m2 on the server does not change what the sensor measures.
Greenhouse or lighting control should avoid rapid switching around one threshold. Use hysteresis or a time condition appropriate to the process. Keep raw or short-interval data for diagnosis and use a separate average for control where needed. Cloud movement can create genuine rapid changes outdoors.
Place control sensors where they represent the managed area, not directly under one lamp unless fixture output is the subject. Multiple zones may need multiple sensors. A single roof sensor cannot describe light below every shade screen or crop canopy.
Test a shade screen or lighting command through a complete operating cycle. Record what the sensor sees before and after movement, not just whether the actuator starts. A sensor above the screen may never observe the reduction in crop-level light that the control action produces below it.
In a building installation, check whether switching a nearby lamp directly changes the sensor reading enough to reverse the command. Sensor location and control hysteresis should prevent repeated cycling while still meeting the lighting objective. The appropriate thresholds and delays belong to that installation, not to a universal factory setting.
Dust, spray residue and condensation reduce light reaching the detector. Set cleaning frequency from observed fouling and record each event. Compare with a suitable reference under stable conditions, using the same plane and orientation. Handheld meters and installed sensors can disagree when they have different spectral responses; document the comparison method instead of forcing an arbitrary match.
For a fixed zero, first determine whether the sensor is genuinely dark. Then check supply and the selected input path: a live RS485 connection, an analog current or voltage reading, and the controller's mapped value answer different diagnostic questions. Do not treat a disconnected channel as a valid night observation.
For a fixed upper value, check whether the optical exposure exceeds the selected range and whether the receiving input is clipping. For a gradual decline, inspect contamination, new shade and mounting orientation before altering calibration. After cleaning, compare under stable light with the reference in the same plane and without an operator's shadow over either detector.
Not by directly integrating Lux as though it were PPFD. Daily light integral is a photon-based quantity. Select a suitable PAR measurement when the crop decision is specified that way, rather than applying one conversion across changing sunlight and lamp spectra.
That depends on low-level accuracy and resolution, not just full-scale range. Provide the actual switching threshold and required tolerance when requesting a configuration. Do not infer a small absolute error from the ability to measure bright daylight.
The listed operating range does not support that assumption. State the expected humidity, condensation and temperature conditions and request a suitable configuration or alternative. A protective housing must also preserve the required optical exposure.
Compare the ordered transmitter span with the controller's full-scale setting, then check the platform conversion. An electrical input test can locate the scaling error. If scaling is correct, investigate reference geometry, spectrum, contamination and actual light conditions.
Confirm supply, range, serial settings, delivered data definition and a commissioning comparison in Lux. Include the logger model and bus arrangement. Protocol naming alone does not verify the final numerical conversion.
Provide the required quantity and threshold, maximum expected light, measurement plane, temperature and humidity exposure, input type and cable route. State how many separately controlled zones need representation so the quotation matches the control layout.
Choose this illuminance sensor when the project actually needs Lux. Check environmental limits, measurement plane and receiving scale before using the reading to control a lighting zone. NiuBoL can review the operating conditions and controller input to identify the appropriate output and range.
Prev:Carbon dioxide sensor CO2 detection transmitter for Greenhouse agricultural output 4-20mA/RS485
Sensors & Weather Stations Catalog
 Agriculture Sensors and Weather Stations Catalog-NiuBoL.pdf
Weather Stations Catalog-NiuBoL.pdf
Agriculture Sensors Catalog-NiuBoL.pdf
Water Quality Sensor Catalog-NiuBoL.pdf
Related recommendations
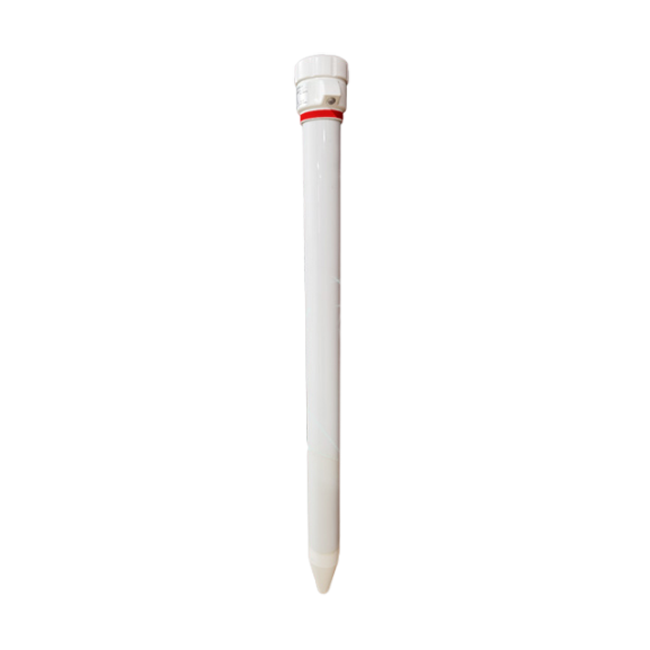 Multi-Depth Soil Sensor RS485
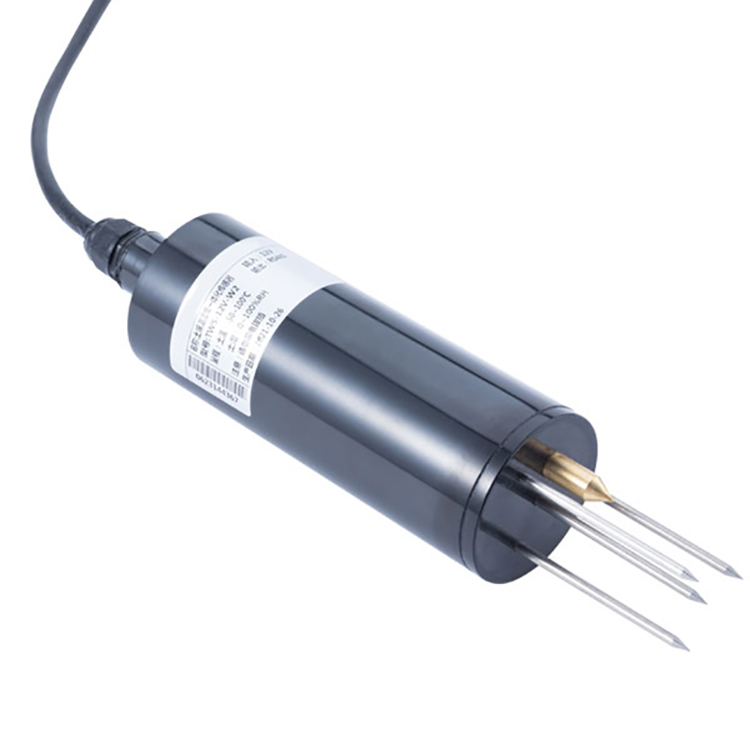 TDR Soil Moisture Sensor
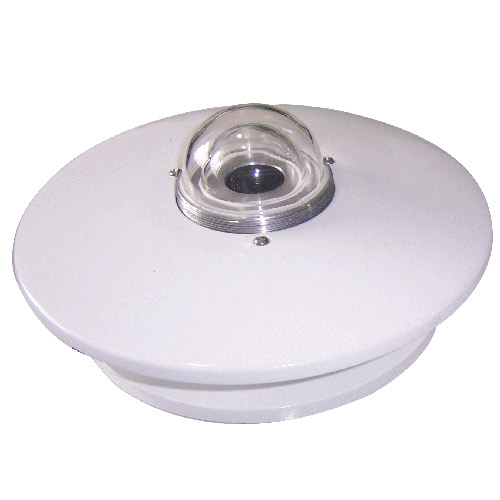 Pyranometer Solar Radiation Sensors
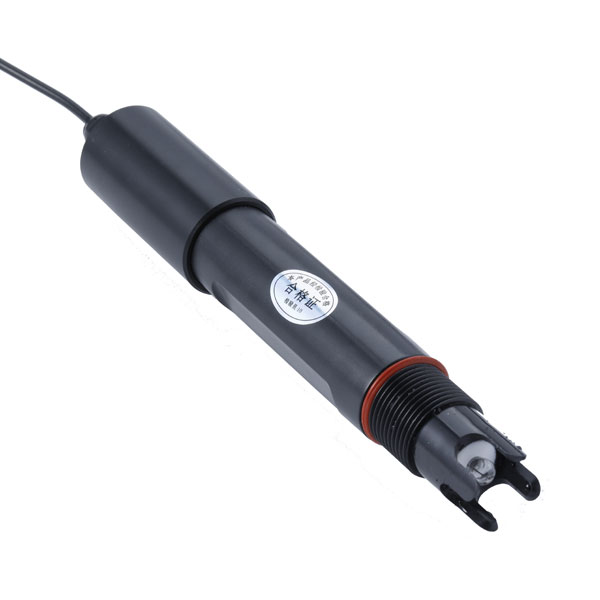 Soil ph sensor
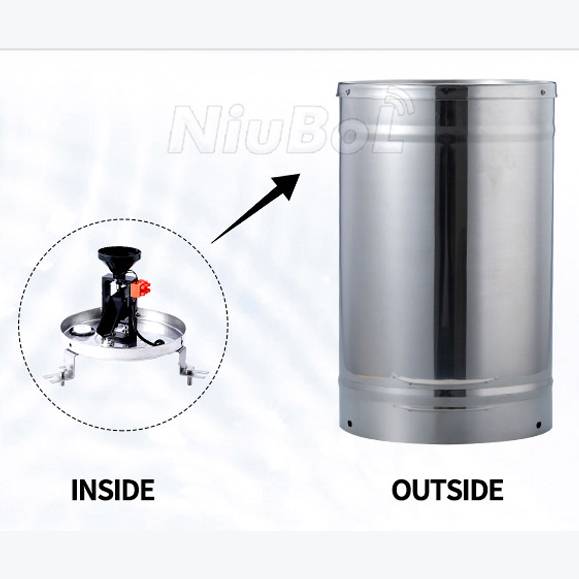 Tipping Bucket Rain Gauge
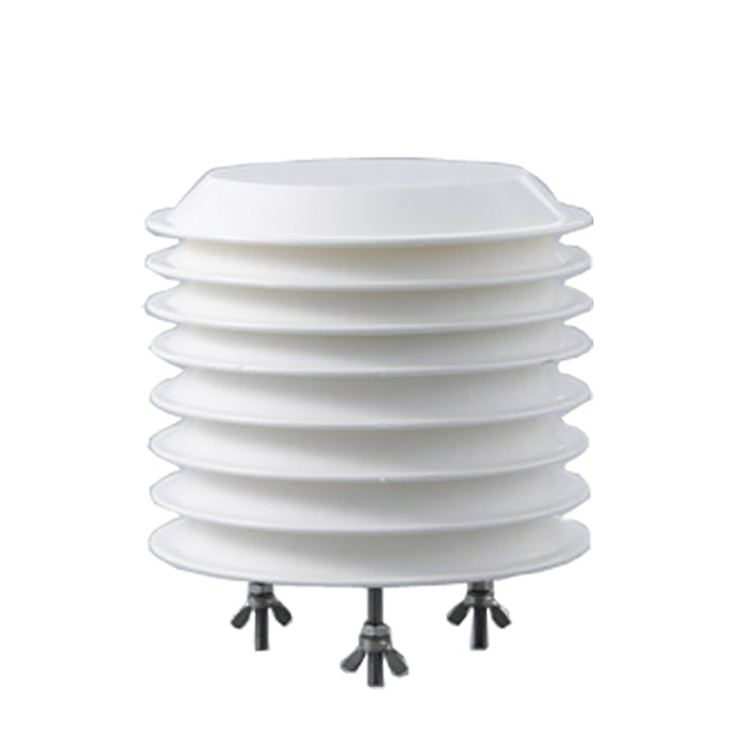 Air Temperature and Humidity Sensor


Screenshot, WhatsApp to identify the QR code
WhatsApp number:+8615367865107
(Click on WhatsApp to copy and add friends)

