





— Blogs —
—Products—
 Consumer hotline +8618073152920
WhatsApp:+8615367865107
Address:Room 102, District D, Houhu Industrial Park, Yuelu District, Changsha City, Hunan Province, China
Product knowledge
Time:2025-06-15 21:33:23 Popularity:4263
PM1, PM2.5 and PM10 describe airborne particulate matter grouped according to particle size. Their most important difference is the particle-size range included in each measurement. PM1 covers particles up to approximately 1 micrometer, PM2.5 covers particles up to 2.5 micrometers, and PM10 covers particles up to 10 micrometers.
These measurements are used in air quality monitoring, environmental studies, dust monitoring and industrial or urban observation. Although the three indicators are related, they are not interchangeable. A sensor designed to measure PM2.5 and PM10 does not necessarily provide a separate PM1 measurement.
Understanding the particle-size ranges, measurement methods and limitations of optical sensors is important when selecting particulate matter monitoring equipment.

The numbers 1, 2.5 and 10 refer to particle-size limits expressed in micrometers (μm). Regulatory PM size fractions are generally defined using aerodynamic diameter and specific sampling characteristics.
| Parameter | Nominal Particle Size | Measurement Significance |
|---|---|---|
| PM1 | ≤ 1 μm | Represents the smallest of these three commonly reported particulate mass fractions. |
| PM2.5 | ≤ 2.5 μm | Represents fine particulate matter, including the PM1 size fraction. |
| PM10 | ≤ 10 μm | Represents a broader inhalable particulate fraction, including PM2.5. |
These size fractions are nested rather than mutually exclusive:
PM1 ⊂ PM2.5 ⊂ PM10
For example, a particle with an aerodynamic diameter of 0.8 μm falls within the nominal PM1, PM2.5 and PM10 size ranges. A particle with an aerodynamic diameter of 5 μm falls within PM10 but not PM2.5 or PM1.
For comparable measurements of the same air sample, PM10 mass concentration would generally be expected to be at least as large as PM2.5, which would generally be at least as large as PM1. Readings from different instruments or algorithms may not always follow this relationship exactly because of measurement uncertainty and processing differences.
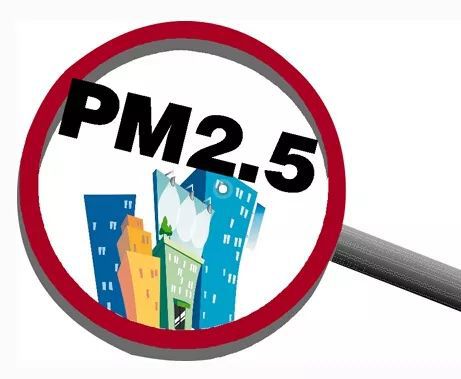
PM1 refers to a particulate matter size fraction with a nominal upper diameter of 1 μm. Depending on the environment, this fraction may include combustion-related particles, secondary atmospheric aerosols and other fine suspended particles.
PM1 measurements can be useful when investigating fine aerosol concentrations in indoor environments, urban areas and atmospheric studies.
However, PM1 is not the same as ultrafine particulate matter. Ultrafine particles are commonly defined as particles smaller than approximately 0.1 μm, while the PM1 category extends to 1 μm.
A sensor that reports PM1 does not necessarily detect every particle below 1 μm. The minimum detectable particle size, optical sensitivity and calculation method determine the portion of the aerosol population that the instrument can actually observe.
PM2.5 describes fine particulate matter with a nominal aerodynamic diameter of 2.5 μm or less. It includes smaller particles within the PM1 fraction as well as particles in the 1–2.5 μm size range.
PM2.5 may originate directly from combustion and industrial activities or form in the atmosphere through chemical reactions involving gaseous pollutants.
PM2.5 is widely monitored because fine particle exposure is associated with important respiratory and cardiovascular health effects. Actual exposure assessment depends on concentration, duration, particle composition and other environmental factors.
For environmental monitoring, the measurement is commonly expressed as a mass concentration in micrograms per cubic meter (μg/m³).
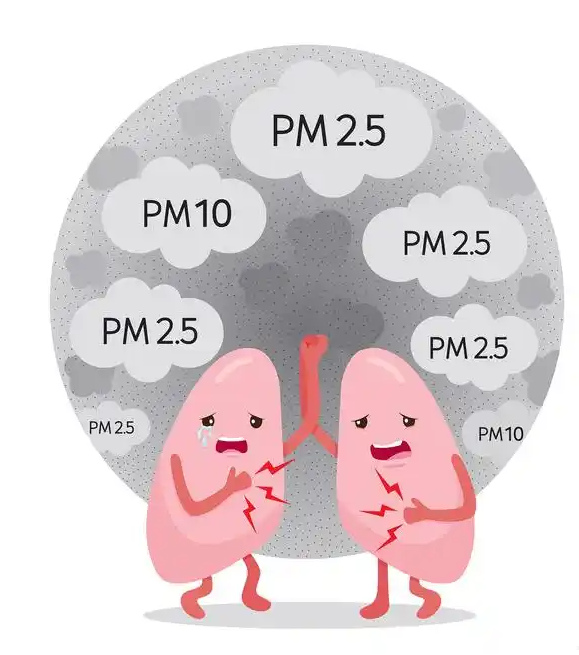
PM10 refers to the broader particulate matter fraction with a nominal aerodynamic diameter of 10 μm or less. It includes PM2.5 as well as larger particles in the approximate 2.5–10 μm range.
Coarser particles can be associated with activities such as construction, road dust resuspension, agricultural operations, material handling and natural dust transport.
PM10 monitoring is often useful where airborne dust is an important environmental concern. However, a PM10 reading alone does not identify the chemical composition, origin or specific health risk of the particles.
PM10 is also a mass-concentration measurement. It should not be interpreted as simply counting all visible dust particles in the air.
Many compact particulate matter sensors use laser light scattering to estimate airborne particle concentrations. They differ from laboratory or reference gravimetric methods that collect particles on filters for mass determination.
In a typical optical sensor, air passes through a measurement chamber containing a light source and photodetector. Suspended particles scatter incident light, and the photodetector measures the resulting optical signals.
The instrument processes these signals to estimate particle characteristics. A calculation model is then used to estimate particulate mass concentration for the supported PM size fractions.
Air Sample → Optical Scattering Detection → Signal Processing → Particle-Size Estimation → PM Mass Concentration
Optical sensors generally do not weigh the particles directly. Converting scattered-light information into estimated mass concentration requires assumptions or calibration relationships involving particle properties.

A key limitation of optical particulate sensors is that the light-scattering response depends on more than particle concentration alone.
Particle size, shape, density and optical properties can influence the relationship between the measured signal and estimated particulate mass. Environmental conditions, particularly relative humidity, may also affect the result.
At elevated humidity, some airborne particles absorb water and grow in size. This can increase light scattering and cause higher estimated PM concentrations. Fog droplets, condensation, contamination and airflow restrictions may also interfere with optical measurements.
| Factor | Potential Effect |
|---|---|
| Relative Humidity | Hygroscopic particle growth can change the scattering signal. |
| Particle Composition | Different refractive indices and densities affect mass estimates. |
| Particle-Size Distribution | Different aerosol populations may produce different sensor responses. |
| Airflow and Contamination | Blocked inlets or contaminated optical components can affect measurements. |
| Calibration | The relationship between optical signals and mass estimates depends on the calibration method. |
For research or regulatory applications, confirm whether the instrument's measurement method, calibration and validation meet the project's requirements. An ordinary optical PM sensor should not automatically be treated as an approved regulatory reference monitor.
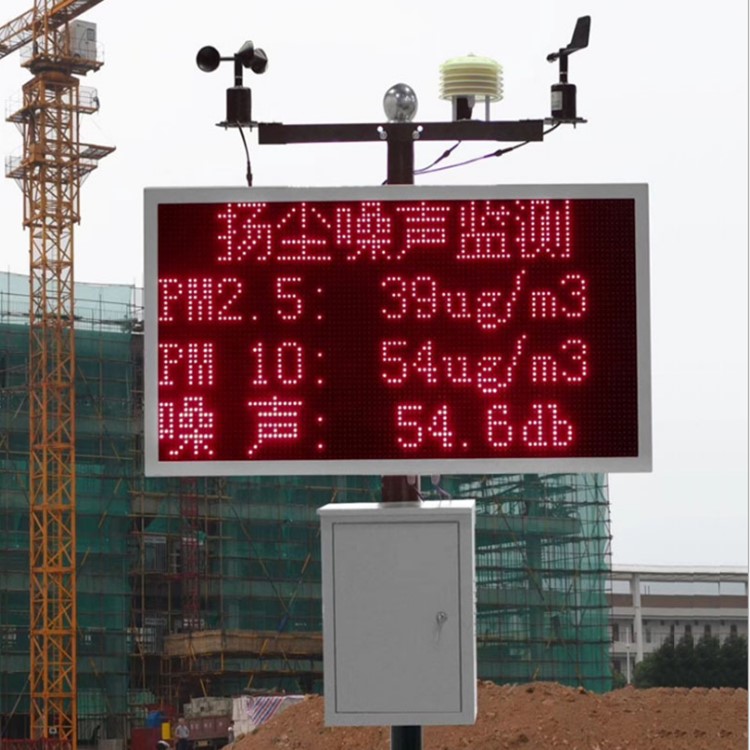
No. PM1, PM2.5 and PM10 are cumulative size fractions. PM2.5 already includes the PM1 size fraction, while PM10 includes the PM2.5 size fraction.
Adding PM1, PM2.5 and PM10 values together would count some particles more than once and would not produce a meaningful total particulate concentration.
For comparable PM measurements, the approximate coarse fraction between 2.5 and 10 μm can be estimated by subtracting PM2.5 mass concentration from PM10. This difference should be interpreted with the measurement uncertainty of the instrument in mind.
For example, if a monitoring system reports PM2.5 = 35 μg/m³ and PM10 = 80 μg/m³, the approximate PM10–PM2.5 coarse fraction is 45 μg/m³. This is an illustrative calculation rather than an actual measurement result.
The most suitable particulate matter measurement depends on the monitoring objective.
Urban and roadside air monitoring: PM2.5 and PM10 are commonly selected because they provide complementary information about fine and broader airborne particle fractions.
Construction and dust monitoring: PM10 is useful for observing broader dust concentration trends, while PM2.5 may provide additional information about finer particles.
Indoor air monitoring: PM2.5 is often an important indicator. PM1 may be added when the selected instrument supports that measurement and the application specifically requires it.
Atmospheric aerosol research: Projects requiring detailed particle-size distributions, number concentration or ultrafine particle measurements may need specialized instruments beyond a standard PM2.5/PM10 sensor.
The selection should also consider the measurement range, sensor performance, environmental conditions, data logging requirements and whether comparison with a reference method is necessary.
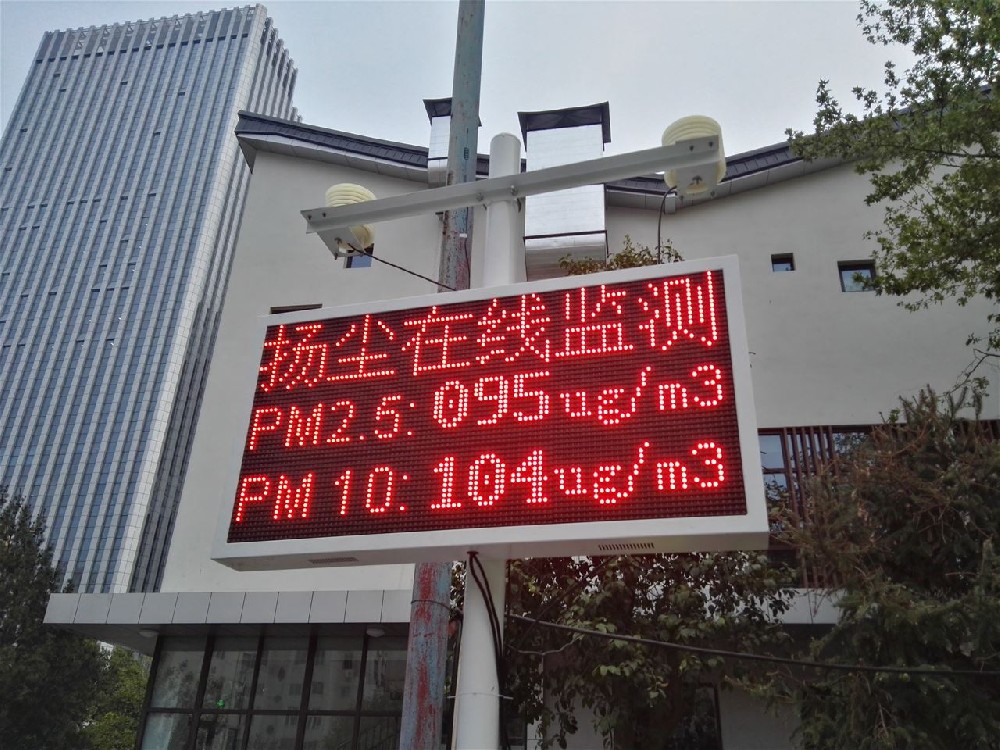
The NiuBoL NBL-W-PM Integrated Sensor uses laser scattering technology to estimate airborne PM2.5 and PM10 mass concentrations.
It is designed for integration with compatible environmental monitoring equipment. Its published documentation confirms PM2.5 and PM10 measurements; it does not establish a separate PM1 output for this model.
| Parameter | Published Specification |
|---|---|
| Product | NBL-W-PM Integrated Sensor |
| Measurement | PM2.5 and PM10 |
| Measurement Principle | Laser light scattering |
| PM2.5 Range | 0–1000 μg/m³ |
| PM10 Range | 0–2000 μg/m³ |
| Minimum Detectable Particle | 0.3 μm |
| Power Supply | DC 12–24V |
| Standard Output | RS485 |
The minimum detectable particle size of 0.3 μm does not mean the sensor directly detects all ultrafine particles below 0.1 μm. Nor does it establish that the product provides a separately calibrated PM1 reading.

The installation location should provide representative airflow while protecting the instrument from conditions that can interfere with optical measurements.
For the NBL-W-PM integrated sensor, the technical manual specifies vertical installation, suitable airflow access and protection against sticky particles or excessive moisture. The sensor should not be installed where nearby equipment creates unrepresentative airflow through its inlet.
The outdoor mounting arrangement should also account for the sensor's operating limits, environmental exposure, cable protection and accessibility for inspection.
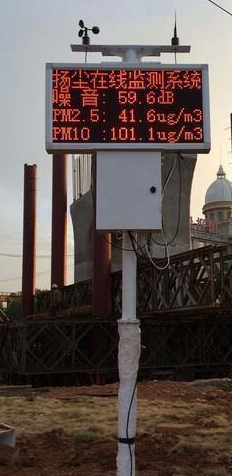
A compatible RS485 data logger or IoT gateway can collect PM2.5 and PM10 measurements for local recording or remote monitoring. Network transmission and cloud functions depend on the connected acquisition and communication equipment.
No. PM1 includes particles with a nominal upper diameter of 1 μm, while ultrafine particles are commonly defined as particles smaller than approximately 0.1 μm.
Not necessarily. PM1 requires an instrument with suitable detection capability and a supported PM1 calculation or measurement output. A PM2.5 reading cannot simply be converted into PM1 without an appropriate measurement method.
Yes. PM10 represents a broader nominal particle-size fraction that includes PM2.5. The measured values should not be added together as independent quantities.
Not automatically. Regulatory applications may require specific reference or equivalent methods, performance verification, calibration and data quality procedures. Suitability must be assessed against the applicable requirements.
The NBL-W-PM technical manual provides the sensor specifications, wiring instructions, RS485 communication details and installation requirements.
 NBL-W-PM25-PM10-Integrated-sensors-Manual.pdf
For particulate matter monitoring, first confirm whether the application requires PM1, PM2.5, PM10, particle number concentration or a detailed particle-size distribution. These are different measurement requirements and may require different instruments.
For projects requiring PM2.5 and PM10 monitoring, review the NiuBoL Integrated PM2.5 and PM10 Sensor.
For model selection, specify the required PM parameters, measurement range, installation environment, required data quality, output interface, power supply, monitoring system and project quantity.
Related recommendations
Sensors & Weather Stations Catalog
 Agriculture Sensors and Weather Stations Catalog-NiuBoL.pdf
Weather Stations Catalog-NiuBoL.pdf
Agriculture Sensors Catalog-NiuBoL.pdf
Water Quality Sensor Catalog-NiuBoL.pdf
Related products
 Combined air temperature and relative humidity sensor
 TDR Soil Moisture & Temperature Sensor for irrigation| RS485 |4-20mA| NBL-S-THR
 Soil pH sensor RS485 soil Testing instrument soil ph meter for agriculture |NBL-S-PH
 Wind Speed sensor Output Modbus/RS485/Analog/0-5V/4-20mA
 Tipping bucket rain gauge for weather monitoring auto rainfall sensor RS485/Outdoor/stainless steel
 Pyranometer Solar Radiation Sensor 4-20mA/RS485


Screenshot, WhatsApp to identify the QR code
WhatsApp number:+8615367865107
(Click on WhatsApp to copy and add friends)

