





— Blogs —
—Products—
 Consumer hotline +8618073152920
WhatsApp:+8615367865107
Address:Room 102, District D, Houhu Industrial Park, Yuelu District, Changsha City, Hunan Province, China
Product knowledge
Time:2025-11-21 14:57:34 Popularity:832
Field weather station rainfall and soil moisture can disagree without either instrument being faulty. A rain gauge measures precipitation at its opening; a buried probe measures soil conditions around its sensing volume. Canopy interception, runoff, irrigation, probe depth and the time needed for water to move through soil can produce different responses. Diagnose the event and measurement locations before changing irrigation settings or replacing equipment.
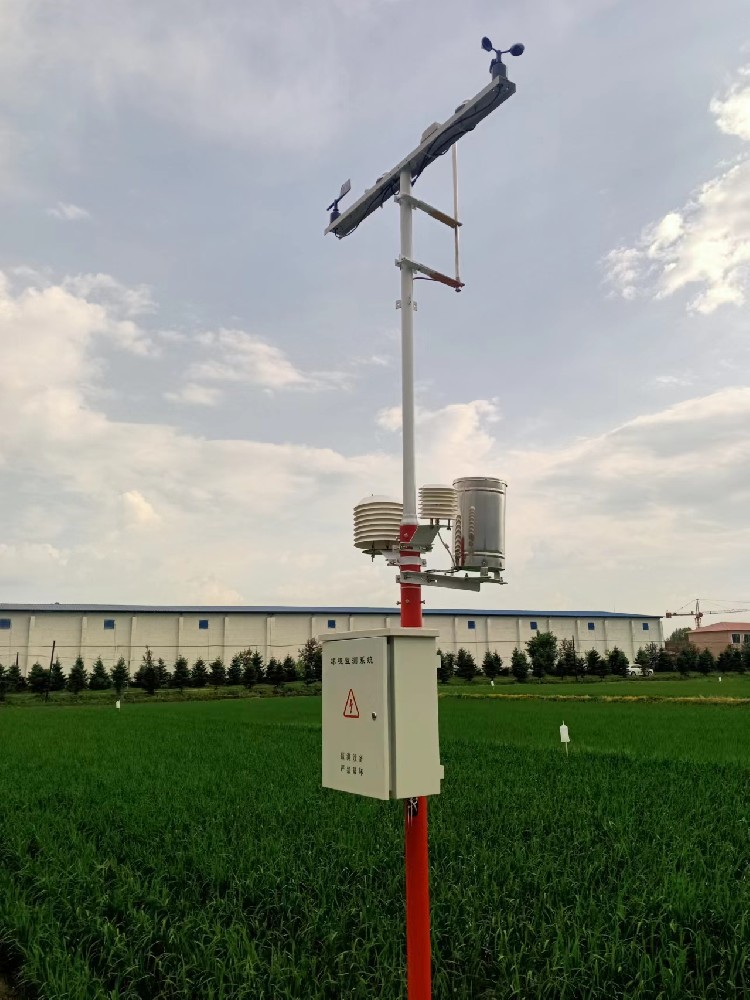
A farm manager sees rain on the dashboard but little change at a buried probe. The immediate question is not which sensor is wrong. First establish whether rain reached that soil point, whether it infiltrated to the sensing depth, and whether both records cover the same period. A shallow shower and a sustained event may have very different effects on a deeper root-zone observation.
The opposite pattern also occurs: the probe becomes wetter while the weather station reports no rainfall. Drip irrigation, nearby sprinkler operation, lateral movement or a local event outside the gauge's exposure can explain this. A weather station does not measure every water input to a crop block. Keep irrigation event records alongside weather and soil data.
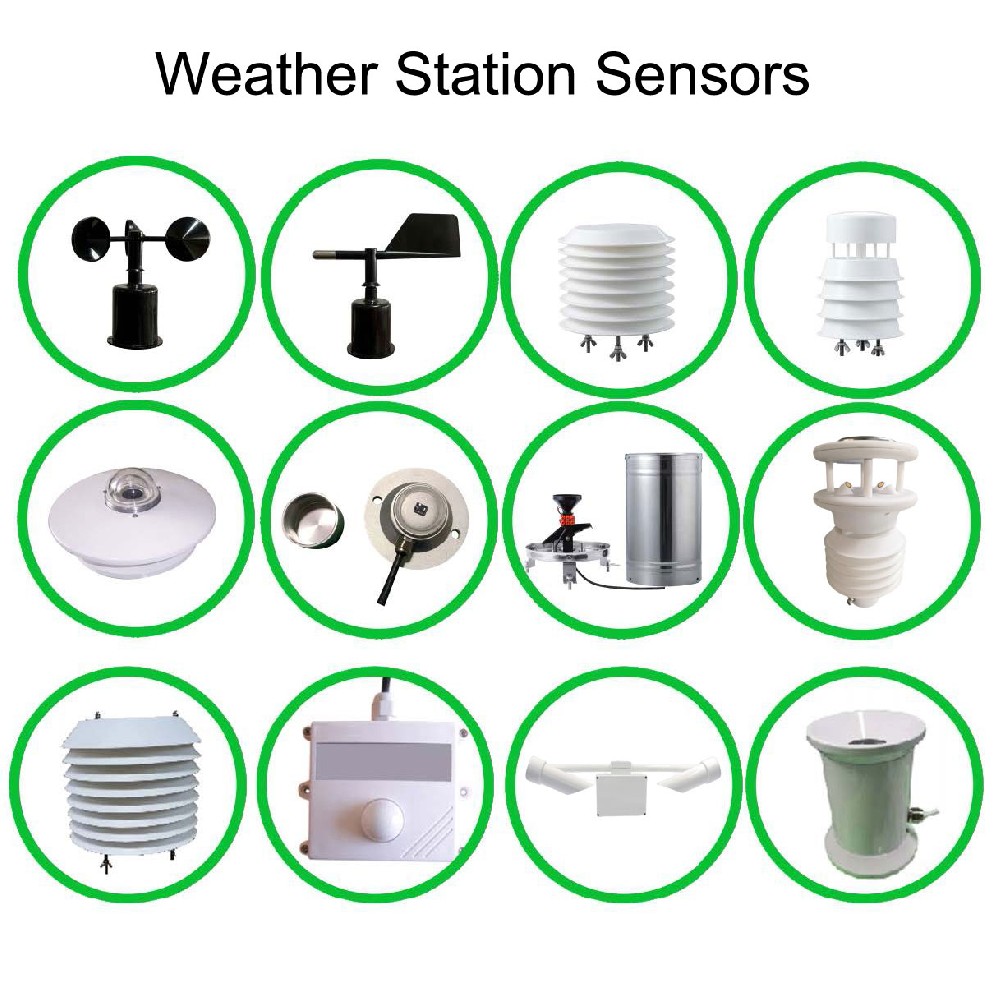
The 0.5 mm NBL-W-RS tipping-bucket gauge counts a defined collection increment. The NBL-S-THR uses TDR to measure soil moisture and temperature around its installed probe. It does not measure rainfall, root uptake, soil EC or the amount applied by an irrigation valve.
| Selected model | Relevant specification | Interpretation |
|---|---|---|
| NBL-W-RS, 0.5 mm version | 0.5 mm resolution; intensity range 0-4 mm/min | Use the correct increment; do not apply a different bucket's multiplier |
| NBL-W-RS accuracy condition | +/-4% in an indoor static test at 2 mm/min | Not a guarantee for every wind exposure and event intensity |
| NBL-S-THR | Moisture output 0-100%, resolution 0.1%; temperature -50 to 100 C | Local soil channels, not a field-wide water balance |
| NBL-S-THR integration | DC 12-24 V; RS485 Modbus RTU, 4-20 mA or 0-5 V versions; IP68 | Match the ordered output and protect external cable connections |
Do not use the probe's full temperature measuring range as the station's ambient operating rating: the NBL-S-THR operating environment is -40 to 80 C. The selected 0.5 mm rain gauge lists an operating temperature of 0 to 50 C. Frozen precipitation needs a suitable measurement arrangement rather than an assumption that an unheated liquid-rain gauge will capture it correctly.
| Observed pattern | Check first | Useful follow-up |
|---|---|---|
| Rain recorded, deep soil unchanged | Event size, depth, runoff and canopy interception | Compare shallower observations and later response |
| Soil wetter, no rain recorded | Irrigation times and local water sources | Inspect the emitter relationship and gauge condition |
| One probe changes, another does not | Depth, soil texture, crop block and water application | Compare like positions before assuming sensor drift |
| Rain total changes at midnight | Time zone, daily boundary and cumulative counter | Compare event increments across the same period |
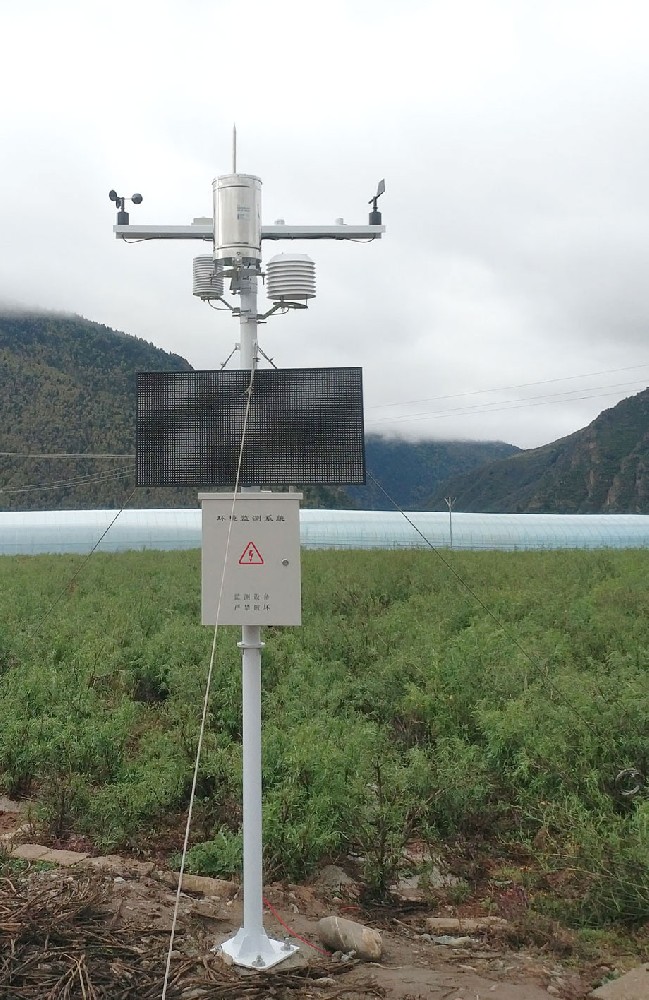
In a drip-irrigated orchard, a probe beside an emitter and one between rows answer different questions. In a sprinkler-irrigated block, a gauge inside the wetted area may collect irrigation as well as rain. Under cover, an outdoor weather station may record rain that never reaches the crop. Mark these relationships on a site sketch before choosing a fault explanation.
For an illustrative calculation, suppose volumetric water content rises by 0.04 m3/m3, or four percentage points, throughout a 0.20 m soil layer. The corresponding storage increase is 0.04 x 0.20 x 1000 = 8 mm of water. This calculation requires a representative layer-average change; a single point probe does not prove that the whole layer changed uniformly.
Even a correctly estimated storage increase need not equal rainfall. Water may run off, drain below the layer, evaporate or be supplied by irrigation. A soil moisture increase is also expressed in percentage points, not the same unit as rain depth. Avoid comparing an 8 mm shower directly with an 8% display change as if the numbers should match.
For RS485 Modbus RTU soil sensors, confirm channel identity, scaling and time stamps at the logger. For a pulse-output rain gauge, confirm the logger's counter input and the multiplier for the installed bucket. RS485 and pulse inputs are not interchangeable. The NBL-PH-1 provides configured acquisition and FLASH recording, with a saving interval of 1-240 minutes; this is not automatically the sensor polling or upload interval.
Inspect a probe for poor soil contact, disturbed backfill or a preferential water path along its cable. Soil texture and electrical properties can affect interpretation; do not assume immunity to every salinity or fertilizer condition. Inspect the gauge for blockage, level and water exposure. Use the appropriate gauge test procedure rather than an uncontrolled pour to establish accuracy.
Not from that observation alone. Check effective water reaching the crop, root-zone condition and the agreed irrigation strategy. Recorded precipitation does not establish how much usable water remains in a specific soil layer.
Not necessarily. Infiltration depth and timing depend on the event and soil. Compare the installation depth, shallow response and later records before diagnosing the instrument.
No. It samples a local soil volume affected by depth and water distribution. It can support a defined monitoring point, but cannot replace precipitation measurement or prove field-wide infiltration.
Use an appropriately exposed precipitation gauge outside unintended irrigation spray and retain irrigation event records. If a gauge intentionally measures sprinkler application, identify that purpose separately in the dataset.
Send synchronized rain and soil traces, models and output versions, probe depths, a site sketch, irrigation times and photos of the installations. These details help distinguish a location effect from a counting or decoding error.
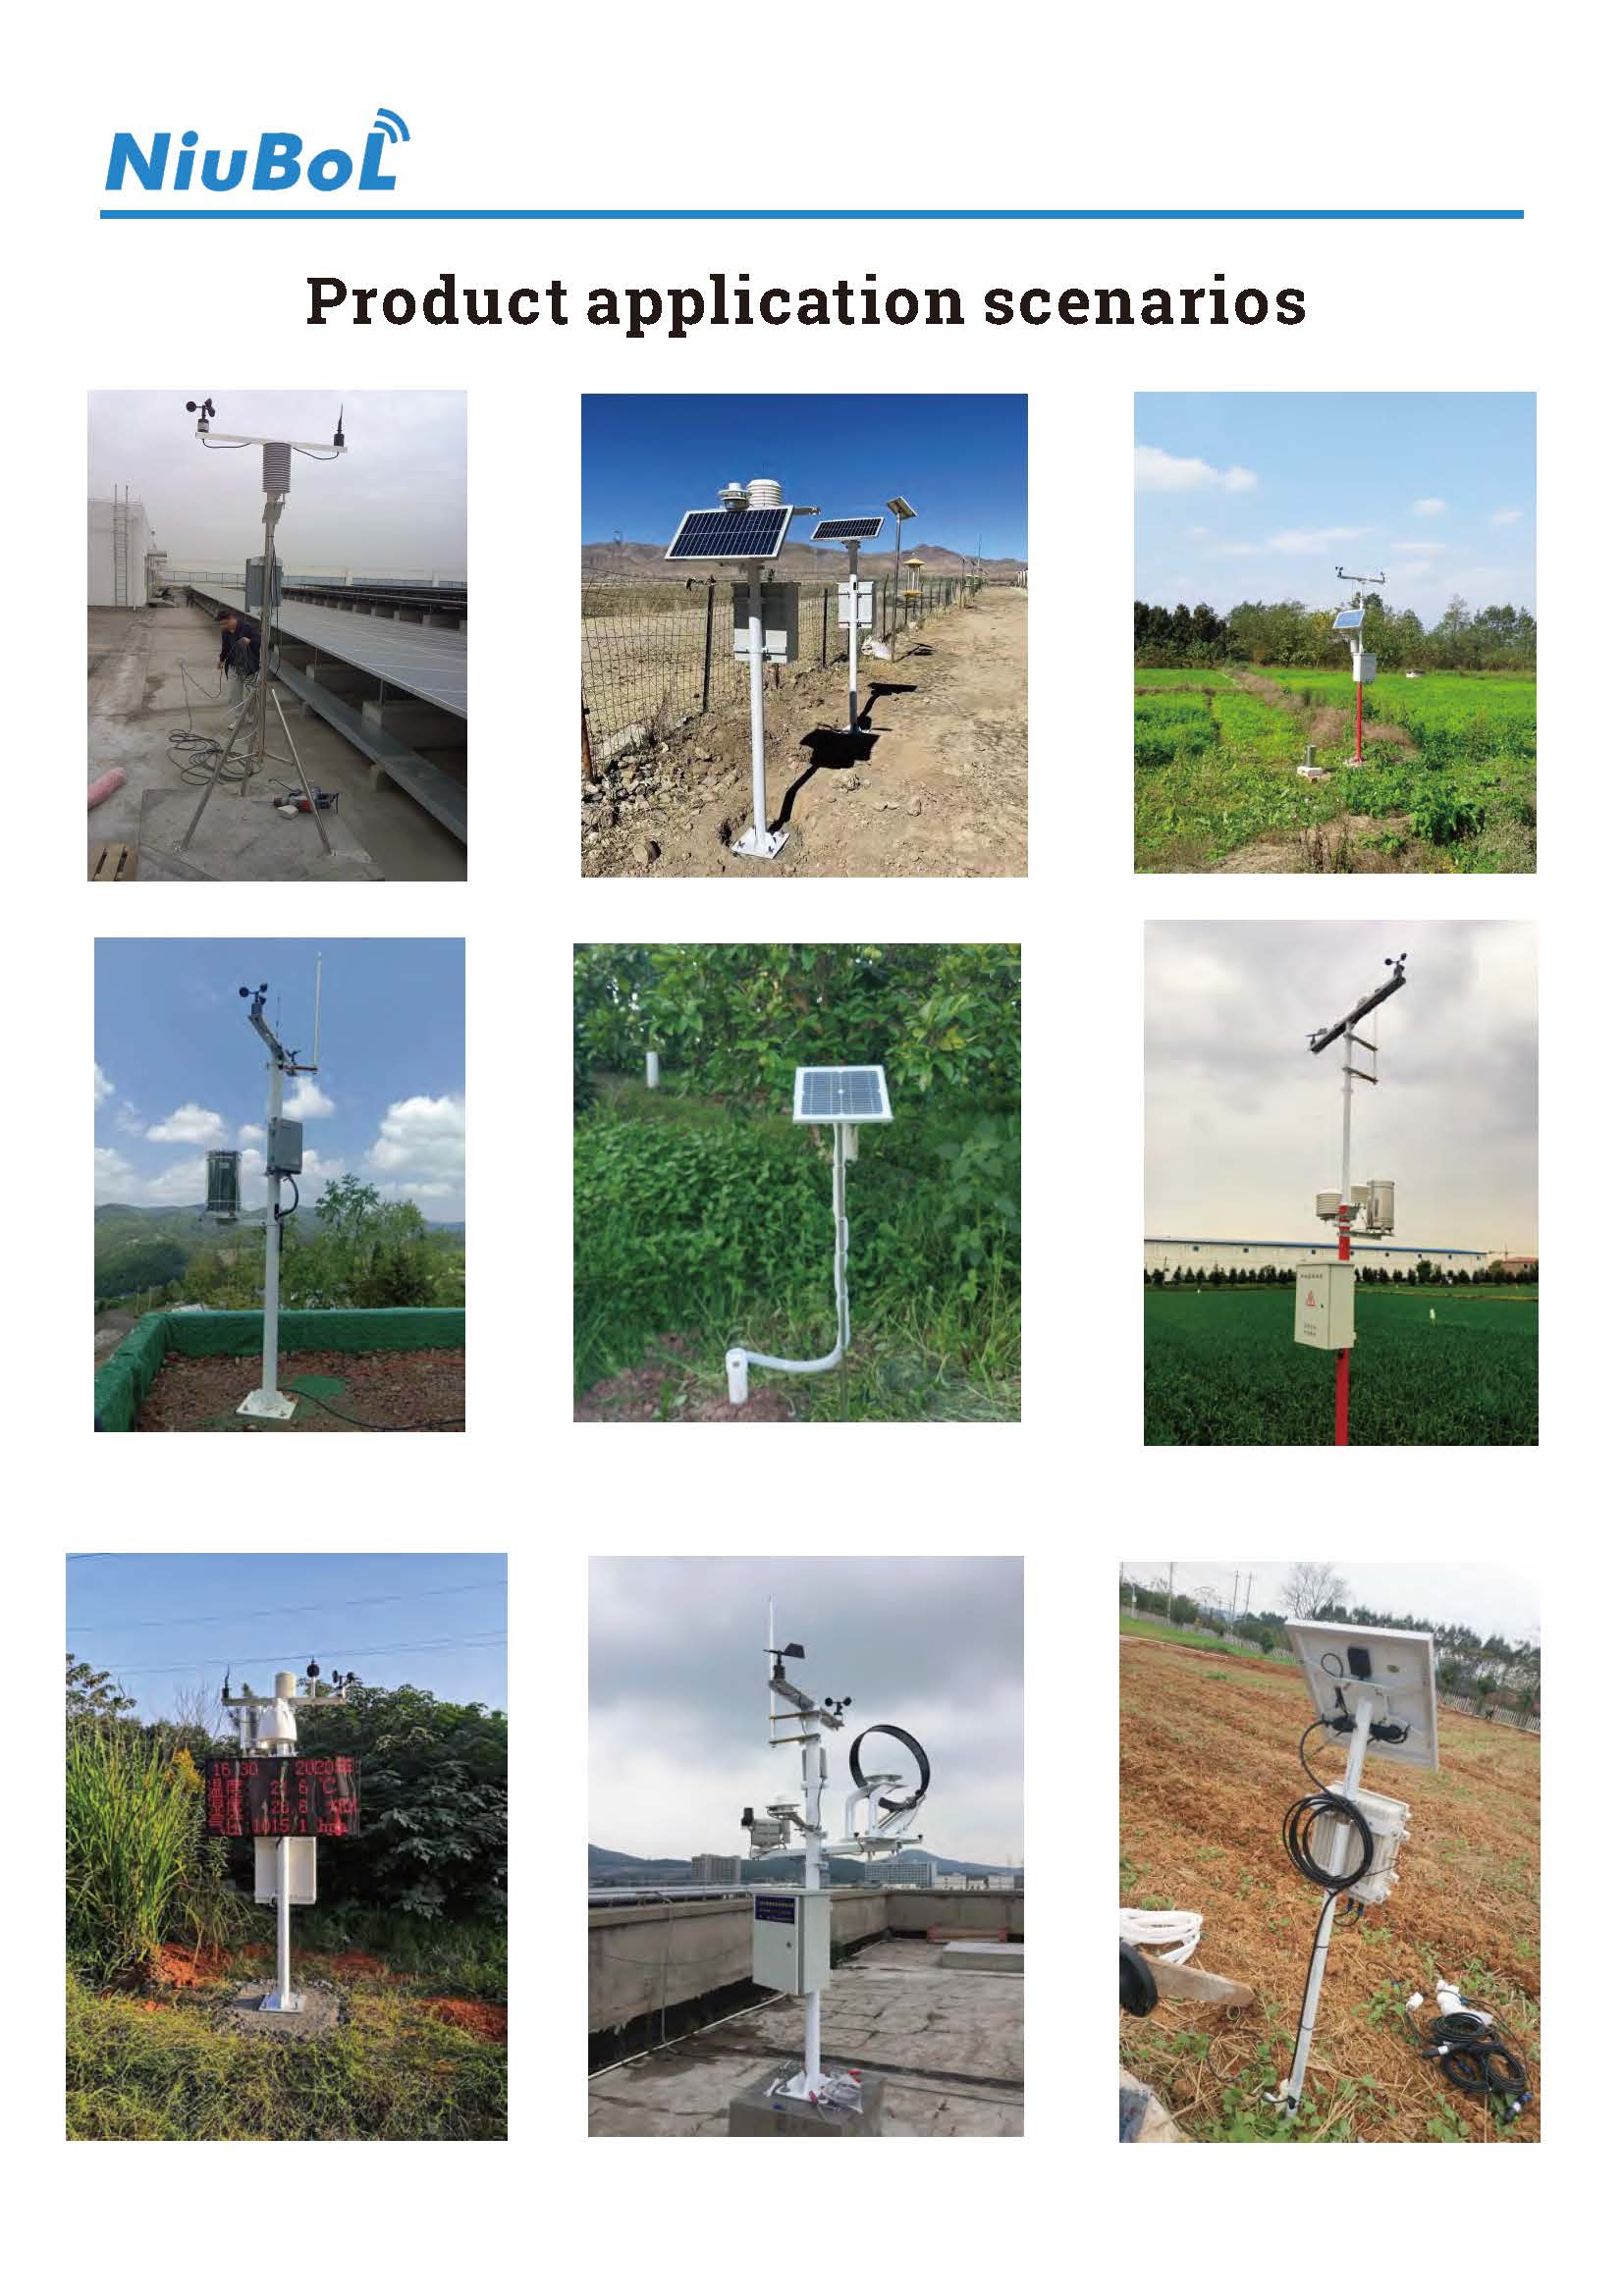
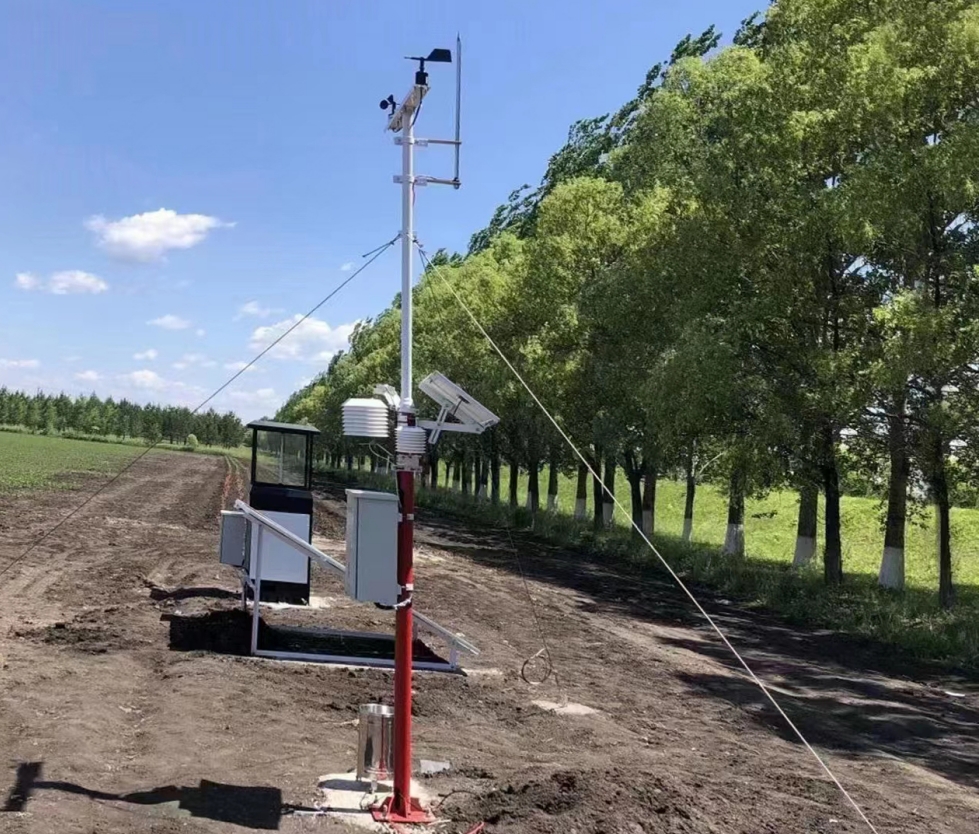
Use field weather station rainfall as precipitation evidence and soil moisture as local root-zone context. They are complementary measurements, not duplicate readings that must rise together. Check location, depth, event timing and signal conversion before modifying the system. A project designed around these differences can support irrigation decisions without promising a fixed water-saving result.
Prev:Automatic Weather Station Sensor Principles: What Each Channel Measures
Next:Agricultural Weather Station for Crop Disease Monitoring: Inputs and Limits
Related recommendations
Sensors & Weather Stations Catalog
 Agriculture Sensors and Weather Stations Catalog-NiuBoL.pdf
Weather Stations Catalog-NiuBoL.pdf
Agriculture Sensors Catalog-NiuBoL.pdf
Water Quality Sensor Catalog-NiuBoL.pdf
Related products
 Combined air temperature and relative humidity sensor
 TDR Soil Moisture & Temperature Sensor for irrigation| RS485 |4-20mA| NBL-S-THR
 Soil pH sensor RS485 soil Testing instrument soil ph meter for agriculture |NBL-S-PH
 Wind Speed sensor Output Modbus/RS485/Analog/0-5V/4-20mA
 Tipping bucket rain gauge for weather monitoring auto rainfall sensor RS485/Outdoor/stainless steel
 Pyranometer Solar Radiation Sensor 4-20mA/RS485


Screenshot, WhatsApp to identify the QR code
WhatsApp number:+8615367865107
(Click on WhatsApp to copy and add friends)

