





— Blogs —
—Products—
 Consumer hotline +8618073152920
WhatsApp:+8615367865107
Address:Room 102, District D, Houhu Industrial Park, Yuelu District, Changsha City, Hunan Province, China
Product knowledge
Time:2026-02-17 10:50:40 Popularity:666
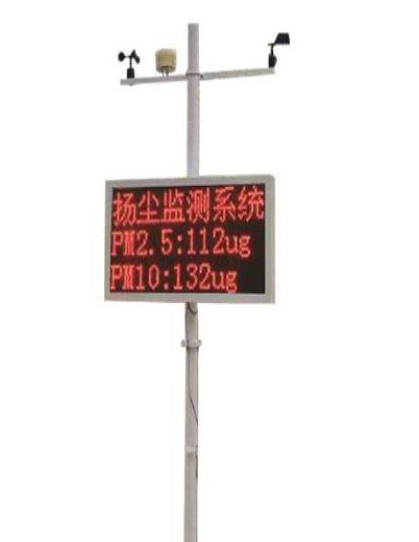
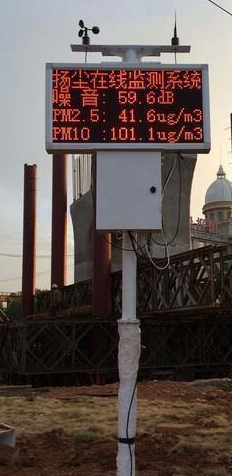
Dust and noise monitoring data need separate definitions before they can share an alarm screen. Particulate concentration, a fast sound-level reading and an equivalent sound level are different quantities with different time behavior. A NiuBoL monitoring installation should preserve those meanings from the instrument through the logger and platform. Simultaneous peaks can justify investigation, but they do not automatically identify the source or establish regulatory compliance.
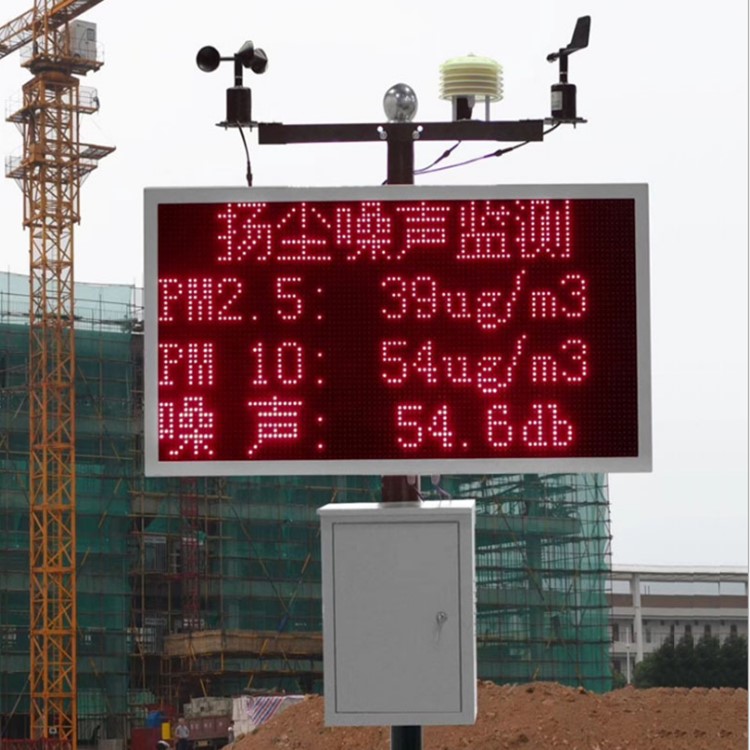
The NBL-W-PM uses optical scattering to estimate PM2.5 and PM10 concentrations. PM10 includes smaller particles within its defined fraction; do not add PM2.5 to PM10 to create a new total. A reading labelled TSP also requires the corresponding measurement capability rather than a renamed PM10 channel.
Keep concentration units explicit. A hypothetical 0.100 mg/m3 equals 100 ug/m3. If one system interprets the number as micrograms and another as milligrams, a factor-of-1000 error can pass through a visually plausible trend. Verify the raw scale and unit at acquisition and export.
Optical results depend on the aerosol and measurement conditions. Moisture, droplets, inlet contamination and the local sampling environment can influence the indication. A clean communications packet does not validate the particle measurement. Check sampling and reference comparison separately from the software connection.
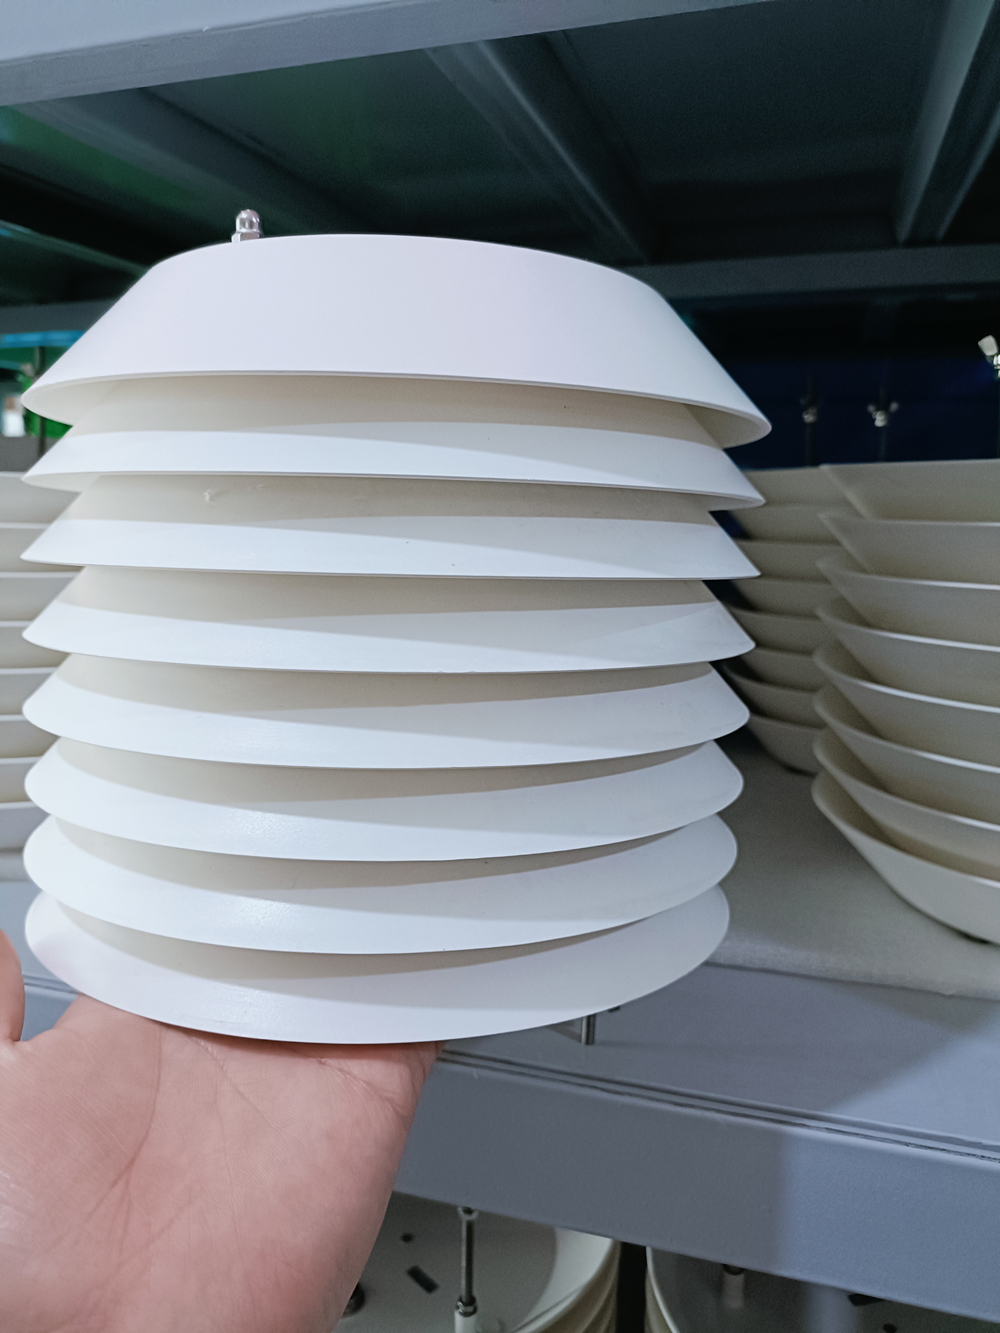
| Component | Selected specification | Integration consequence |
|---|---|---|
| NBL-W-PM particulate channels | PM2.5 0-1000 ug/m3; PM10 0-2000 ug/m3 | Preserve fraction, scale and unit independently |
| NBL-W-PM supply and output | DC 12-24 V; RS485 Modbus RTU | Use its actual map and required polling interval |
| NBL-W-PM environment | -20 to 60 C; 0-99% RH | Environmental range is not immunity to wet aerosol or condensation |
| NBL-W-NS V3 sound channel | 30-130 dB; frequency range 31.5 Hz-8 kHz; RS485 | Confirm weighting and reported sound metric before labelling the output |
| NBL-W-NS V3 supply and environment | DC 12 V; -15 to 50 C; below 80% RH | Do not apply the PM probe's supply ceiling or environmental limits to it |
The NBL-W-PM particulate sensor and NBL-W-NS V3 values above apply to identified component versions, not every noise instrument offered under a similar name. Other revisions can have different interfaces and limits. Identify the actual delivered version before copying its settings.
An outdoor enclosure or weather sensor does not make the complete assembly suitable for an explosive atmosphere. Hazardous-area use requires an appropriately qualified configuration and assessment. A generic dust-and-noise proposal must not be treated as evidence of that suitability.
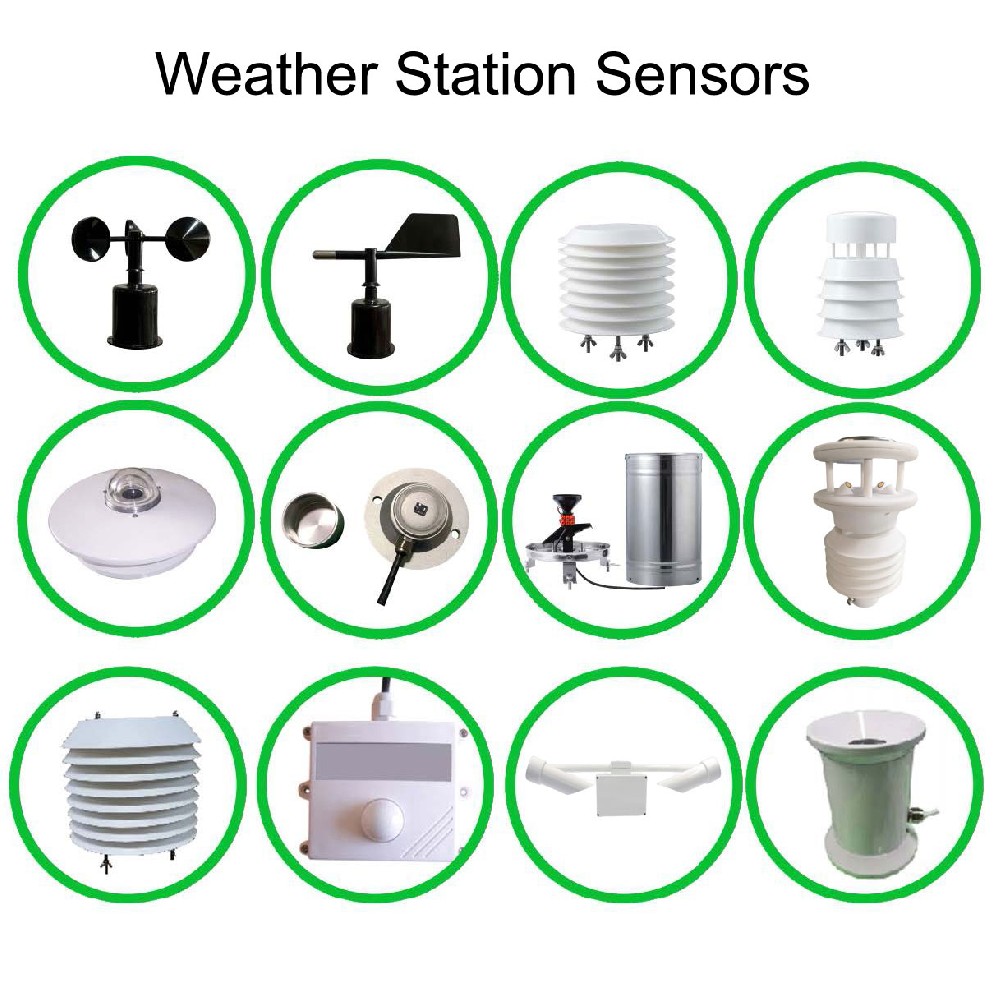
Ask whether the reported sound value is a time-weighted level, an interval equivalent level, a maximum or another quantity. Record its frequency weighting and interval. A short response setting does not establish that the device internally calculates LAeq for a requested reporting period.
Decibels are logarithmic. If two valid equal-duration equivalent sound levels with the same weighting and reference are 60 dB and 80 dB, their combined equivalent level is 10 x log10[(10^6 + 10^8)/2], or approximately 77.0 dB. The ordinary arithmetic mean is 70 dB and does not represent that energy average. This example is mathematical, not a measured NiuBoL performance result.
Do not use this example to claim a compliant LAeq calculation from arbitrary sparse display readings. The inputs, coverage, instrument response and calculation method must support the intended metric. Confirm the actual acquisition chain, calibration and applicable measurement requirements when a project needs formal noise assessment rather than an operational indication.
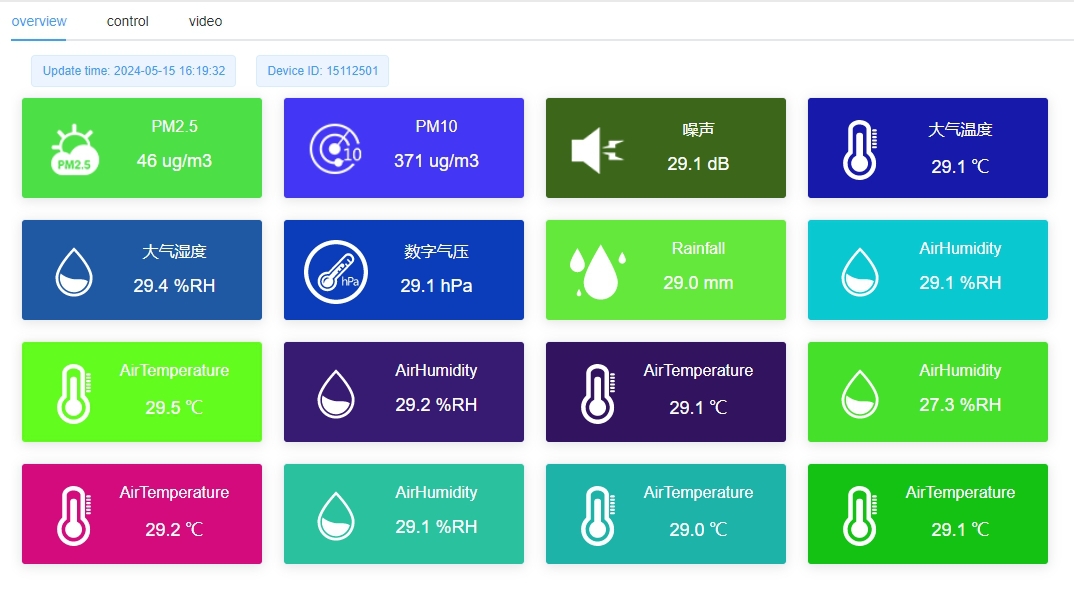
A one-minute particulate record and a rapidly updated sound reading do not describe the same period merely because both appear at 10:00. Define whether timestamps mark interval start, interval end or receipt time. Keep aggregation and any local processing delay with the record.
For an event investigation, use a compatible time window and retain the raw channel definitions. A truck movement could coincide with dust and noise, but so could different activities occurring near each instrument. A shared peak is correlation, not source attribution. Wind observations and an appropriately timed operational log can help investigate the difference.
Video can add context only when it is actually included and synchronized. A camera image received after a peak does not automatically document the activity that produced it. Specify the capture trigger, clock relationship and retention if the project needs event review; do not assume these functions exist in every data logger.
Disconnect a channel under the approved test procedure and confirm that the platform identifies it as unavailable. A lost noise reading must not become a plausible quiet value, and a PM timeout must not become clean air. Preserve each channel's age and validity, even when the other channel continues normally.
Check scaling against known test values and use the supplied protocol for the selected device. RS485 Modbus RTU does not determine all register meanings, output validity codes or platform functions. Match the instruments individually before combining them in one station record.
If dust-suppression equipment or alarm outputs are included, test their approved command and feedback path separately. A sensor threshold does not establish that a relay is fitted, that a pump ran or that exposure has been controlled. Keep operator rules and safe equipment behavior within the actual control design.
For acceptance, demonstrate one normal record, a controlled test input, a missing channel and a reporting interruption. Distinguish software checks from physical calibration. Storage duration, remote settings and historical retransmission need evidence from the ordered logger and service rather than a generic system description.
No. They are overlapping particle fractions, not independent masses to sum into a total. Preserve the channel definitions and request a suitable TSP measurement if required.
Not to obtain an equivalent sound level. That calculation uses energy and valid duration information. Sparse sound display readings may not support the required metric at all.
No. Time response and equivalent-level integration are different properties. Obtain the reported metric and interval from the delivered instrument and acquisition method.
No. First align observation periods, then use appropriate site and activity evidence. Correlation alone does not establish attribution.
Do not assume suitability. The complete configuration needs the appropriate qualification and site assessment; an outdoor housing or generic industrial label is insufficient.
List particle fractions, sound metric, intervals, component versions, environmental limits, reporting destination and any control outputs. Separate instruments, logger functions, calibration and event-review services.
Dust and noise monitoring data become useful when units, sound metrics, timing and validity remain explicit. NiuBoL sensors can provide the selected channels, while a verified integration keeps physical measurement, event interpretation and downstream control as separately testable functions.
Prev:Dust and Noise Monitoring System: Selection Guide for Construction Sites
Next:Agricultural Four-Condition Monitoring Expansion: Build a Useful First Phase
Related recommendations
Sensors & Weather Stations Catalog
 Agriculture Sensors and Weather Stations Catalog-NiuBoL.pdf
Weather Stations Catalog-NiuBoL.pdf
Agriculture Sensors Catalog-NiuBoL.pdf
Water Quality Sensor Catalog-NiuBoL.pdf
Related products
 Combined air temperature and relative humidity sensor
 TDR Soil Moisture & Temperature Sensor for irrigation| RS485 |4-20mA| NBL-S-THR
 Soil pH sensor RS485 soil Testing instrument soil ph meter for agriculture |NBL-S-PH
 Wind Speed sensor Output Modbus/RS485/Analog/0-5V/4-20mA
 Tipping bucket rain gauge for weather monitoring auto rainfall sensor RS485/Outdoor/stainless steel
 Pyranometer Solar Radiation Sensor 4-20mA/RS485


Screenshot, WhatsApp to identify the QR code
WhatsApp number:+8615367865107
(Click on WhatsApp to copy and add friends)

