





— Blogs —
—Products—
 Consumer hotline +8618073152920
WhatsApp:+8615367865107
Address:Room 102, District D, Houhu Industrial Park, Yuelu District, Changsha City, Hunan Province, China
Product knowledge
Time:2026-02-17 10:40:35 Popularity:730
Quick Answer: Negative oxygen ion monitoring in scenic areas provides location-specific environmental observations. Its practical value depends on representative station placement, comparable measurements and a display that identifies when and where each reading was collected. An ion concentration alone does not establish clean air, medical benefit or visitor safety. Design the ion channel alongside the weather and pollutant measurements needed for the park's actual management tasks.
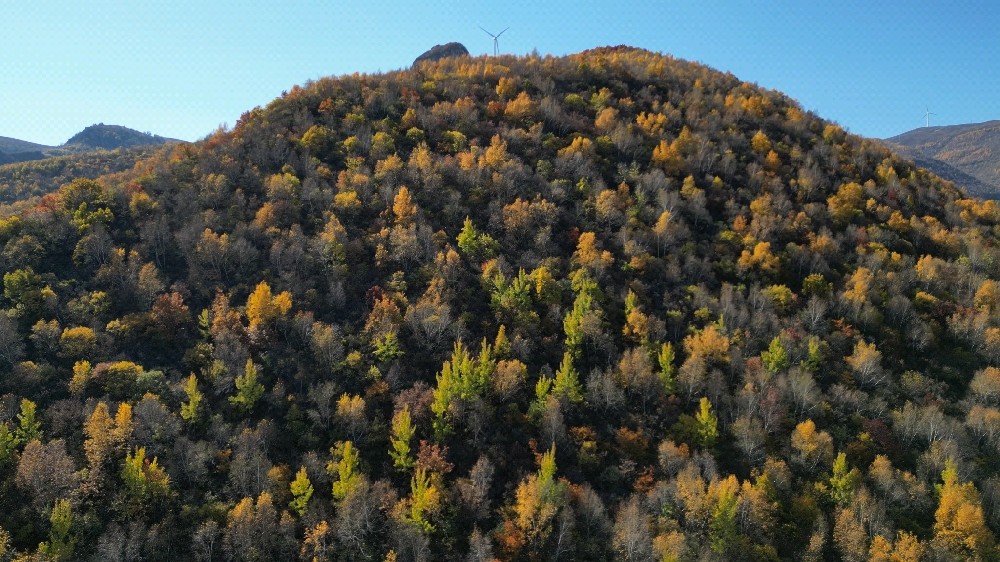
A forest park may want an entrance display, a research team may need seasonal records, and a facilities contractor may need several stations connected to an existing control room. These are different deliverables. A display can work while the underlying observations are poorly located; a sound monitoring point can collect useful data without requiring a large screen. Decide which result the project owner needs before selecting the hardware.
For negative oxygen ion monitoring in scenic areas, a useful operating question is whether conditions differ between a wooded trail, a visitor entrance and a waterside location under comparable weather. Keep the point identities separate. A reading beside a waterfall should not silently become a number describing every visitor route, and a seasonal comparison should not mix stations that were moved between sites.
Negative air ion counters measure a population of charged airborne species within their instrument response, rather than performing a chemical assay of every oxygen-containing ion. The name "negative oxygen ion" is widely used for these installations, but the selection still needs a defined polarity, mobility response, concentration range and measurement method. Two counters with different responses need not give interchangeable readings at the same location.
Map the zones the owner wants to describe. Include terrain, tree cover, water spray, nearby roads, power and maintenance access. A representative forest observation and a deliberately spray-influenced observation can both be useful, provided their purposes are explicit. They should not be ranked as if only vegetation differed. Maintenance staff must be able to reach the instrument without introducing an unacceptable access risk.
Inspect the sampling inlet position in relation to walls, foliage, shelters and exhaust outlets. An attractive mounting location on an entrance structure may restrict airflow or place the sensor beside traffic. Keep the counter's sampling path open as required for its particular construction. A protective cabinet for electronics must not enclose the air inlet in stagnant cabinet air.
For forest park monitoring, record inlet height, nearby obstructions, photographs and the distance to unusual local influences. Retain that description when reviewing later trends. If a footpath is widened, a fountain is added or the sensor is relocated, mark the change in the observation record. Otherwise a change caused by the site can be mistaken for a regional environmental trend.
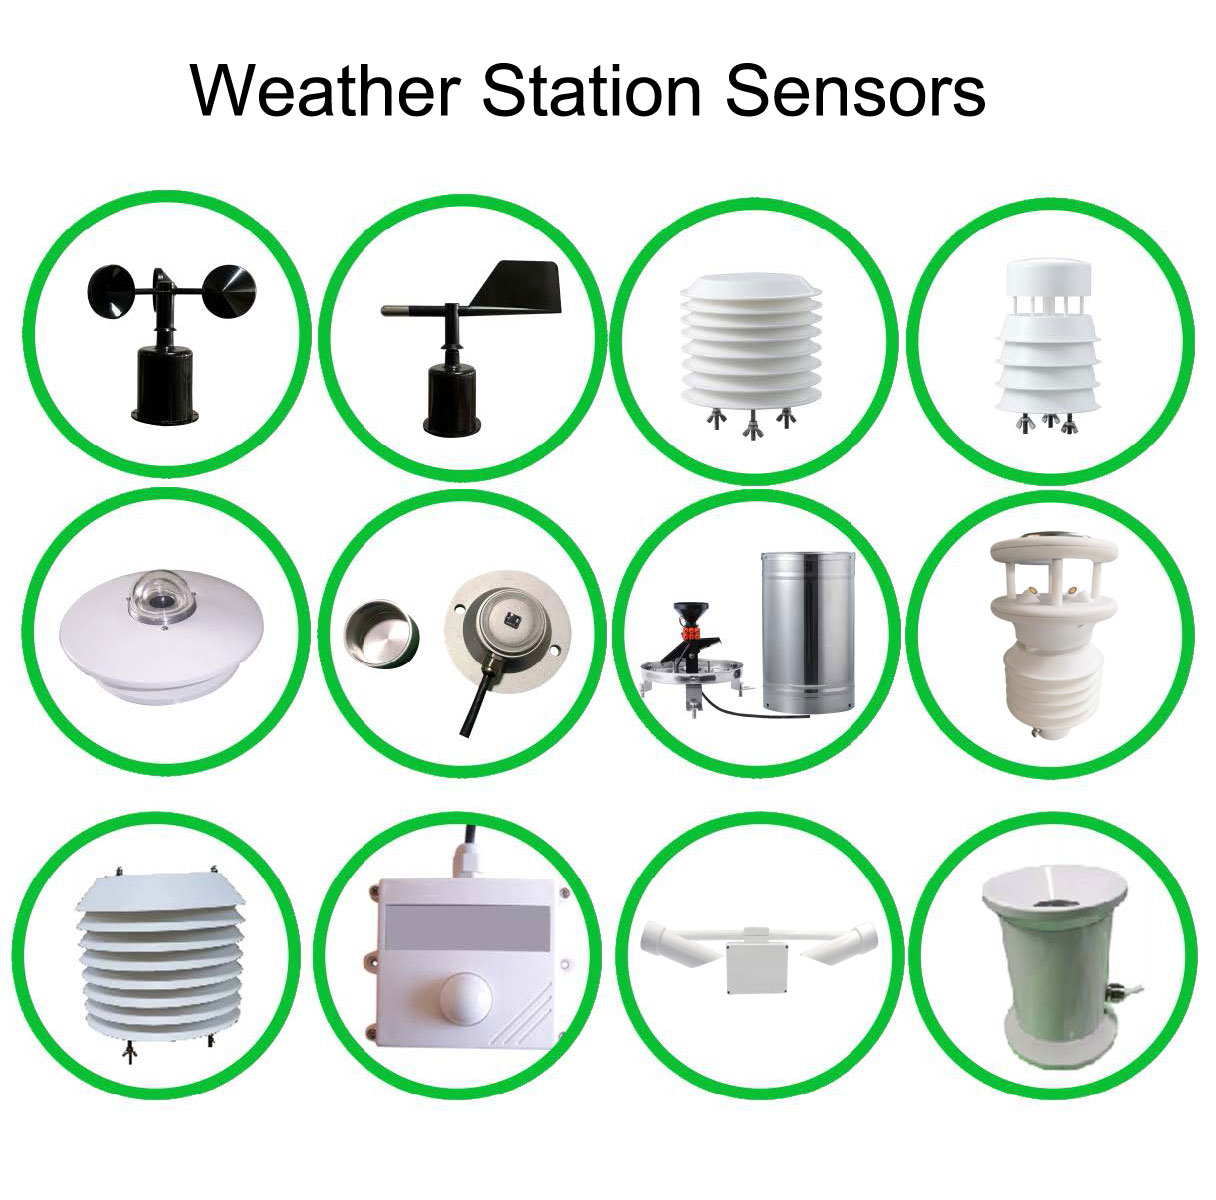
The ion counter is one instrument at the field layer. A data logger collects its readings and the selected companion channels; a communications device transfers records; server software stores them; a display application presents the approved fields. Specify who supplies each part. A sensor with a serial output does not itself provide cellular service, a database or a public display publishing interface.
Temperature and relative humidity help describe the measurement environment. PM2.5 and PM10 address airborne particles, while wind helps explain local exposure and transport. Noise monitoring addresses a different management issue again. Do not convert these channels into a single "excellent environment" score unless the project has adopted a defined calculation with a stated purpose and applicable criteria.
| Channel or component | Measurement or interface | Scenic-site design consequence |
|---|---|---|
| Negative air ion counter | Concentration in ions/cm3; range, mobility response and uncertainty depend on the selected counter | Specify the instrument response before comparing sites or purchasing replacements |
| NBL-W-LBTH temperature | -40 to +80 degrees C; accuracy +/-0.5 degrees C; resolution 0.1 degrees C | Provide suitable exposure and radiation shielding for ambient air observations |
| NBL-W-LBTH relative humidity | 0-100% RH; accuracy +/-5% RH; resolution 0.1% RH | Log humidity separately; a numerical range is not a guarantee of condensation immunity |
| NBL-W-LBTH pressure | 10-1200 hPa; accuracy +/-1.5 hPa; resolution 0.1 hPa | Identify station pressure and any separate altitude correction in displayed data |
| NBL-W-LBTH electrical supply | DC 12-24 V; RS485 or 4-20 mA output configuration | Select the ordered output and verify the collector input, rather than assuming both outputs |
| Logger, communications and screen | Project-selected interfaces, storage and power ratings | Size the complete installation; a low-power sensor rating excludes the screen and modem |
The optional weather channels above are separate NiuBoL instruments, not specifications for the ion counter. The enclosure, connectors and inlet arrangement also require separate outdoor suitability checks. Ask for cable jacket material and UV suitability on exposed cable runs; a cable length or waterproof connector does not establish either property.
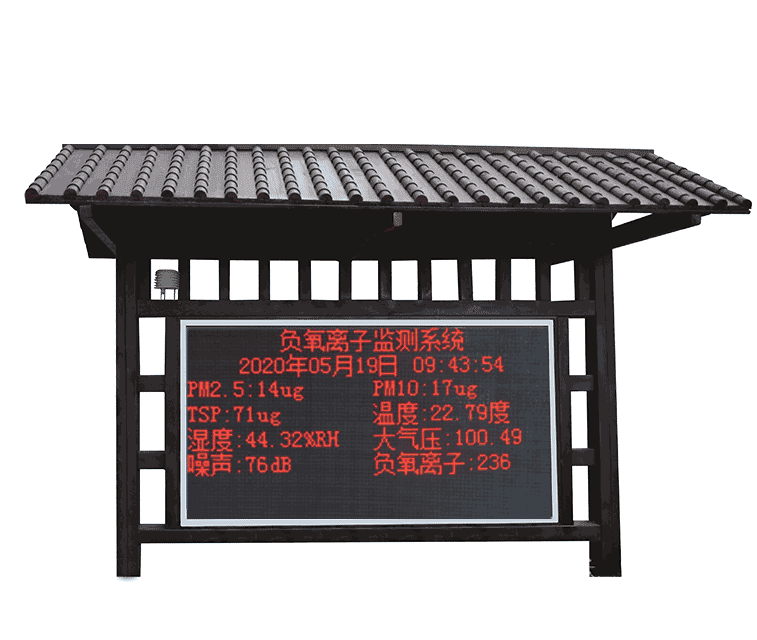
A negative ion public display should show the observation location, measurement unit and acquisition time. Distinguish an instantaneous value from an average. If the screen refreshes every minute while the data logger averages a longer interval, label the averaging period; otherwise a smoothly changing display can be misread as a series of instantaneous observations.
Define how the display handles stale or invalid records. After a communications outage, it should identify the unavailable channel or show the last valid time, rather than continuously presenting an old number as live. Keep a maintenance flag for cleaning and comparison tests. A value measured during servicing should not enter a public daily maximum simply because the packet was received successfully.
Do not attach disease-prevention statements, a supposed universal health threshold or a WHO endorsement to the ion count without a relevant authoritative basis. Nor does a high count prove that particulate pollution or a particular gas is low. The screen can present measured environmental conditions without making claims the instruments do not test.
For an RS485 Modbus RTU configuration, establish the device address, baud rate, parity, register layout and numerical scaling for each sensor. RS485 defines the electrical connection; Modbus RTU defines the message exchange. Neither identifies which register contains ion concentration or whether its value is an integer or floating-point number. Test decoding with one instrument before connecting the complete station bus.
Some environmental sensors use vendor-specific configuration commands alongside normal acquisition messages. Keep address changes and calibration writes out of the routine polling sequence. Provide only one active master for a shared Modbus RTU segment, or use an engineered arrangement that prevents competing requests. Polling intervals should suit the slowest instrument and the required observation interval.
Cellular, Ethernet and Wi-Fi are backhaul choices, not automatic properties of the ion sensor. Verify the regional mobile network, SIM service and installed antenna location. Trees and terrain can make the signal at the station different from the signal at the visitor center. Store acquisition time separately from upload time so a delayed packet does not become a new environmental event on the dashboard.
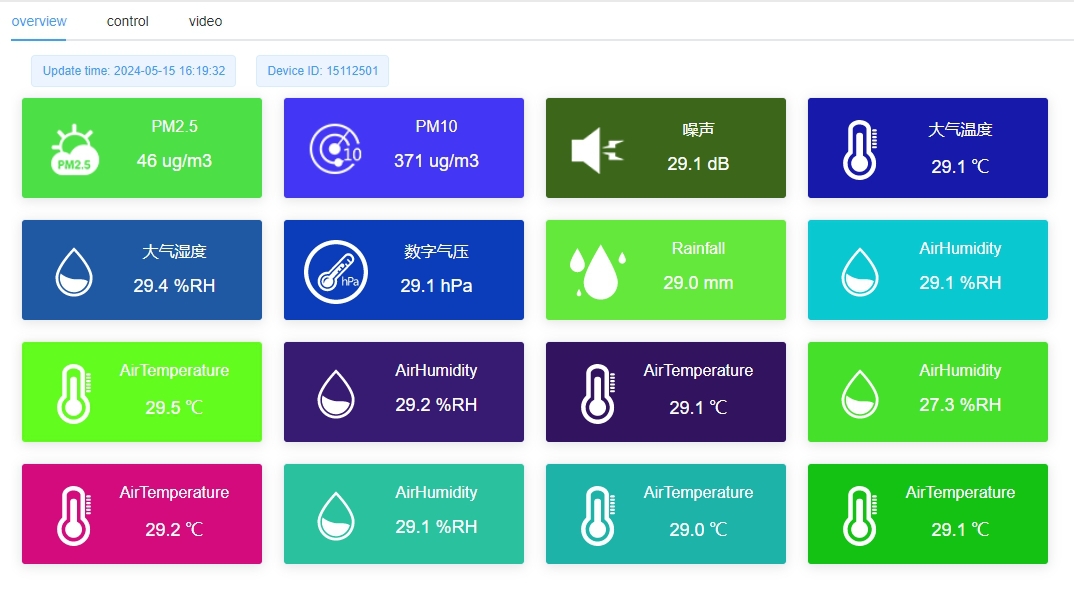
The screen needs convenient power and visibility, while the observation point needs suitable exposure. Separate the two locations if necessary. Connect the screen to the approved station records and name the source location. Traffic-related particle data should remain visible as a separate channel rather than being obscured by an attractive ion reading.
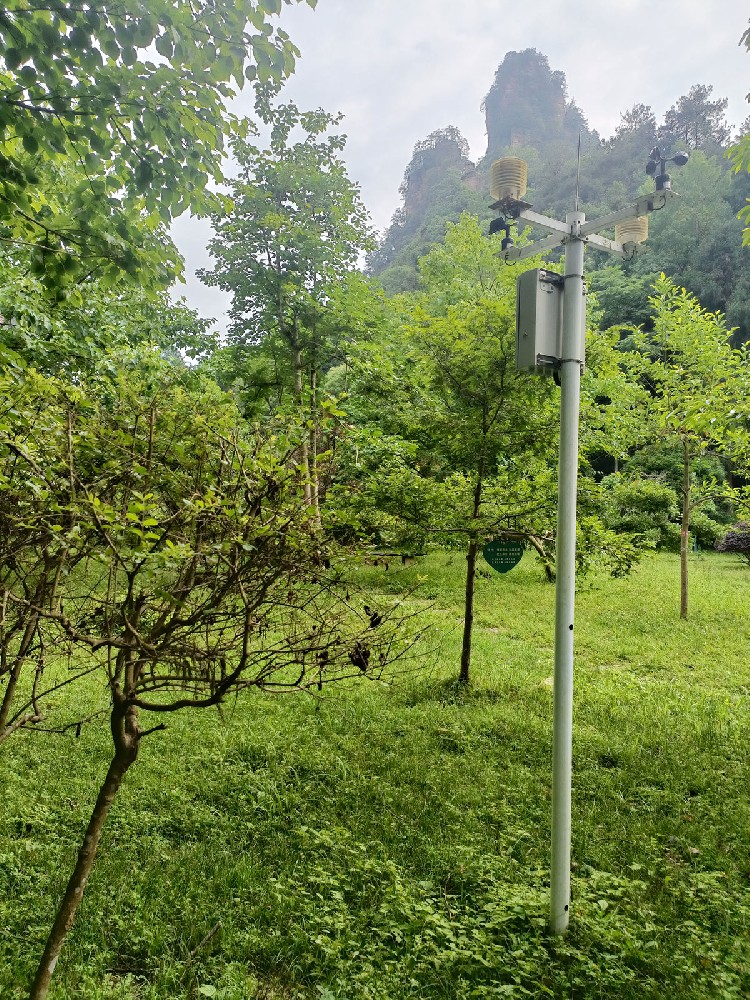
Here the challenge is comparison over time and between habitats. Use a consistent observation method, describe each inlet position and align timestamps with weather measurements. Compare instruments side by side before interpreting differences between distant stations. Keep maintenance access and seasonal vegetation growth in the layout; a branch that later blocks an inlet can change the record.
Spray exposure can distinguish this location from an open clearing, but also increases the risk of wet sampling surfaces and electrical faults. Select an installation suitable for the counter's humidity and condensation limits. Retain flags for heavy spray or servicing. Do not present the resulting values as proof that a nearby dry trail has the same conditions.
For remote sites, calculate power for the complete station, including sampling airflow where applicable, logger, modem, heaters if fitted and battery losses. The display may require its own supply. Shaded forest conditions can limit solar production, so check seasonal exposure at the proposed panel position rather than estimating autonomy from a sensor's nominal consumption alone.
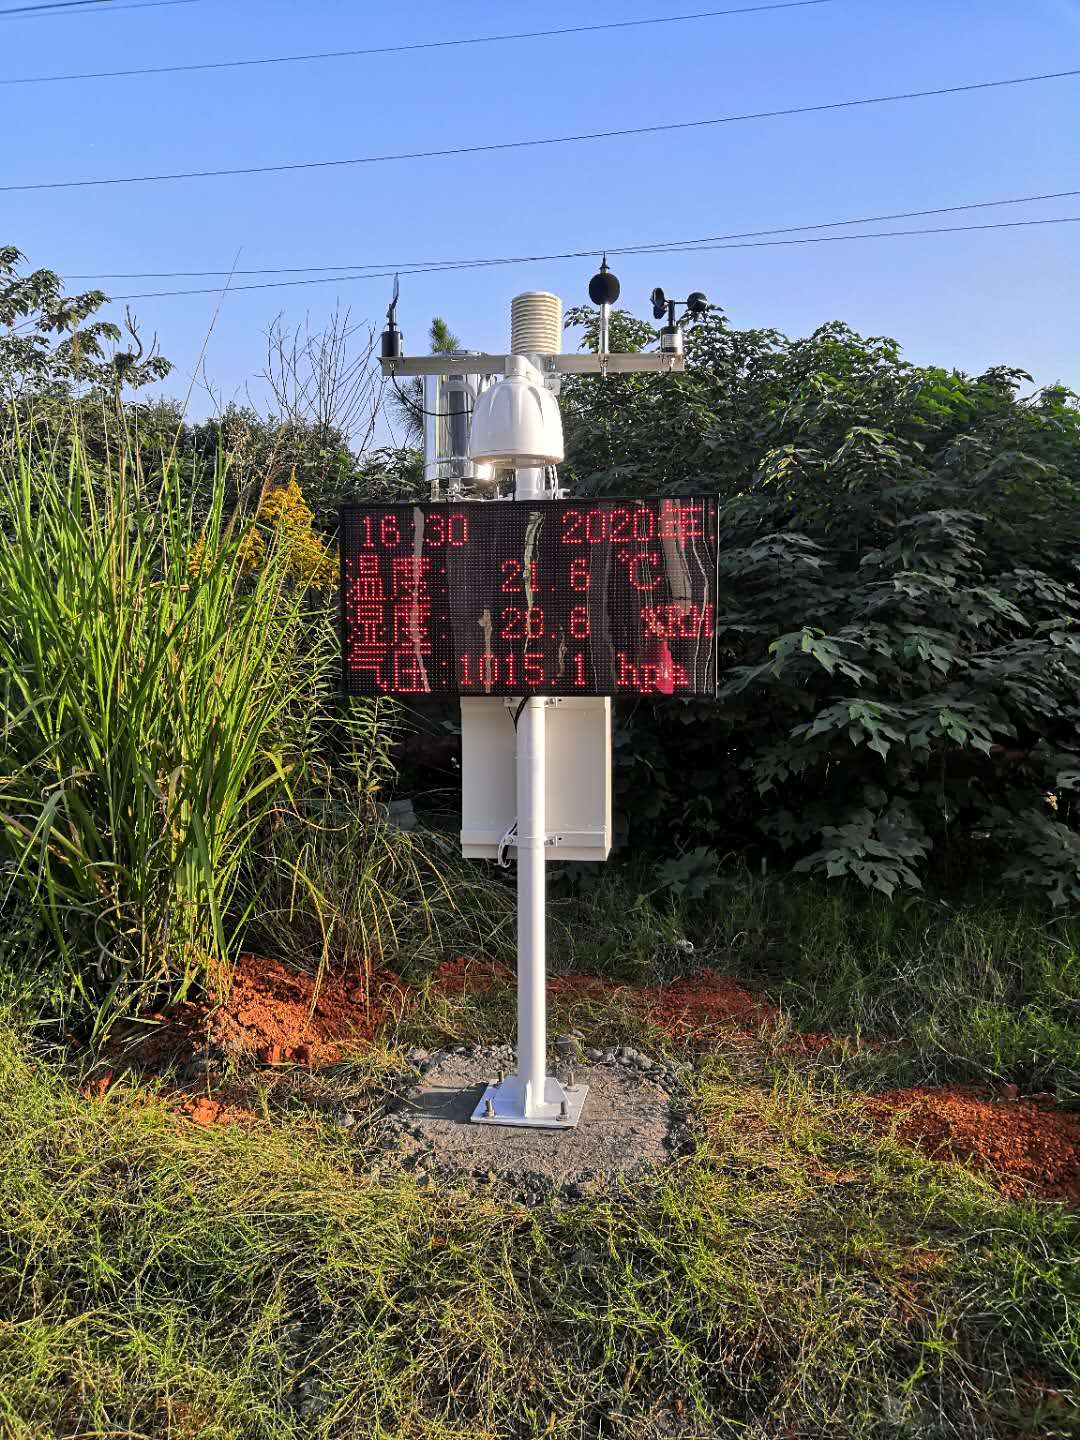
Start with instrument identity and concentration units. Check the counter's specified range, mobility response, operating conditions and comparison method. Then compare instruments under the same exposure long enough to observe stable behavior. Agreement in one short reading is not a calibration, and disagreement between unlike counters should not immediately be treated as a faulty unit.
Test the actual information path. Disconnect communications and check the screen's stale-data behavior; restore the link and inspect timestamps. Place a channel into maintenance mode and confirm that it is excluded from published summaries. Verify that the exported file contains the same locations, units and averaging intervals as the display. These checks detect errors that a successful serial connection alone cannot reveal.
For a NiuBoL station proposal, provide a site map, observation purpose, existing display interface, channel list and power conditions. Ask for the exact ion-counter specification and a separate list of logger, communications, enclosure and display equipment. This gives the contractor a basis for comparing quotations without treating every screen size, reporting function or service visit as included by default.
Not on its own. It does not measure all pollutants used in an air-quality index. Display ion concentration as its own observation and use the applicable pollutant measurements and calculation for any separately reported air-quality index.
No. It is appropriate when the purpose is to observe that waterside environment. For a general trail or entrance observation, select exposure representative of that location. Mixing these purposes makes site comparisons difficult to interpret.
Possibly, after checking the screen controller's input or publishing interface. A Modbus sensor connection to a logger does not establish screen compatibility. Test the required fields, timestamps, invalid states and character display with the actual controller.
No. That range belongs to the humidity measurement. The counter has its own operating and condensation limits, and its air path may need protection against direct spray. Select the inlet arrangement and housing for the intended exposure.
First compare instrument response, averaging interval and exposure. Then perform a side-by-side comparison and inspect inlets, airflow and maintenance history. Do not apply a correction merely to make separate forest and waterside locations show equal numbers.
The counter specification, number of locations, companion channels, display arrangement, power system and integration work all matter. Request an itemized quote with installation and software responsibilities identified; a sensor-only price cannot describe a multi-site public display project.
Only the separately designed and validated alarm functions should be used for those tasks. Ion concentration is not a direct fire detector. Wind, rain or other channels need their own site-specific warning logic, communication checks and responsible operating procedure.
A useful scenic area monitoring system connects a clearly described observation point to correctly labeled records and a dependable display. Keep negative ion measurements distinct from pollutant indices and health claims. For new construction or an existing park upgrade, select the station location and information interface first, then match the counter, companion sensors and installation hardware to that purpose.
Prev:Agricultural Environment Monitoring System for Smart Farming
Next:Dust and Noise Monitoring System: Selection Guide for Construction Sites
Related recommendations
Sensors & Weather Stations Catalog
 Agriculture Sensors and Weather Stations Catalog-NiuBoL.pdf
Weather Stations Catalog-NiuBoL.pdf
Agriculture Sensors Catalog-NiuBoL.pdf
Water Quality Sensor Catalog-NiuBoL.pdf
Related products
 Combined air temperature and relative humidity sensor
 TDR Soil Moisture & Temperature Sensor for irrigation| RS485 |4-20mA| NBL-S-THR
 Soil pH sensor RS485 soil Testing instrument soil ph meter for agriculture |NBL-S-PH
 Wind Speed sensor Output Modbus/RS485/Analog/0-5V/4-20mA
 Tipping bucket rain gauge for weather monitoring auto rainfall sensor RS485/Outdoor/stainless steel
 Pyranometer Solar Radiation Sensor 4-20mA/RS485


Screenshot, WhatsApp to identify the QR code
WhatsApp number:+8615367865107
(Click on WhatsApp to copy and add friends)

