





— Blogs —
—Products—
 Consumer hotline +8618073152920
WhatsApp:+8615367865107
Address:Room 102, District D, Houhu Industrial Park, Yuelu District, Changsha City, Hunan Province, China
Product knowledge
Time:2026-02-17 10:31:31 Popularity:702
Quick Answer: An agricultural environment monitoring system combines weather, soil and other field observations in a shared operating view. Integration requires more than connecting devices to a dashboard: each record needs a location, a measurement time, units and a validity state. Keep weather measurements, insect counts and video observations distinct so that a farm team can investigate the same event without confusing unlike data.
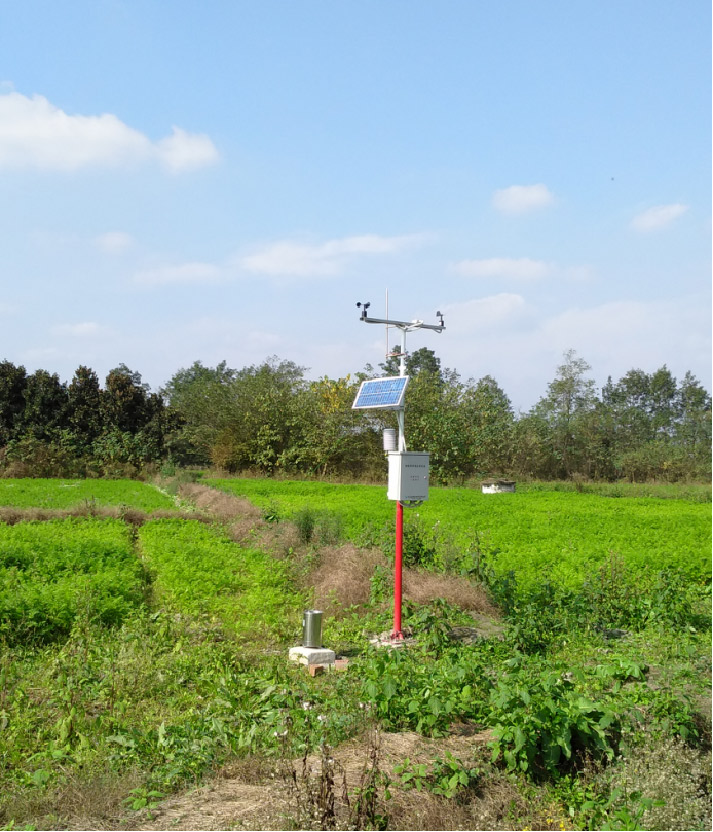
A field project may combine a microclimate weather station, root-zone probes, an insect monitoring instrument and cameras. The equipment does not observe the same area or produce the same kind of information. Wind describes conditions around an exposed instrument. A buried probe represents a small volume of soil. An insect count belongs to a trap and observation period, while a camera shows a particular view.
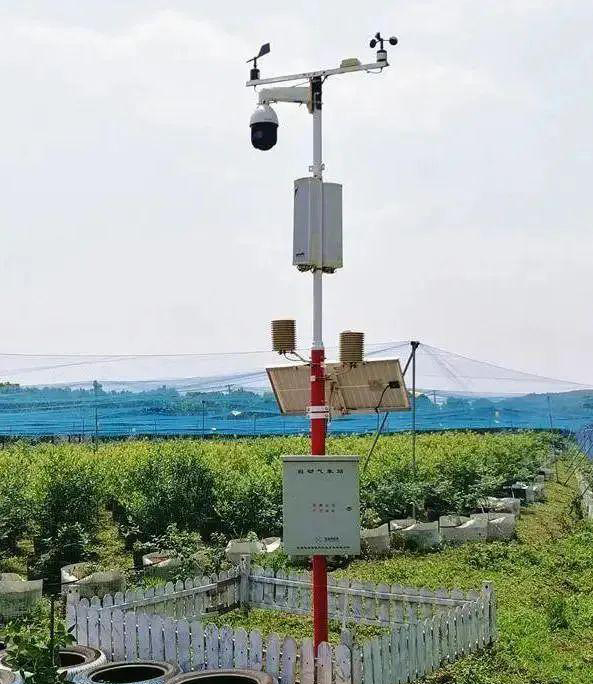
The NiuBoL agricultural environment monitoring system can be assembled around these different functions. Its architecture should make the differences visible rather than merge everything into an unexplained farm score. A grower investigating a dry block needs to know which probe was measured, whether irrigation operated and whether the weather record covers that block's conditions.
A useful project drawing therefore shows measurement locations and data routes, not only equipment icons. Give every station, soil depth, irrigation zone and camera view a stable identity. If a probe is moved to another bed, its new location must not silently continue the old location's trend. An equipment serial number and a field-point name have related but different purposes.
The microclimate station supplies atmospheric observations. Soil sensors describe local water and temperature conditions; conductivity adds information about the conducting medium. Pest monitoring and video add inspection information. Software may combine those records with a crop model or forecast, but the model is an additional function with its own inputs and operating assumptions.
For example, an increase in trap captures may justify a crop inspection. It does not establish that an economic treatment threshold has been crossed. A wet leaf sensor does not diagnose infection, and a rain gauge does not identify how much water reached the root zone. Define which conclusions the software is allowed to produce and what the operator should check next.
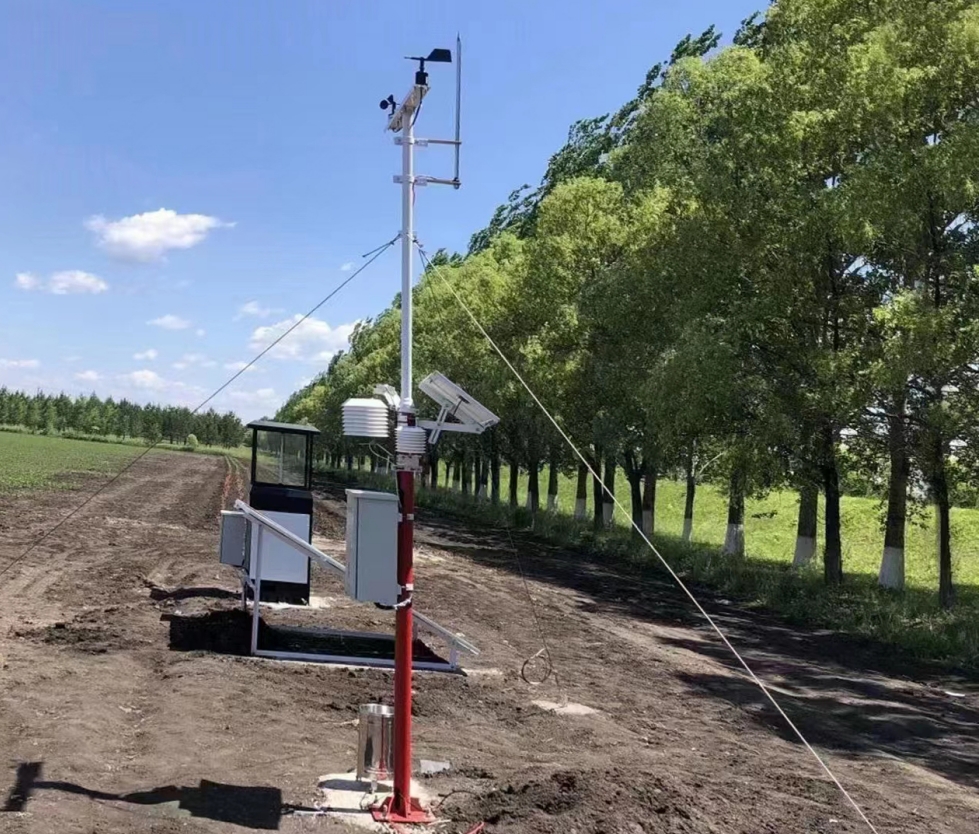
RS485 Modbus RTU is a field acquisition option for compatible instruments. It specifies neither cellular coverage nor a cloud service. A logger reads the supported register map, applies channel scaling and creates records. Ethernet or cellular communication then carries those records to the receiving system. A wireless soil node may need its own receiver rather than sharing the wired sensor bus.
Cameras normally create a separate network and power demand. Do not assume that a logger with serial sensor acquisition can also carry continuous video. Decide whether the project needs live video, occasional still images or access only during inspection. These choices change modem traffic, storage and solar power requirements substantially.
| Equipment stream | Information to retain | Common integration mistake |
|---|---|---|
| Weather station | Point identity, sample or averaging interval, units and exposure | Treating one latest value as the average for an entire day or farm. |
| Soil probe | Zone, depth, soil or substrate, parameter and reading time | Combining different depths into one undifferentiated moisture trend. |
| Insect monitoring | Trap identity, collection window, count method and inspection status | Reporting captures as a direct measurement of field infestation or disease. |
| Camera | View location, capture time and availability of the image | Using upload time as if it were the time shown in the picture. |
| Irrigation controller | Requested action, actual state, flow or pressure feedback where installed | Assuming that an accepted command proves water was delivered. |
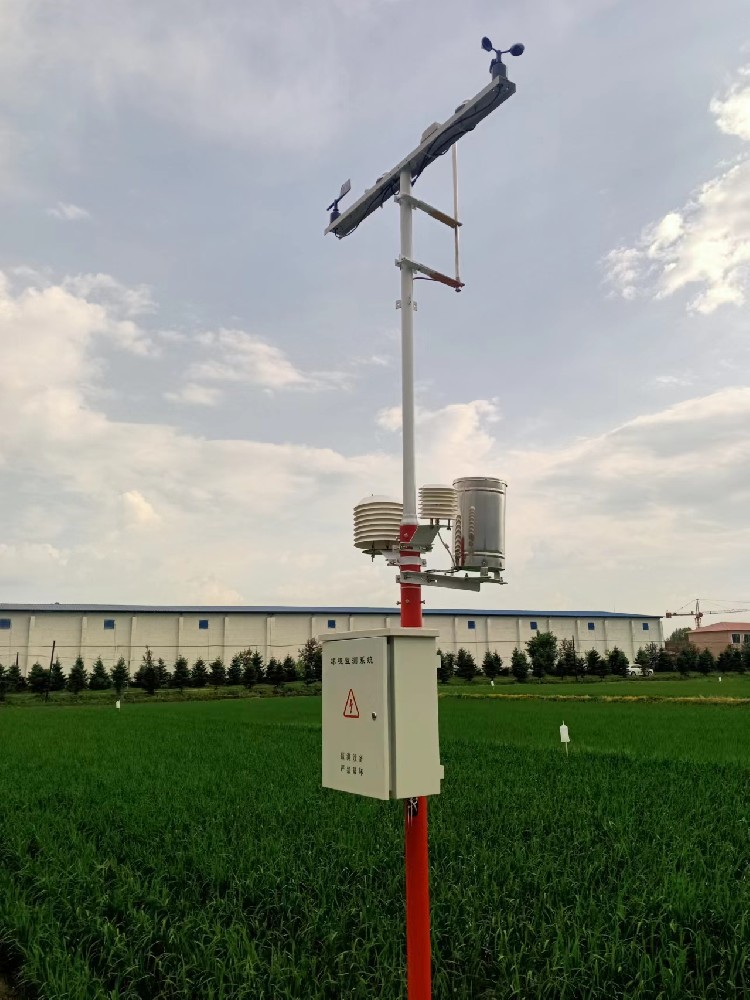
Map these streams before buying the gateway. A project can use more than one acquisition device and still present one farm view. Conversely, putting every connection through one box can create a single point of failure or exceed the available inputs. The choice should follow the actual equipment and required functions.
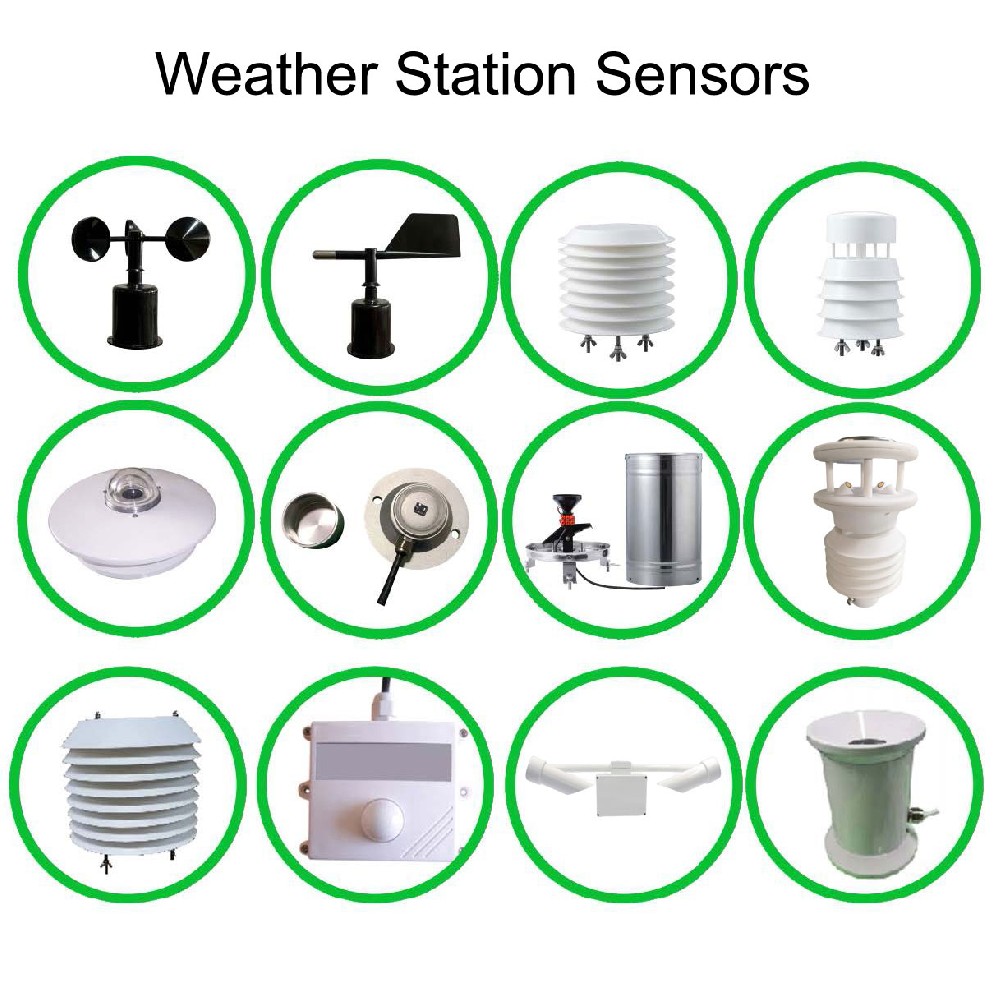
The TG462 / TG462S weather station data logger is one available acquisition option, not a compulsory component of every NiuBoL station. Its serial ports, analog inputs and networking functions make it relevant when several types of field equipment must be collected. The following specifications apply to that logger family rather than to the complete farm installation.
| Item | TG462 / TG462S specification | Design consequence |
|---|---|---|
| Serial inputs | 3 RS485 ports; 4 RS232 ports including one debug port | Allocate usable ports and test each instrument's actual protocol. |
| Analog acquisition | 8 channels, 12-bit ADC; 4-20 mA or 0-5 V according to configuration | Confirm current or voltage mode. ADC resolution is not total measurement accuracy. |
| Digital and relay I/O | 4 digital inputs; 4 relay outputs | Verify signal conditioning and load requirements. A DI count does not establish pulse-counting performance. |
| Power input | 5-35 VDC; standard supply 12 V / 1.5 A | Size the source for the logger and any separately powered instruments. |
| Communication current | Approximately 305-412 mA at 12 VDC | Use the operating schedule, not a bare modem sleep figure, for the energy budget. |
| Environmental limits | IP30; -35 to 75 degrees C; non-condensing humidity limits apply | Install inside an appropriate outdoor cabinet rather than expose the logger directly. |
| Storage hardware | Micro SD support up to 32 GB; internal flash depends on version | Storage capacity alone does not establish outage recovery or retention behavior. |
The logger's IP30 rating is a useful reminder that outdoor sensors, electronics and the complete cabinet need separate assessments. A sealed soil probe does not make the logger waterproof. Cable glands, ventilation, condensation management, protective devices and installation workmanship determine how the assembled station handles its environment.
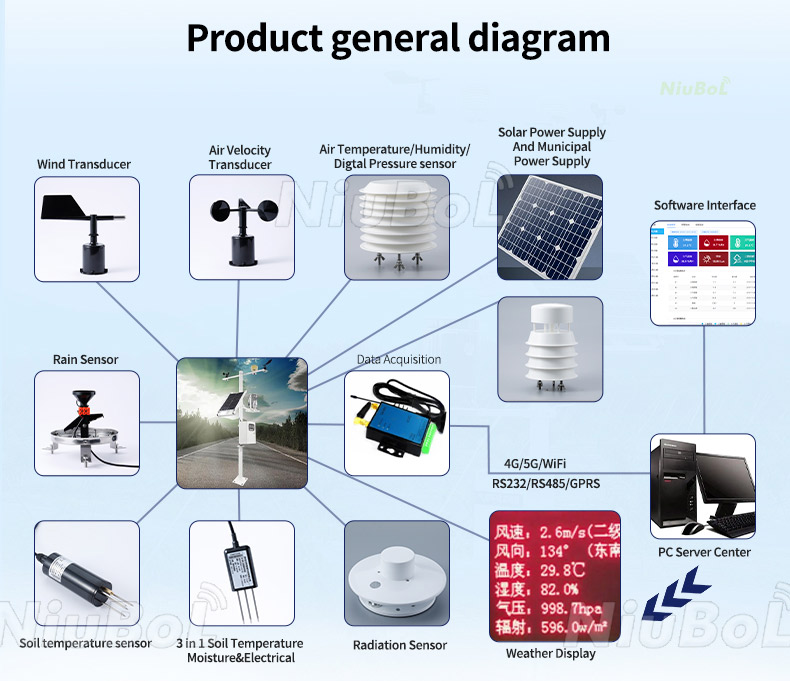
For agricultural data integration, distinguish the time an observation was made from the time it reached the server. A delayed soil record can still be useful history. It becomes misleading when the receiving platform labels it as current and allows it to trigger an immediate irrigation decision.
Define acquisition and reporting intervals independently. Weather may be sampled frequently and summarized for transmission. A camera may upload only on request. Trap records may cover a collection window. The server needs those interval meanings, not merely a common timestamp field attached to different data types.
A practical offline recovery test uses a known record schedule. As an illustrative acceptance test, disconnect the backhaul for 20 complete recording intervals while local acquisition continues. Reconnect and reconcile the 20 expected interval records against their original measurement times, allowing for a deliberately chosen boundary convention. Look for missing rows, duplicate retries and changed order. This is a test requirement, not a claim that storage hardware automatically provides the behavior.
Power interruption needs a separate test. A buffer that survives a network outage may not survive a restart. Check clock recovery, retained counters and queued records, then verify that a replayed command cannot unexpectedly operate equipment. If the installation only needs advisory monitoring, do not add actuator control simply because relay terminals exist.
Calculate daily energy by operating mode. Include active sensors, logger acquisition, transmission periods and any heaters, insect equipment or camera. At 12 V and 412 mA, the example logger communication input is about 4.94 W. If a designer conservatively assumed that load continuously for a day, it would be about 118.7 Wh before other devices and system losses. Actual duty-cycle measurements may justify a different value.
Neither battery ampere-hours nor panel wattage alone establishes days of autonomy. State battery voltage, usable capacity, temperature allowance, expected charging conditions and load schedule. A camera added late in the project can invalidate an earlier solar calculation even when the sensor count has not changed.
Investigate the site's weak charging period, not just a sunny demonstration day. Check how the selected system behaves near its low-voltage limit: which loads are reduced, which measurements continue, and whether the operator sees the condition. Do not advertise a universal number of rainy days without a complete load and charging assessment.
An agricultural IoT gateway can expose data through supported MQTT, TCP/UDP or Modbus gateway functions, depending on equipment and software configuration. That does not make every receiving platform automatically compatible. Provide the actual server endpoint, authentication method, required fields, units and retry rules for an integration test.
For soil moisture networking, confirm the supported probe version, address list and power arrangement. For pest and video equipment, identify the separate interfaces and who maintains classification or inspection functions. For a farm monitoring dashboard, agree how missing readings, delayed records and equipment faults are displayed before commissioning.
System acceptance should follow one useful farm investigation from start to finish. Can the operator identify the affected block, inspect the relevant soil depth, compare the right weather period and view an image captured at the appropriate time? If any link is ambiguous, a successful gateway connection has not completed the application.
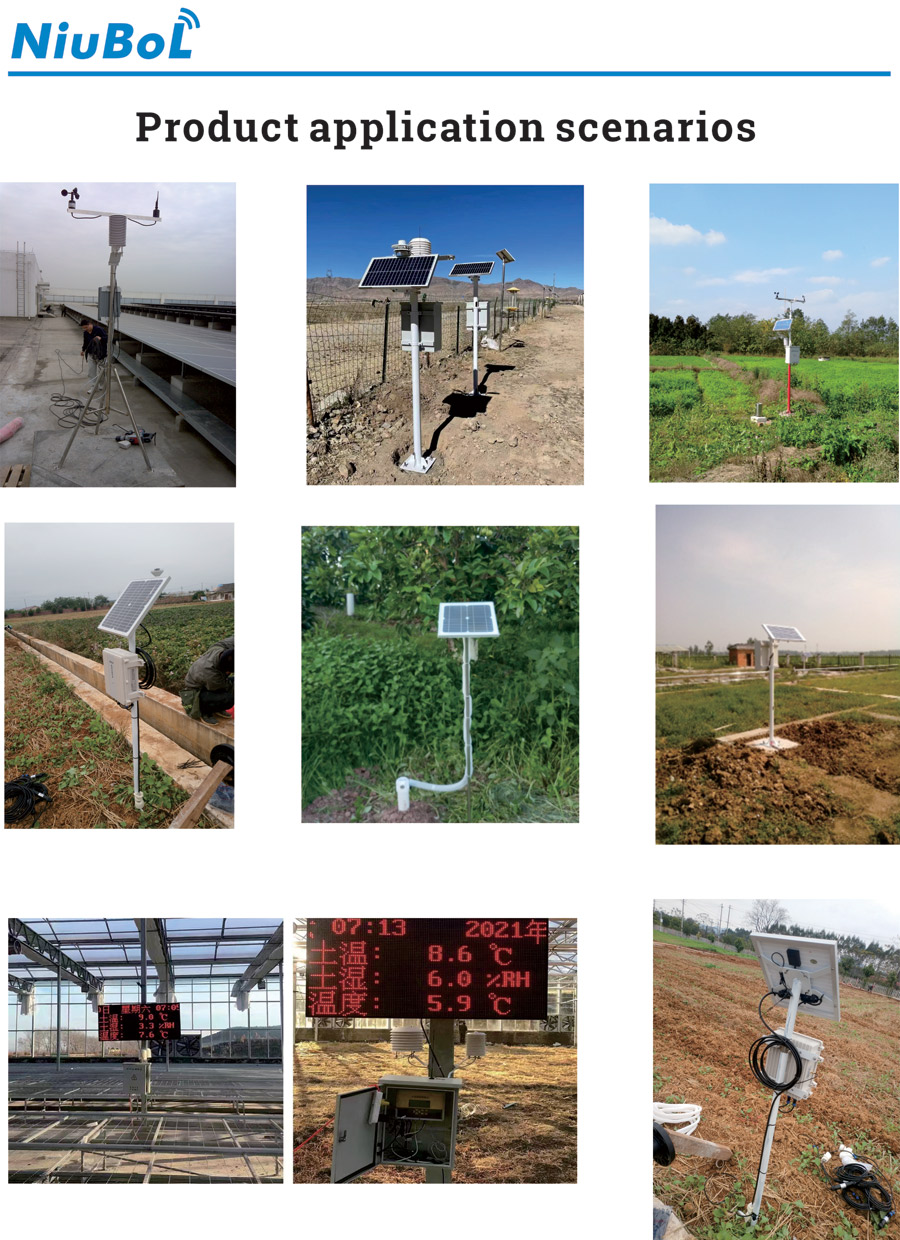
For a configuration enquiry, provide the site map, existing instruments, required streams and intended decisions. NiuBoL can propose station and sensor components around that scope. Keep software integration, field installation, agronomic interpretation and ongoing service as separately identified responsibilities so that a quotation can be checked against actual work.
No. Atmospheric exposure, crop height, terrain and the required decision determine representativeness. Soil and insect observations have different spatial coverage again. A universal hectares-per-station rule cannot establish an adequate multi-sensor system.
Possibly, after checking electrical settings, protocol, register map and channel scales. Prepare one real sensor for a bench test. Sharing an RS485 interface is not sufficient proof that the gateway can interpret its data.
No. The software must create, retain and replay records with their original times and handle duplicates. Test the agreed outage and restart scenarios. Card capacity establishes storage space, not the complete recovery function.
Only if its energy and peak-load design includes those devices and their schedules. Obtain operating and standby loads, night-use requirements and seasonal charging conditions before specifying panel and battery capacity.
No. Trap observations need interpretation, crop inspection and the applicable operating rules. Any authorized control interface is a separate project function; it should not be inferred from having a connected trap or an available API.
Compare the same measurement points, recording behavior, interfaces, power loads and software obligations. Include installation and service tasks. A list of devices without data integration and acceptance details does not describe the same delivered system.
An agricultural environment monitoring system is useful when different observations can be traced to the right place and period. Design the field interfaces, data meanings, power demand and recovery behavior together. The result should help an operator investigate a real farm condition, not simply populate more dashboard tiles.
Prev:Greenhouse Condensation Monitoring: Dew Point and Leaf Temperature
Next:Application of Negative Oxygen Ion Monitoring System in Smart Scenic Area Construction
Related recommendations
Sensors & Weather Stations Catalog
 Agriculture Sensors and Weather Stations Catalog-NiuBoL.pdf
Weather Stations Catalog-NiuBoL.pdf
Agriculture Sensors Catalog-NiuBoL.pdf
Water Quality Sensor Catalog-NiuBoL.pdf
Related products
 Combined air temperature and relative humidity sensor
 TDR Soil Moisture & Temperature Sensor for irrigation| RS485 |4-20mA| NBL-S-THR
 Soil pH sensor RS485 soil Testing instrument soil ph meter for agriculture |NBL-S-PH
 Wind Speed sensor Output Modbus/RS485/Analog/0-5V/4-20mA
 Tipping bucket rain gauge for weather monitoring auto rainfall sensor RS485/Outdoor/stainless steel
 Pyranometer Solar Radiation Sensor 4-20mA/RS485


Screenshot, WhatsApp to identify the QR code
WhatsApp number:+8615367865107
(Click on WhatsApp to copy and add friends)

