







Four soil moisture readings can all fall without proving that irrigation is due. The useful question is how much water the active root zone has lost relative to its own soil and crop limits. That requires more than averaging the percentages on a dashboard.
Soil moisture monitoring can support a millimetre water balance when each reading represents a defined soil interval. Keep total water storage, water above wilting point and the remaining depletion allowance separate. They are different quantities, even though all can be expressed in mm.
Define the soil intervals before multiplying readings
A sensing point at 20 cm is not automatically the average for the entire 0-20 cm layer. It measures a limited volume around that position. Depth labels identify observations; the boundaries used in a storage calculation are a separate interpretation.
Draw the effective root-zone profile and its soil horizons first. Assign an interval to each reading only where soil conditions and comparison observations support that representation. Midpoints between sensors can be an initial interpolation convention, but they do not prove that the intervening soil is uniform. Record the top and bottom boundaries, and do not extend the deepest reading through an unmeasured root zone by default.
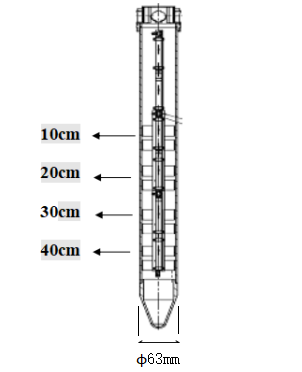
Tubular sensing positions identify measurement depths, not the soil-interval boundaries required by a water balance. This is a sensor component, not a complete irrigation system.
In drip irrigation, also distinguish the wetted root zone from the whole field area. A profile beside an emitter is not necessarily the field-average water depth. Keep the chosen area basis consistent with any irrigation application depth used later.
Separate the four water quantities
Volumetric water content, theta, is water volume divided by the associated bulk soil volume. Use a fraction rather than a percentage in the equation. With interval thickness dz in mm, total profile water storage is S = sum(theta × dz).
Field capacity, thetaFC, is a drained soil-water reference, not saturation. Wilting-point content, thetaWP, is a lower reference for conventional plant-available water accounting. Both can differ between horizons. Obtain site-appropriate values and keep their volume basis consistent with the moisture readings.
For a profile between wilting point and field capacity:
- Total available water capacity, TAW = sum((thetaFC - thetaWP) × dz).
- Current water above wilting point, A = sum((theta - thetaWP) × dz).
- Current depletion from field capacity, D = sum((thetaFC - theta) × dz).
- Readily available water allowance, RAW = p × TAW, where p is the selected depletion fraction.
TAW describes capacity, not today's stock. RAW is the permitted drawdown in this accounting framework, not all water currently present. The remaining headroom before that limit is RAW - D. A negative headroom means the selected depletion limit has already been exceeded.
These equations need review when a layer is above field capacity or below wilting point. Do not let excess water in one draining layer conceal a dry layer elsewhere. Water present at depth may also be poorly accessible to the current root system.
One profile calculation, with assumptions visible
This is an illustrative calculation based on assumed site values, not a measured field record. Assume a 600 mm effective root zone, four representative intervals, thetaFC = 0.30 and thetaWP = 0.10 throughout. Those values and the depletion fraction p = 0.35 are invented inputs for this example, not recommendations for a soil texture or crop.
| Assigned soil interval | Thickness dz, mm | Assumed theta, fraction | Total water theta × dz, mm | Depletion from field capacity, mm |
|---|---|---|---|---|
| 0-100 mm | 100 | 0.28 | 28.0 | 2.0 |
| 100-250 mm | 150 | 0.27 | 40.5 | 4.5 |
| 250-400 mm | 150 | 0.26 | 39.0 | 6.0 |
| 400-600 mm | 200 | 0.25 | 50.0 | 10.0 |
| Profile total | 600 | Not an unweighted average | 157.5 | 22.5 |
The formula for the first depletion is (0.30 - 0.28) × 100 = 2 mm. Summing all four rows gives D = 22.5 mm. Field-capacity storage is 0.30 × 600 = 180 mm, and wilting-point storage is 0.10 × 600 = 60 mm. Therefore TAW = 120 mm, A = 157.5 - 60 = 97.5 mm, and A + D = 120 mm closes the available-water balance.
RAW = 0.35 × 120 = 42 mm, leaving 42 - 22.5 = 19.5 mm of depletion headroom. That is neither the total storage of 157.5 mm nor the 97.5 mm above wilting point.
For a deliberately simplified forecast with constant crop evapotranspiration of 4 mm/day, no rain, no irrigation and negligible drainage or upward supply, headroom divided by loss is 19.5 / 4 = 4.875 days. This estimates when the assumed limit would be crossed if nothing changes. It is not a verified instruction to wait five days.
Update the forecast instead of promising a trigger date
Crop evapotranspiration, ETc, depends on weather, crop development and the estimation method. Effective rainfall is the portion contributing to the root-zone balance; a rain-gauge total is not automatically that amount. Drainage, runoff, capillary rise and irrigation can also change the balance.
Reconcile the predicted change with the next valid profile observation. If the difference is persistent, inspect the assumptions rather than adjusting the crop coefficient merely to make the numbers agree. Check whether root depth changed, an interval was misrepresented or the profile is still redistributing after irrigation.
Choose the depletion fraction with crop and site guidance. A universal 35% limit is not established by the example. Allow enough operational lead time for the actual irrigation process rather than treating the estimated threshold-crossing time as the start time for every zone.
Choose a sensor configuration that can support the calculation
The NBL-S-TM-MD multi-layer sensor measures soil moisture, temperature and salinity at configurable depths. Its published specification lists adjustable layer count and spacing, Modbus communication and a 0-100% moisture range. Specify the required depths before ordering; a product family name does not define the intervals in your spreadsheet.
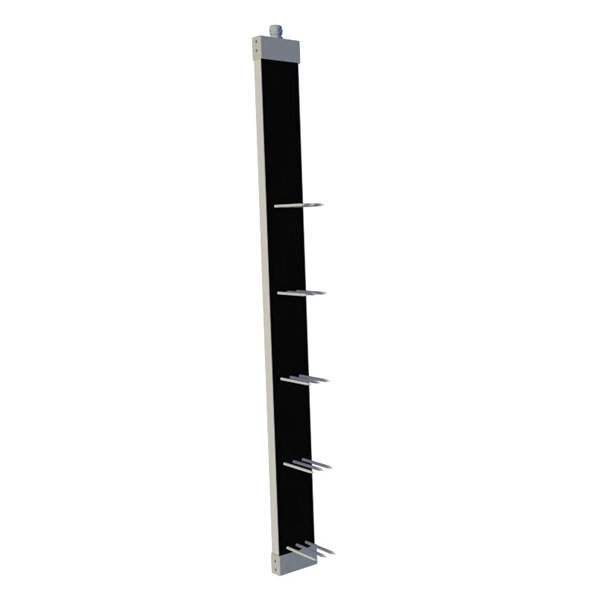
Multi-layer measurement hardware supplies depth-specific observations. Soil boundaries, crop limits and irrigation decisions remain separate project inputs.
Do not confuse display resolution with field confidence. The product page lists moisture accuracy as ±5% without defining the percentage basis in that table. Confirm its interpretation and test conditions before propagating it into an mm uncertainty. Local representativeness and soil-specific calibration also matter.
For stony soil, check whether the reading and soil-water references already describe whole-soil bulk volume or the fine-earth fraction. Applying a blanket stone-volume discount can double-count a correction. Resolve that basis before calculating storage.
A soil water potential sensor adds information about how strongly water is held. Its kPa reading cannot be multiplied by depth to obtain mm; a suitable soil-water retention relationship is needed to connect potential with water content.
Questions about using profile data
Q1. Can I average all depths and multiply by root depth?
Only if equal weighting is justified. Unequal intervals require thickness weighting, and distinct horizons need their own reference values. A numerical average cannot make unrepresentative point readings representative.
Q2. Does 30% volumetric moisture mean 30 mm of water?
No. A percentage needs a defined thickness. Convert the percentage to a fraction and multiply by the represented interval thickness; the result has the same length unit as that thickness.
Q3. Is all water above wilting point available without stress?
No. Crop uptake can become restricted before the wilting-point reference is reached. The selected depletion allowance addresses that earlier limit; root access and salinity still need attention.
Q4. Does a deeper wet sensor justify delaying irrigation?
Not by itself. Confirm that active roots can use that layer and that the observation represents it. A wet deep layer does not cancel a dry, root-dense upper layer automatically.
Q5. What should a useful data export contain?
Keep acquisition time, moisture units and values by depth, quality status, assigned interval boundaries and the version of the soil-reference values. Retain irrigation and rainfall records separately so changes can be investigated.
Q6. What if field capacity and wilting point are unknown?
Use the profile to observe drying and wetting while obtaining appropriate soil references. Do not turn a generic texture table or a plausible-looking curve into a precise automatic irrigation date.
Make the water balance traceable
A useful root-zone balance links every moisture reading to an explicit interval and keeps storage, plant-available capacity, depletion and forecast headroom distinct. Recheck the model against fresh observations before using it to support irrigation timing.
Contact NiuBoL with your crop and root-depth estimate, soil-profile notes and existing logger model or nameplate photo. We can help compare suitable multi-depth sensors, confirm available interfaces and prepare a quotation for the monitoring components.









