





— Blogs —
—Products—
 Consumer hotline +8618073152920
WhatsApp:+8615367865107
Address:Room 102, District D, Houhu Industrial Park, Yuelu District, Changsha City, Hunan Province, China
Product knowledge
Time:2025-11-21 15:04:09 Popularity:843
A weather station for crop disease monitoring supplies environmental observations, not a diagnosis. Air temperature, relative humidity, rainfall and leaf-surface wetness can support a crop-specific risk model, but they do not establish that a pathogen is present. Select instruments from the model's actual input requirements, then keep field scouting and treatment decisions separate from the sensor readings. NiuBoL can configure atmospheric and leaf-surface measurement channels for this purpose.
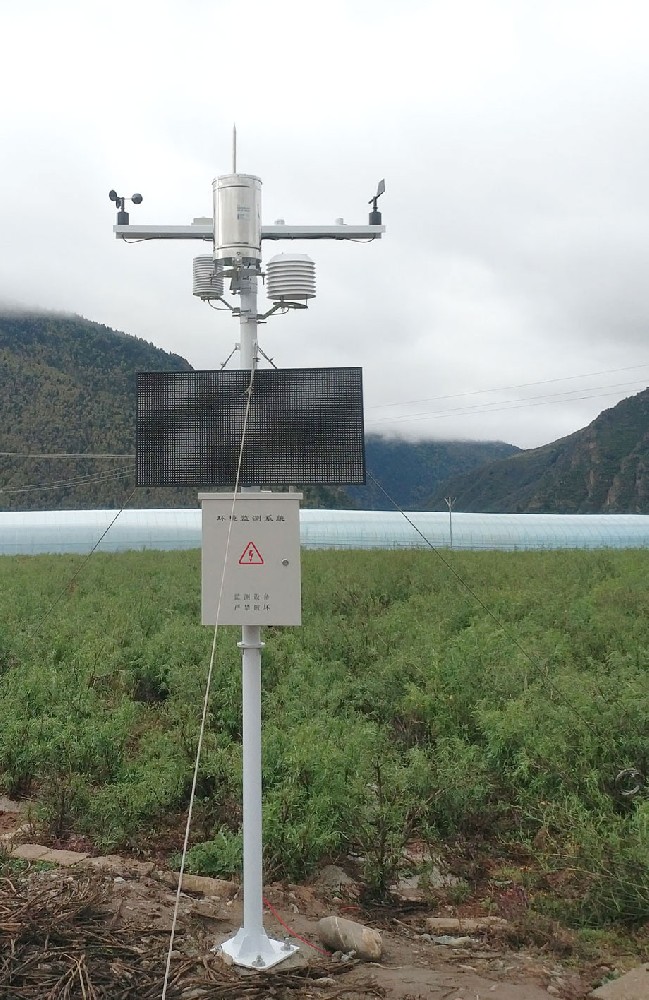
An orchard project investigating prolonged surface wetness has a different requirement from a greenhouse project investigating condensation. Before specifying hardware, identify the crop, disease of concern, growth stage and model or advisory method to be used. Ask which observations it accepts, their units, exposure and recording interval. A general weather dashboard may lack the particular observation needed to calculate the intended risk indicator.
A useful project description might request temperature and wetness records close to a selected canopy position, with rainfall and shielded air humidity as context. That is a measurable equipment task. Promising to predict every pest or prevent crop loss from a standard station is not. Insect occurrence, disease infection and chemical application are different decisions, even when they use some of the same weather observations.
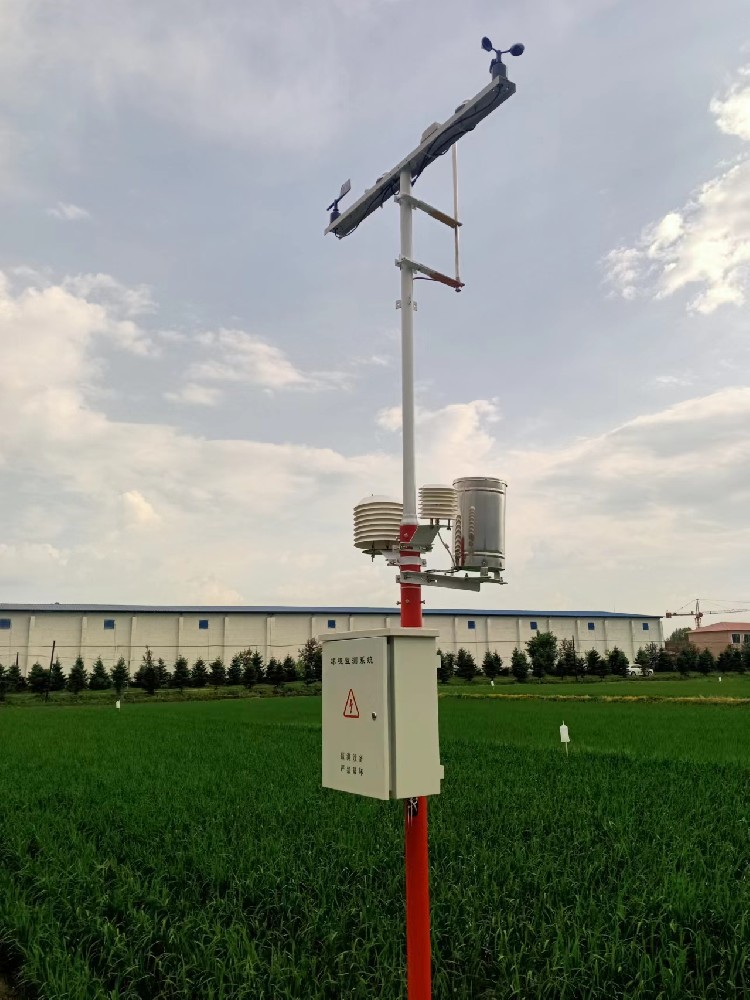
The NBL-W-LBTH measures shielded air temperature, relative humidity and pressure. The NBL-W-LM measures the wetness and temperature of a leaf-like sensing surface. The latter responds to surface water, including dew or rain residue; it does not inspect actual plant tissue for infection. Its displayed percentage is not interchangeable with atmospheric relative humidity.
| Observation | Useful question | Limit |
|---|---|---|
| Shielded air temperature and RH | What atmospheric conditions accompanied the event? | Does not establish whether foliage was wet |
| Leaf-like surface wetness and temperature | When did this exposed surface become wet and dry? | One position does not represent every leaf |
| Rainfall | Was liquid precipitation recorded at the gauge? | No rain does not mean no dew or condensation |
| Wind | What airflow context accompanied wetting or drying? | Does not identify a pathogen or approve spraying |
Pressure can remain a general weather channel, but it should not be added to a disease calculation unless the chosen method requires it. Likewise, soil moisture may matter to crop management without being a substitute for leaf wetness. Keep a named purpose for each channel.
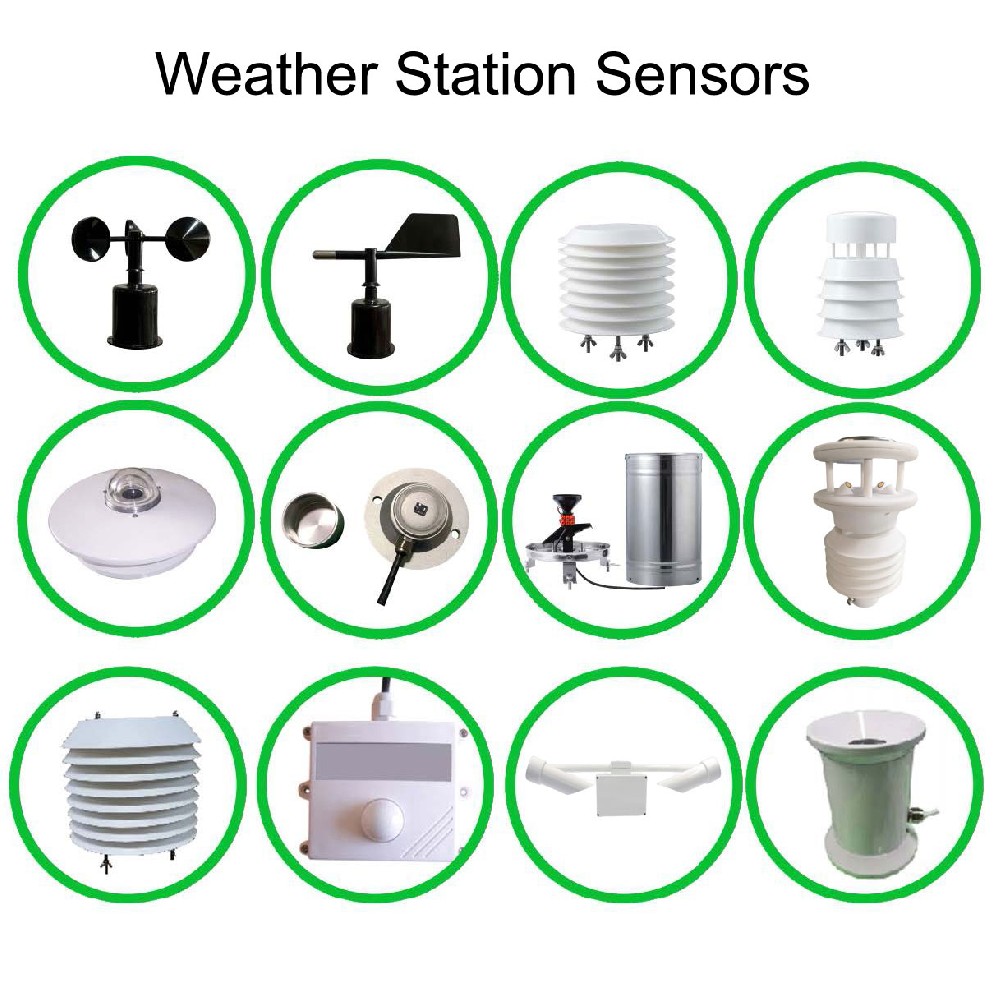
| Instrument | Model-specific specification | Project implication |
|---|---|---|
| NBL-W-LBTH | Air temperature -40 to 80 C, accuracy +/-0.5 C; RH 0-100%, accuracy +/-5% RH | Use air measurements with their stated uncertainty, not as leaf measurements |
| NBL-W-LM | Surface temperature -40 to 80 C, accuracy +/-0.5 C; DC 12-24 V; RS485 Modbus RTU | Provide a compatible supply and decode both surface channels correctly |
| NBL-W-LM power | 72 mW standby; 120 mW peak | Include the sensor in the complete station energy calculation |
| NBL-PH-1 | FLASH recording; configurable saving interval 1-240 minutes | Check that the selected recording interval satisfies the intended analysis |
For the wetness channel, agree how a surface reading becomes a wet/dry classification. The numerical wetness scale alone does not define an infection threshold or wetness-duration rule. The project needs a justified threshold and local checks of wetting and drying behavior rather than an assumed universal percentage.
Position a surface sensor near representative foliage, with an orientation and exposure suited to the crop observation. A device above an open mast may dry differently from shaded leaves inside a dense canopy. Avoid placing it under an unintended cover or beside a structure that drips onto it. Document the position so seasonal growth and later adjustments can be interpreted.
In a greenhouse, compare surface events with ventilation, misting and irrigation times. In an orchard, note rain and canopy changes. In a research plot, record treatments and observation locations. These records explain why two wetness traces differ; replacing every difference with one farm-wide average can remove the very local conditions the project seeks to investigate.
RS485 Modbus RTU brings compatible sensor values to a data logger, PLC or RTU. Device addresses, serial settings and scaling must match the selected instruments. The NBL-PH-1 data logger can collect, save and transmit configured measurements. This does not mean a crop disease model or advisory subscription is included.
Check wetness duration from time-stamped observations, not from a daily average percentage. Treat missing intervals as unknown unless the agreed method provides a justified alternative. Keep the model version and thresholds with the calculated result. During evaluation, compare alerts with scouting notes; a favorable environmental window and a confirmed infection are not the same finding.
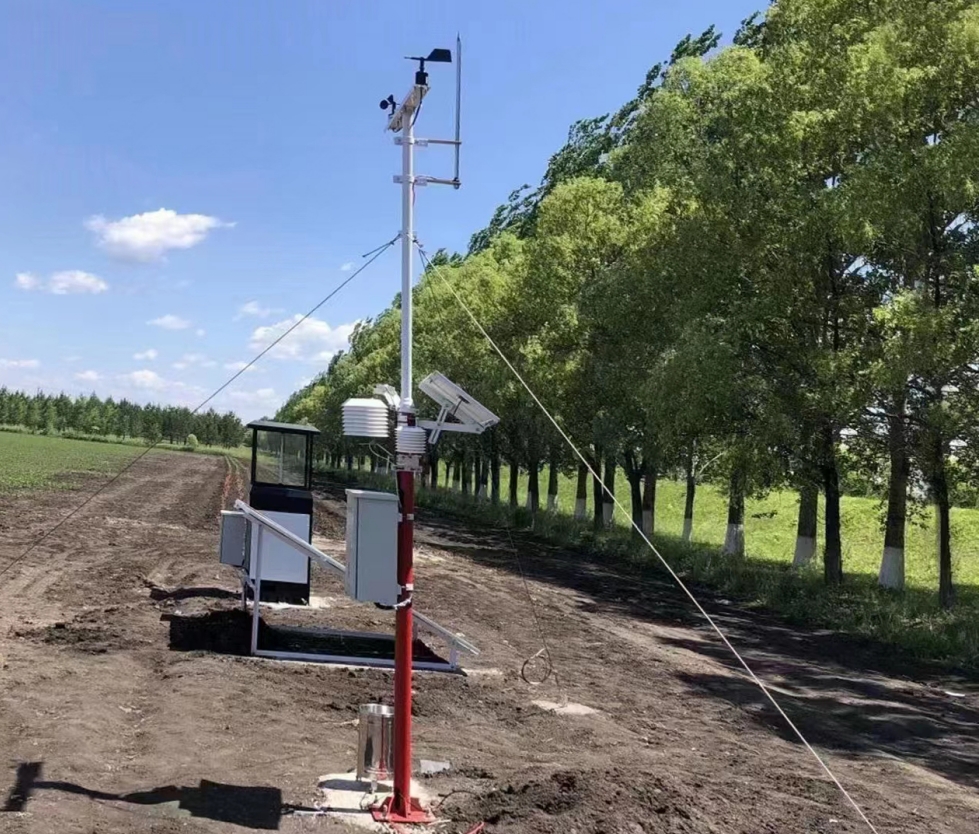
No. Atmospheric RH measures water vapor, whereas a wetness sensor responds to moisture on its sensing surface. Use the observation required by the disease model; do not substitute one merely because both channels display a percentage.
No. It supplies surface-condition observations. Disease identification requires appropriate crop assessment; an environmental risk calculation needs a separate crop-specific method and suitable inputs.
It may suit a defined reference position, but not necessarily contrasting canopy exposures. Compare the locations relevant to the project before deciding whether additional observations change the operational interpretation.
A sensor alert alone is insufficient. Treatment decisions need the applicable agronomic assessment and product-use requirements. Monitoring hardware should not be specified as automatic treatment authorization.
Provide the crop, disease question, required model inputs, canopy layout, recording interval and receiving system. Ask NiuBoL to distinguish sensors and logging from any separately required analysis software or service.
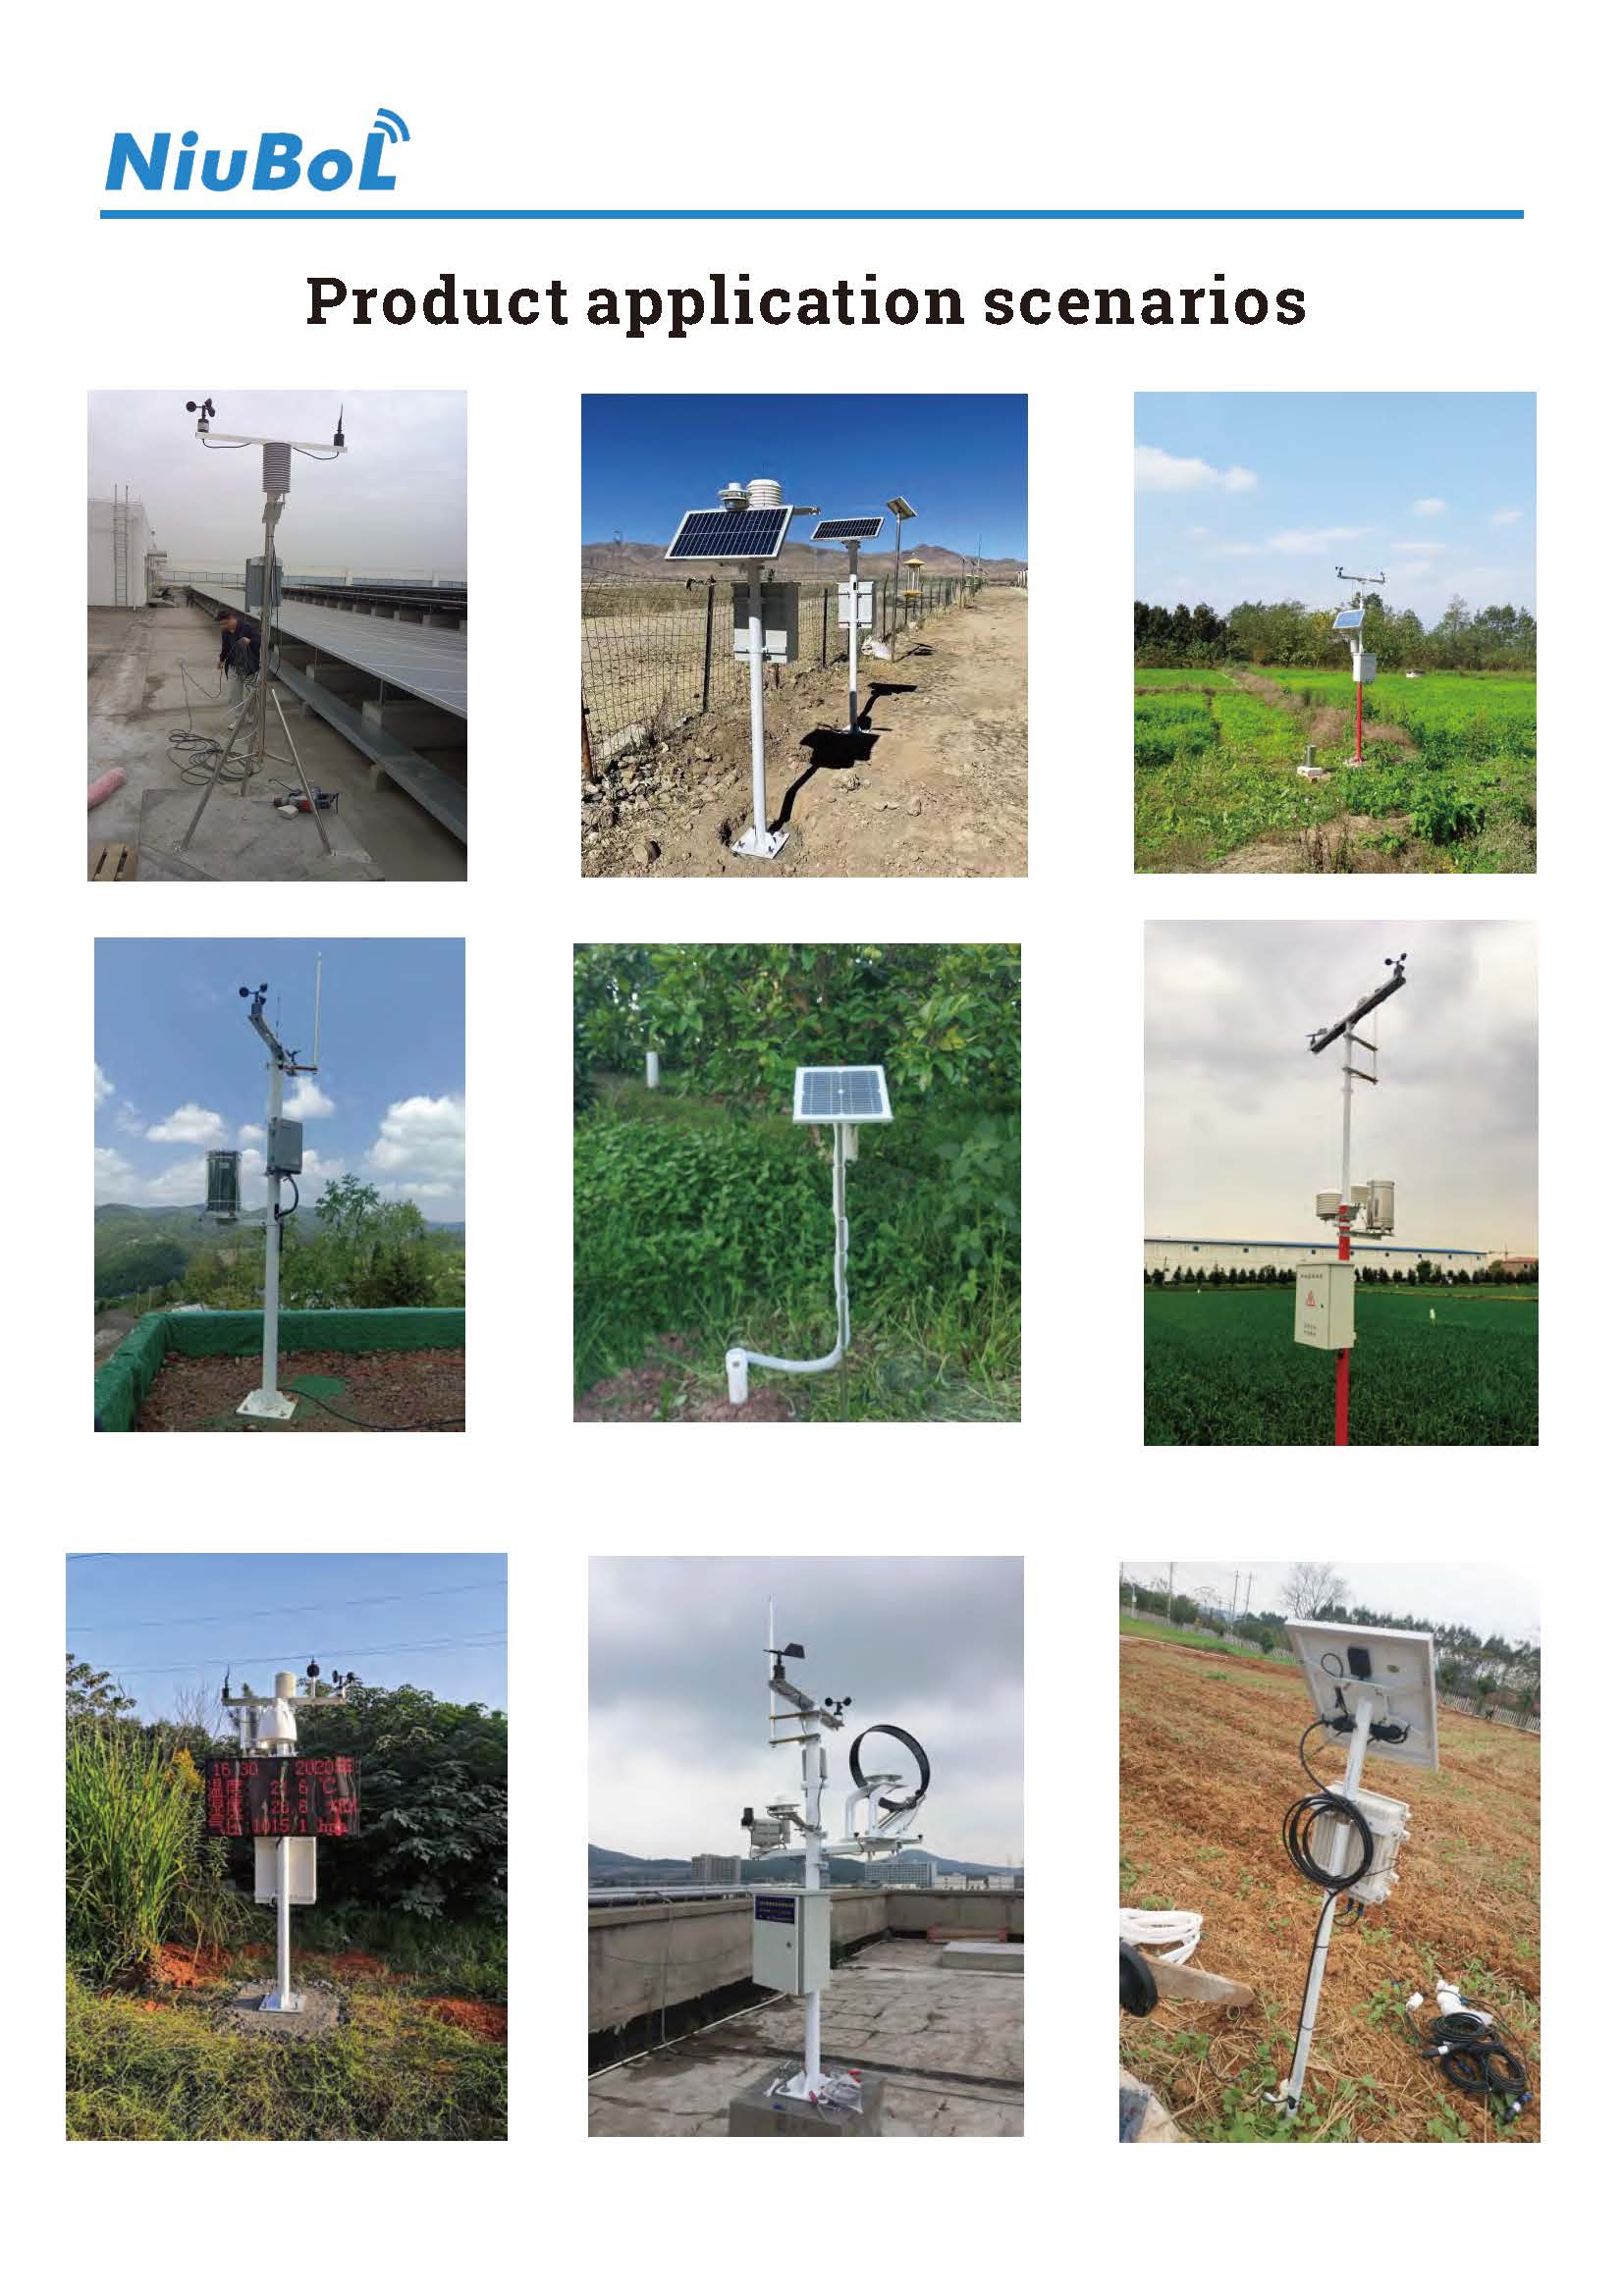
A weather station for crop disease monitoring is useful when its observations match a specific crop decision. Combine appropriate air, rainfall and surface measurements, retain their timing and exposure, and evaluate risk calculations against field observations. This produces a more defensible specification than buying additional channels without knowing how their data will be used.
Related recommendations
Sensors & Weather Stations Catalog
 Agriculture Sensors and Weather Stations Catalog-NiuBoL.pdf
Weather Stations Catalog-NiuBoL.pdf
Agriculture Sensors Catalog-NiuBoL.pdf
Water Quality Sensor Catalog-NiuBoL.pdf
Related products
 Combined air temperature and relative humidity sensor
 TDR Soil Moisture & Temperature Sensor for irrigation| RS485 |4-20mA| NBL-S-THR
 Soil pH sensor RS485 soil Testing instrument soil ph meter for agriculture |NBL-S-PH
 Wind Speed sensor Output Modbus/RS485/Analog/0-5V/4-20mA
 Tipping bucket rain gauge for weather monitoring auto rainfall sensor RS485/Outdoor/stainless steel
 Pyranometer Solar Radiation Sensor 4-20mA/RS485


Screenshot, WhatsApp to identify the QR code
WhatsApp number:+8615367865107
(Click on WhatsApp to copy and add friends)

