


— Solutions —
—Products—
 Consumer hotline +8618073152920
 WhatsApp:+8615367865107
Address:Room 102, District D, Houhu Industrial Park, Yuelu District, Changsha City, Hunan Province, China
Industrial & Energy
Time:2025-11-14 16:39:29 Popularity:999
Wind energy is a vital component of clean energy. The efficiency and safety of wind farms depend directly on accurate wind resource assessment and real-time monitoring. Traditional wind farms face the following challenges:
- Large errors in wind resource assessment: Mechanical anemometers have low accuracy and are susceptible to wind-blown sand and low temperatures, leading to biased investment decisions.
- Insufficient optimization of turbine operation: Delayed real-time wind speed and direction monitoring results in untimely nacelle yaw adjustments and reduced power generation efficiency.
- High risks from extreme weather: Lack of intelligent early warning and resistance to harsh environments can easily cause equipment damage and personnel safety hazards.
- Fragmented data: Wind speed, direction, environmental, and turbine vibration data are stored in isolation, resulting in low operational and maintenance (O&M) efficiency.
To address these issues, the NiuBoL Wind Energy Site Monitoring Comprehensive Solution adopts a full-chain approach of “high-precision sensors + edge collectors + cloud platform + mobile management”, enabling refined control of wind farms from site selection and assessment to daily O&M.

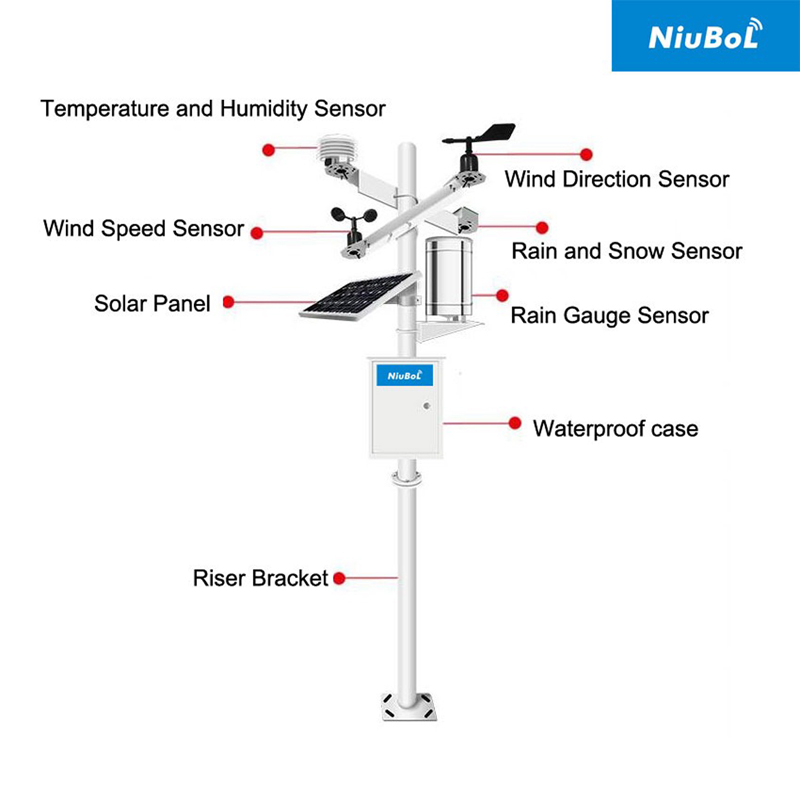
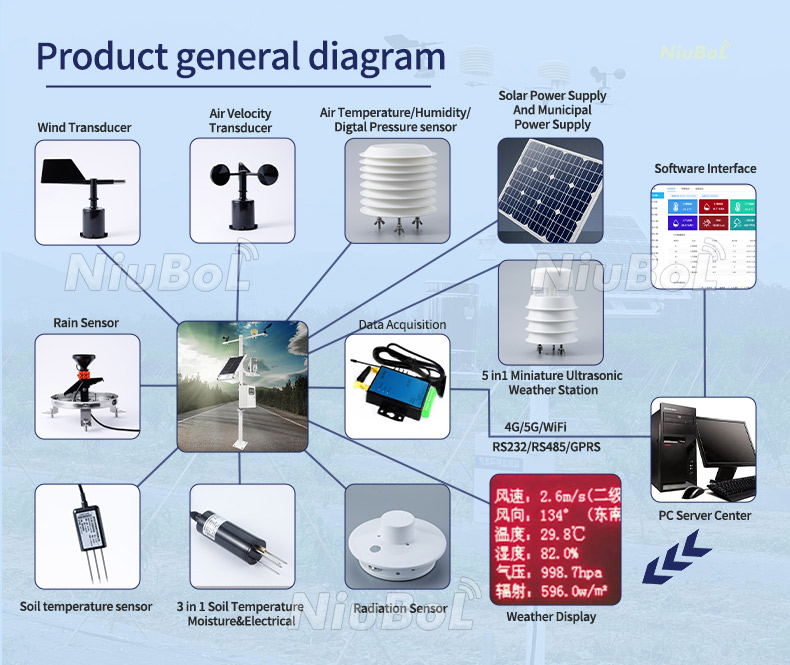
The wind energy site monitoring system consists of four major modules: front-end monitoring equipment, data acquisition and transmission equipment, cloud platform analysis system, and application-layer management system. It covers the entire process of wind farm site selection, construction, and operation, ensuring precise and reliable monitoring data, intelligent and efficient analysis, and rapid executable decisions.
Front-end equipment is the core of wind farm data acquisition, responsible for high-precision collection of wind speed, direction, environmental parameters, and turbine vibration data.
- Measurement range: 0.1–60 m/s
- Measurement accuracy: ±0.5 m/s
- Output method: RS485/Modbus
- Environmental adaptability: Operating temperature -40℃~85℃, protection rating IP65
Advantages:
- No mechanical components, avoiding wear from sand and freezing at low temperatures
- Built-in temperature compensation algorithm ensures data accuracy in extreme environments
- Can be directly installed on turbine tower tops or wind measurement masts, supporting flexible analog and digital bus access
- Suitable for complex environments such as onshore plateaus, coastal high-humidity areas, and desert regions with strong winds and sand

- Monitoring parameters: Temperature (-40~85℃), humidity (0~100%RH), air pressure (10~110 kPa)
- Purpose: Provides environmental compensation data for wind speed and direction monitoring
- Advantages:
- Analog and RS485 outputs, enabling synchronous acquisition with wind speed/direction sensors
- Accurate environmental data supports wind resource assessment models and turbine efficiency analysis
- Monitoring range: 0–1000 Hz
- Purpose: Monitors tower and blade vibrations to detect structural anomalies in advance
- Advantages:
- Correlated analysis with wind speed, direction, and environmental data enables intelligent early warning for “abnormal wind conditions → equipment failure”
2.1 Wind Power Data Collector
- Sensor compatibility: Supports simultaneous access to 16 sensors, including RS485, analog, and switch inputs
- Communication: 4G remote upload, local acquisition
- Industrial design with strong electromagnetic interference resistance
Advantages:
- Stable and reliable data transmission with breakpoint resume to ensure zero data loss
- Seamless integration with cloud platforms and SCADA systems
2.2 Network Optimization Solution
- Core areas: 4G private network for real-time data transmission
- Remote areas: LoRaWAN ad-hoc network + 4G backup
Data Management:
- Supports access for tens of thousands of devices
- Long-term storage of wind speed, direction, environmental, and vibration data for ≥5 years
- Response time ≤1 second to meet long-term wind resource assessment needs
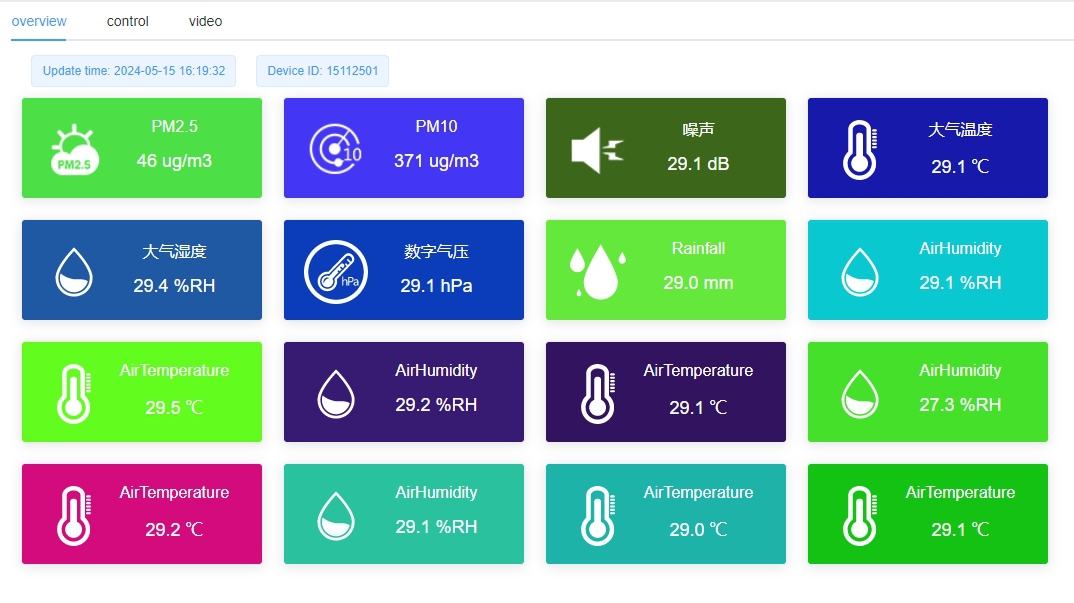
Visual Monitoring:
- GIS map displays a panoramic view of the wind farm
- Wind speed and direction shown with dynamic arrows; clicking a device reveals historical curves and reports
- Pop-up alerts, SMS, and App push notifications for anomalies

- Real-time monitoring: Wind speed, direction, and device status updates at each monitoring point with frequency ≤3 seconds
- Report generation: Daily/weekly/monthly wind energy monitoring reports, including average wind speed and power generation estimates, with export and sharing support
- Device management: Installation and O&M records, remote calibration, and fault reminders
- System configuration, user permission management, and data statistical analysis
- Large-screen real-time display of field-wide wind conditions and turbine status for operational decision-making
- Deploy 60–100 m wind measurement masts
- Arrange points at 500 m intervals in core areas
- Securely install sensors and wire collectors
- Calibrate anemometers and conduct 72-hour trial operation to optimize parameters
- Debug integration with SCADA system
- Sensors collect data every 0.1 second; collectors preprocess and upload to the cloud platform every 5 seconds
- Cloud platform cleans data, removes outliers, and generates wind condition analysis
- Tiered early warnings pushed to O&M terminals and turbine control systems
- Data-driven optimization of nacelle yaw and turbine layout
- Advance O&M scheduling for vibration anomalies

- High Precision: Ultrasonic anemometer with ±0.5 m/s wind speed and ±1° wind direction accuracy, reducing traditional mechanical errors by 80%
- Stability and Reliability: All equipment resistant to -40℃~85℃, Level 12 winds, IP65 protection; offshore anti-salt spray version enables long-term use
- Full-Process Coverage: Digitalization across the entire lifecycle of wind farm site selection, construction, and O&M
- SCADA Compatibility: Supports mainstream turbine brands with low-cost integration
| Risk | Countermeasure |
| High equipment cost | Tiered deployment with core + auxiliary economic sensors; offer installment/lease options |
| Environmental adaptability | Offshore anti-salt spray, low-temperature anti-freeze, plateau air pressure compensation |
| Data integration | Seamless access to existing SCADA via Modbus and OPC UA |

A1: Applicable to onshore and offshore wind farm site selection assessment, operational monitoring, distributed wind power management, and monitoring system upgrades for aging wind farms. The system covers turbine operation optimization, equipment status monitoring, and long-term wind resource assessment, meeting diverse needs in wind power development and O&M.
A2: Wind speed measurement range of 0.1–60 m/s and wind direction accuracy of ±1° cover the cut-in, rated, and cut-out wind speeds of mainstream 1.5 MW to 5 MW turbines.
A3: The NiuBoL ultrasonic anemometer has no mechanical parts and operates stably from -40℃ to 85℃. With IP65 protection and an offshore version featuring anti-salt spray coating, it passes salt spray, sand, and low-temperature freeze tests, ensuring stable operation for over 3 years.
A4: Supports mainstream turbine SCADA systems (e.g., Goldwind, Envision, Ming Yang) via standard protocols like Modbus and OPC UA for seamless integration. Historical data can be migrated to the new platform for unified low-cost management.
A5: Small wind farms (≤20 turbines) take ~15 days; large wind farms (≥100 turbines) take ~30 days. Modular design allows single-turbine installation during downtime, with ≤2 hours of downtime per turbine and no impact on overall generation.
A6: Equipment is maintenance-free with a collector failure rate <0.5%. NiuBoL provides training and manuals; regular O&M staff can perform daily operations after 1 day of training.
A7: The wind power data collector has built-in caching for 7 days of data; cached data is automatically uploaded upon communication restoration, ensuring data integrity.
A8: Adopt tiered deployment: high-precision NiuBoL anemometers on turbine towers in core areas, with economic sensors in auxiliary areas.

The NiuBoL Wind Energy Site Monitoring Solution, centered on high-precision sensors, intelligent edge collectors, cloud platform analysis, and mobile management, covers the full process of wind farm site assessment, turbine optimization, and safety assurance. By accurately capturing wind speed and direction changes, providing real-time warnings and intelligent predictions, it increases power generation efficiency by ≥8%, reduces equipment failure rates by ≥30%, and achieves digital, intelligent, and efficient management of wind farms.
Prev:Industrial Environmental Safety Monitoring Solution
Next:Power Station Weather Monitoring — Weather Station for Power Plants
Related recommendations
Sensors & Weather Stations Catalog
 Agriculture Sensors and Weather Stations Catalog-NiuBoL.pdf
Weather Stations Catalog-NiuBoL.pdf
Agriculture Sensors Catalog-NiuBoL.pdf
Water Quality Sensor Catalog-NiuBoL.pdf
Related products
 Combined air temperature and relative humidity sensor
 Soil Moisture Temperature sensor for irrigation|NBL-S-THR
 Soil pH sensor RS485 soil Testing instrument soil ph meter for agriculture |NBL-S-PH
 Wind Speed sensor Output Modbus/RS485/Analog/0-5V/4-20mA
 Tipping bucket rain gauge for weather monitoring auto rainfall sensor RS485/Outdoor/stainless steel
 Pyranometer Solar Radiation Sensor 4-20mA/RS485

Screenshot, WhatsApp to identify the QR code
WhatsApp number:+8615367865107
(Click on WhatsApp to copy and add friends)
