





— Blogs —
—Products—
 Consumer hotline +8618073152920
WhatsApp:+8615367865107
Address:Room 102, District D, Houhu Industrial Park, Yuelu District, Changsha City, Hunan Province, China
Product knowledge
Time:2025-09-20 11:41:04 Popularity:1134
COD sensors support continuous observation of changes in water's oxidizable content, but the measurement principle matters. A chemical analyzer determines oxygen demand through a defined oxidation method. A UV COD sensor measures optical absorption and reports a calibrated COD-equivalent estimate. For wastewater control or river alarms, validate that estimate against representative samples before using it as a substitute for a laboratory result.

Chemical oxygen demand is the oxygen-equivalent amount of substances oxidized under specified test conditions, expressed as mg O2/L. It is not a dissolved oxygen concentration and does not identify individual pollutants. Some inorganic reducing substances also contribute to chemical oxygen demand, so COD should not be described as an exact measurement of all organic matter.
A chemical reference method such as EPA Method 410.4 uses dichromate digestion and colorimetric determination. A reagent-free UV probe does not perform that digestion inside the water. It measures how light is absorbed across its optical path and converts the response using calibration coefficients.
Many organic compounds absorb ultraviolet light, but their absorption strengths differ. A water sample rich in UV-absorbing compounds can produce a different optical response from another sample with the same laboratory COD. A factory calibration against potassium hydrogen phthalate (KHP) establishes a response to that standard; it does not establish identical behavior for every industrial effluent.
| Question | Chemical COD analyzer | UV COD sensor |
|---|---|---|
| What is observed? | Oxidant consumption or related response after defined chemical treatment | Optical absorption converted to a COD-equivalent value |
| What supports comparison? | Consistent digestion, quality control and applicable reference method | Clean optics, calibration and representative paired laboratory samples |
| Operational trade-off | Reagents, digestion cycle and waste handling | Matrix dependence, optical fouling and possible interference |
| Suitable role | Method-based determination where accepted for the duty | Continuous trend and event monitoring after application validation |
At an industrial wastewater equalization tank, a UV signal can reveal a change in incoming water between laboratory sampling rounds. That information can prompt a grab sample, investigation of an upstream discharge or a review of treatment loading. It should not automatically trigger a conclusion that a particular pollutant or production line caused the change.
Across a treatment stage, simultaneous upstream and downstream observations can support process assessment. Account for hydraulic residence time: comparing inlet and outlet values at the same clock time may compare different water parcels. If mass loading is the objective, concentration alone is insufficient; use representative flow information and a suitable sampling basis.
In rivers and reservoirs, a trend can flag runoff or changing organic matter. Seasonal source changes can alter the relationship between absorbance and laboratory COD. Revisit the correlation after a change in catchment conditions rather than assuming a calibration fitted in dry weather will describe every storm event.
For treated-water projects with low expected concentrations, check the required decision threshold against full-scale accuracy, reference-method uncertainty and site variability. A sensor that reports decimal increments is not necessarily able to resolve the small difference needed for a release decision. COD alone also cannot demonstrate drinking-water safety.
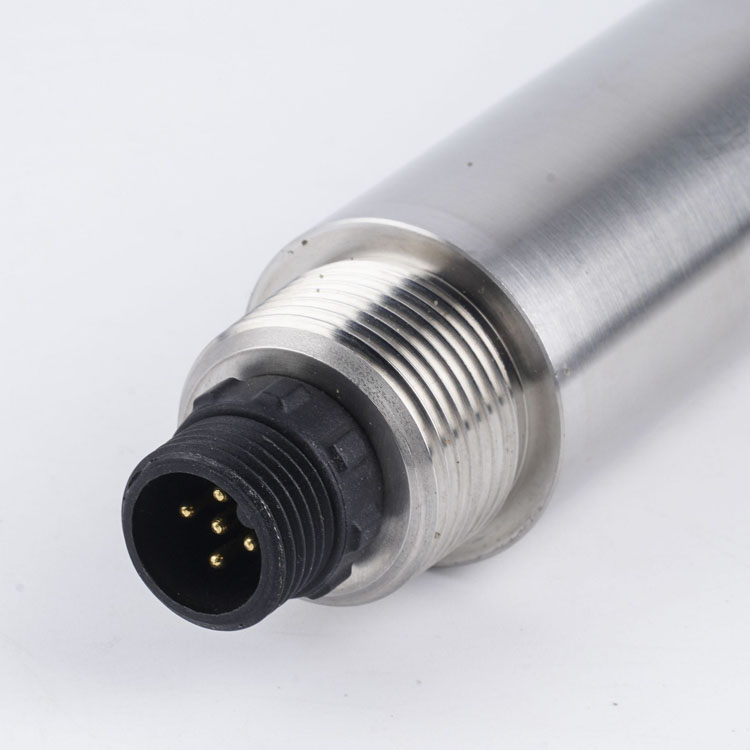
The NiuBoL NBL-WQ-COD online sensor uses dual-wavelength UV absorption, with a reference channel to compensate for part of the effect of turbidity. It also reports turbidity and temperature and has a cleaning brush. Compensation and brushing reduce specific measurement problems; neither eliminates the need for water-specific checks.
| Parameter | NBL-WQ-COD configuration |
|---|---|
| Measurement principle | Dual-wavelength UV absorption |
| COD / turbidity range options | 0-200 mg/L equivalent KHP / 0-100 NTU; or 0-500 mg/L equivalent KHP / 0-200 NTU |
| Accuracy | COD and turbidity: +/-5% full scale |
| Resolution | COD: 0.1 mg/L; turbidity: 0.1 NTU |
| Calibration | Two-point |
| Output | RS485 Modbus RTU |
| Supply / consumption | 12-24 VDC / 0.3 W at 12 V |
| Operating conditions | 0-45 degrees C; pressure below 0.1 MPa |
| Housing / protection | 316L stainless steel / IP68 |
| Installation / cable | Immersion / standard 5 m, other lengths available |
Full-scale accuracy has a practical consequence. At +/-5% FS, the stated COD accuracy corresponds to +/-10 mg/L on a 200 mg/L range or +/-25 mg/L on a 500 mg/L range. These are arithmetic interpretations of the range specification, not a guarantee of agreement with chemical COD in an untested water matrix. Select the range around both expected peaks and the smallest difference the project needs to interpret.
Do not install this immersion probe directly in a higher-pressure process line because the housing is stainless steel or IP68. Pressure and chemical exposure remain separate constraints. Cable-jacket composition is not specified in this table; obtain the offered material if the installation involves aggressive water or long-term outdoor exposure.
Calibration with a standard checks the instrument response; paired field samples check whether that response represents the actual water. They answer different questions. For commissioning, collect samples close to the sensing location and at the recorded measurement time. Coordinate sample handling and preservation with the laboratory method rather than leaving samples exposed beside the instrument.
If residual differences change with source composition or turbidity, one multiplier may not solve the problem. Investigate the matrix and optical conditions before adding an offset. Where an acceptable relationship cannot be established, retain the probe for trend observation or select a different analytical approach instead of labeling its output laboratory-equivalent COD.
UV absorbance can be affected by non-target absorbing substances, color, particles and bubbles. The relative effects depend on the optical design and water chemistry. Turbidity compensation is not proof that nitrate, every colored compound or every particle distribution has been removed from the result.
Choose a location with representative exchange of water, not a stagnant pocket. Keep the optical gap submerged and free of trapped bubbles. Avoid direct exposure to an aerator plume where bubbles repeatedly cross the beam, and leave clearance for the cleaning brush to move. A mechanically secure bracket should permit inspection without pulling on the cable.
Inspect the windows and brush after early operation to establish the local fouling rate. Fibers, grease and mineral scale can persist despite automatic wiping. Compare readings before and after cleaning: a large change caused by cleaning is a maintenance finding, not evidence that the river or treatment process suddenly improved.
Use compatible cleaning methods without scratching the optical surfaces. Verify with suitable standards after maintenance or a suspected drift event. The NBL-WQ-COD has range-specific calibration procedures; do not apply the same zero and span values to both range options or copy commands from an unrelated sensor.
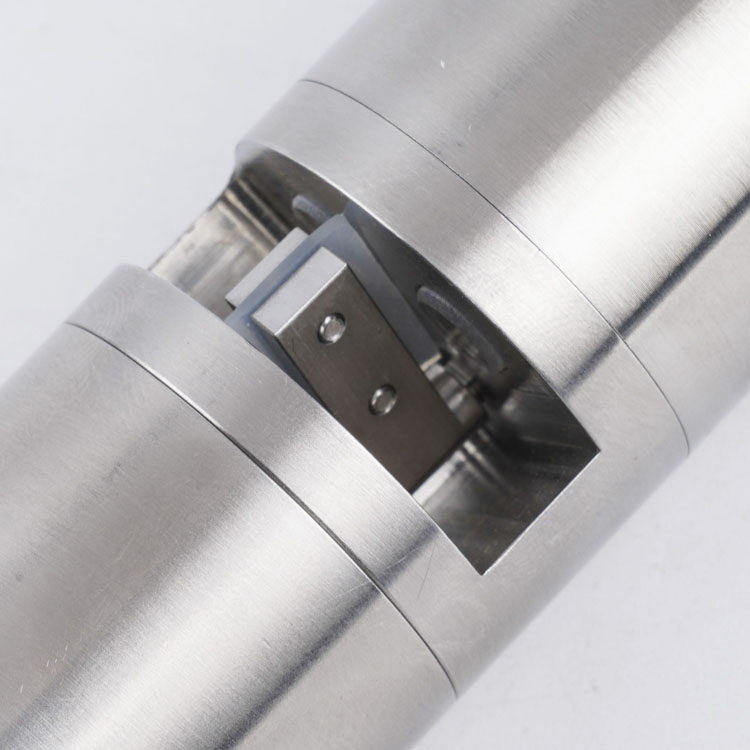
RS485 Modbus RTU provides a local connection to a compatible PLC, RTU or data logger. Confirm serial settings, device address, register definitions, units and scaling for the delivered version. The sensor is not a standalone cellular station; remote transmission requires a gateway or logger and an appropriate communications service.
Log turbidity and temperature alongside COD where the interface provides them. Keep timestamps and communication failures visible so operators can distinguish a frozen host value from stable water. If cleaning cycles disturb readings, define how those periods are identified in the host rather than silently treating them as process changes.
Start alarms as investigation prompts while the site's relationship is being established. A trend alarm can request a sample or operator check. Automatic process actions and compliance reporting need a separately agreed acceptance basis, fault handling and any applicable method authorization.
 NBL-COD-208 Online COD Water Quality Sensor.pdf
Not automatically. It can provide a validated estimate for a defined water matrix, but it does not perform chemical digestion. Use the required reference method for regulated reporting unless the relevant authority and project specification accept the alternative.
Compare expected peaks and decision thresholds with the full-scale accuracy. The 200 mg/L range has a stated +/-10 mg/L full-scale equivalent accuracy, so a small decimal change should not be treated as a verified small concentration difference. Test representative water before committing to a low-level decision duty.
No. Check brush movement, optical cleanliness and deposits that wiping does not remove. Set inspection intervals from early site observations and shorten them if cleaning causes significant changes in readings.
A change in the types of organic compounds, interfering absorption, turbidity or fouling can alter the optical relationship. Check paired samples and optics before recalibrating. A clean probe that tracks one effluent well may need a new validation when that effluent changes.
Only within its optical and concentration range and validated water conditions. The listed NBL-WQ-COD options stop at 200 or 500 mg/L equivalent KHP. Higher chemical COD does not justify extrapolating beyond that range; evaluate sample conditioning or a different analyzer.
Provide paired laboratory results if available, normal and peak COD, turbidity, process composition, temperature, installation pressure and receiving equipment. Include cleaning access and the intended decision: trend alarm, treatment adjustment or reporting. Quotation scope should identify the range, cable, mounting, logger and validation support separately.
Choose COD sensors by the measurement decision, not by the label alone. UV monitoring offers continuous optical observations without digestion reagents, while its COD-equivalent output depends on calibration and water composition. A representative installation, paired laboratory checks and accessible optics determine whether the NBL-WQ-COD can support the project's treatment or environmental monitoring task.
Prev:Turbidity Sensor Working Principle, Types & Applications
Next:Industrial pH Sensors: Functions, Temperature Compensation and Limits
Related recommendations
Sensors & Weather Stations Catalog
Agriculture Sensors and Weather Stations Catalog-NiuBoL.pdf
Weather Stations Catalog-NiuBoL.pdf
Agriculture Sensors Catalog-NiuBoL.pdf
Water Quality Sensor Catalog-NiuBoL.pdf
Related products
 Combined air temperature and relative humidity sensor
 TDR Soil Moisture & Temperature Sensor for irrigation| RS485 |4-20mA| NBL-S-THR
 Soil pH sensor RS485 soil Testing instrument soil ph meter for agriculture |NBL-S-PH
 Wind Speed sensor Output Modbus/RS485/Analog/0-5V/4-20mA
 Tipping bucket rain gauge for weather monitoring auto rainfall sensor RS485/Outdoor/stainless steel
 Pyranometer Solar Radiation Sensor 4-20mA/RS485


Screenshot, WhatsApp to identify the QR code
WhatsApp number:+8615367865107
(Click on WhatsApp to copy and add friends)

