





— Blogs —
—Products—
 Consumer hotline +8618073152920
WhatsApp:+8615367865107
Address:Room 102, District D, Houhu Industrial Park, Yuelu District, Changsha City, Hunan Province, China
Product knowledge
Time:2025-09-26 14:49:04 Popularity:962
Weather stations for coffee plantations should separate an exposed reference-weather record from the conditions inside the coffee canopy. Use local observations with block, cultivar, flowering and harvest records to investigate crop responses. A station does not predict coffee yield, diagnose disease or measure cup quality on its own.

Elevation, slope aspect and shade can produce different exposures within one plantation. An open weather station helps describe atmospheric conditions at a reference location. A sensor beneath shade trees describes that particular canopy environment. Neither location is automatically wrong, but the record must state which question it addresses.
For a cooperative comparing blocks, retain block identity, cultivar, planting information and management changes with the weather history. If shade trees are pruned, record the date. A change in the measured light or temperature may reflect the new exposure rather than a regional weather shift. Avoid combining readings from changed locations without retaining that boundary.
| Task | Useful observations | Additional record needed |
|---|---|---|
| Compare blocks after a rainfall event | Rainfall timing, local accumulation and soil response where required | Field condition and observed flowering or crop-stage dates |
| Evaluate shade management | Canopy temperature and an appropriate light measurement | Sensor placement, shade changes and the comparison period |
| Review leaf-surface conditions | Suitable leaf-surface observations with temperature | A defined wetness interpretation and field disease observations |
| Develop a harvest or yield model | Consistent weather records over relevant periods | Measured harvest outcomes, cultivar and management data, with independent model testing |
These tasks need different measurement arrangements. Do not describe a standard temperature, humidity and rainfall station as automatically providing every calculation. Begin with the observations used by the plantation manager or adviser, and specify any additional light, soil or leaf measurement separately.

The NiuBoL NBL-W-HPRS pyranometer measures broadband solar irradiance in W/m2. Its spectral range is 0.3-3 micrometres and its measurement range is 0-2000 W/m2. This is not the same quantity as photosynthetically active photon flux density, commonly expressed in micromoles/m2/s.
If the study concerns light available to the crop under shade, specify a suitable PAR measurement rather than renaming the pyranometer output. If the task is an exposed weather or energy-balance record, a broadband measurement may be appropriate. Record whether a sensor is level, tilted or beneath the canopy; those exposures cannot be compared as though they measure the same incident radiation.
A leaf-shaped instrument can respond to wetting and drying at its installed exposure. It does not sample every leaf in the plantation. Choose the canopy layer and angle around the observation task, and keep those details with the record. A probe beside an open path may dry differently from leaves inside a dense shaded block.
The NBL-W-LM leaf-surface sensor provides temperature and surface-moisture-related observations through RS485. Before using its output as wetness duration, confirm the channel definition and a suitable wet/dry rule, then compare with actual field wetting. An ordinary air relative-humidity record is not a direct measurement of liquid water on leaves.
| NiuBoL component | Selected specification | Plantation consideration |
|---|---|---|
| NBL-W-LBTH | Air temperature -40 to 80 C, +/-0.5 C; humidity 0-100% RH, +/-5% RH; DC 12-24 V | Choose exposed or canopy placement deliberately and keep shield airflow clear. |
| NBL-W-LM | DC 12-24 V; RS485 Modbus; 9600 bps; temperature -40 to 80 C, +/-0.5 C | Confirm the moisture output interpretation before applying a disease model. |
| NBL-W-RS | Liquid rainfall; 0.2 mm per pulse | A gauge beneath tree drip is not an open rainfall reference. |
| NBL-W-HPRS | 0-2000 W/m2; 0.3-3 micrometres; output and supply selected by version | Broadband irradiance, not a PAR channel. |

Record actual flowering dates, crop stage and harvest quantities by block. These outcomes provide a basis for testing a relationship with rainfall or temperature. A weather trace alone cannot distinguish weather effects from cultivar, pruning, nutrition, crop load or other management differences.
If an adviser proposes a growing-degree-day or statistical model, request its input requirements, calculation method and validation results for the intended use. Select base temperatures and other settings through an appropriate crop method, not a generic logger default. Evaluate the forecast against observations not used to fit the model, and report uncertainty rather than a precise-looking harvest date without supporting performance.
Disease-risk models need the same discipline. A wet interval can be an input to a specified model, but is not a diagnosis or a universal instruction to spray. Retain field observations and the agronomist's assessment. Application decisions also require the relevant product instructions, field conditions and operating procedure.
Check mobile reception at the actual station location rather than at a nearby road or office. For solar power, assess shade throughout the year and the full station load. A suitable measuring location beneath the canopy may be unsuitable for the solar panel, so treat cable routing and power placement as part of the installation design.
A NBL-PH-1 logger can provide local records and configured 4G delivery. Confirm how staff retrieve observations after a connection outage. Keep acquisition time, block identity, units and missing-data flags in the exported file. Separate a missing rainfall period from a valid period with no rain.
Set inspection frequency from local conditions and early operating experience. Rain funnels can collect leaves and debris; exposed surfaces need checks for fouling, and growing vegetation can change shade. A fixed quarterly visit is not sufficient evidence that every wet-season installation will remain usable.
For a quotation, provide the terrain and block layout, shade conditions, intended observations and required analysis. Specify the receiving system and any RS485 Modbus RTU versions needed. Ask NiuBoL to match the measurement configuration; any advisory model, forecast service or satellite-data integration should have its own agreed scope.
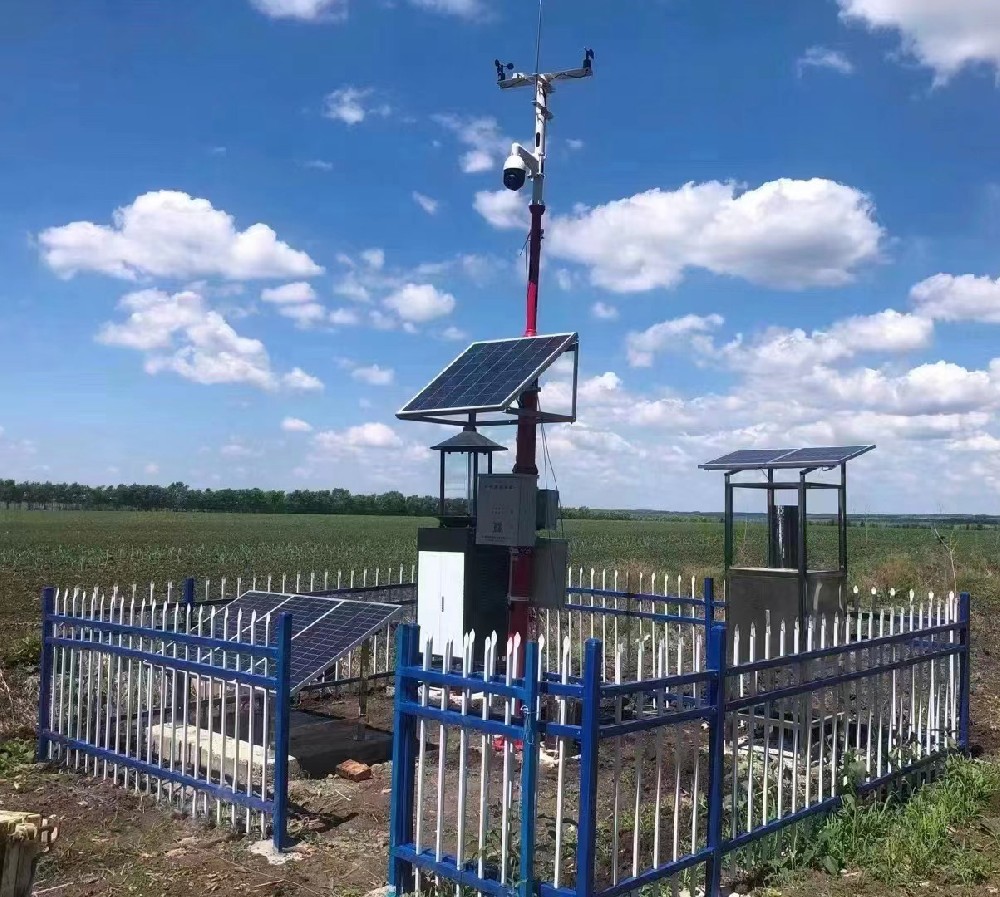
Choose a representative exposed site for a reference-weather record. Use separately identified canopy sensors when the question concerns shade or leaf conditions. Document elevation and exposure; do not present either point as representative of every slope and block without comparison.
Not by relabeling its output. NBL-W-HPRS measures broadband irradiance in W/m2. A PAR task requires an appropriate photon-flux measurement and the corresponding units, response and installation.
Not directly. Leaf wetness depends on surface conditions at the leaf or representative sensor. Confirm the surface channel and wet/dry interpretation, then evaluate the resulting duration for the intended model.
It supplies observations. Yield prediction requires an independently tested method using appropriate crop and management records. Do not purchase a station on the assumption that a weather-data display includes a validated coffee-yield model.
Start from distinct management blocks, elevation and shade differences. Use comparisons to decide whether another location changes a practical decision. Area alone or a fixed gateway coverage radius cannot determine the number of representative measurement points.
Check exposure, channel scaling, correct rainfall counting, timestamps and retrieval after an outage. For a derived model output, also check its inputs, settings and validation evidence. A working mobile dashboard does not establish forecasting accuracy.
Weather stations for coffee plantations are useful when reference weather, canopy observations and crop outcomes remain distinguishable. NiuBoL instruments can provide the measurement layer. Choose the channels around the plantation task and require evidence for any claimed forecast, disease-risk or light-response analysis.
Prev:Environmental Sensors for Poultry Houses: Placement, Gas Ranges and Control
Next:IoT Sensors for Rice Irrigation: Water Level or Soil Moisture?
Related recommendations
Sensors & Weather Stations Catalog
 Agriculture Sensors and Weather Stations Catalog-NiuBoL.pdf
Weather Stations Catalog-NiuBoL.pdf
Agriculture Sensors Catalog-NiuBoL.pdf
Water Quality Sensor Catalog-NiuBoL.pdf
Related products
 Combined air temperature and relative humidity sensor
 TDR Soil Moisture & Temperature Sensor for irrigation| RS485 |4-20mA| NBL-S-THR
 Soil pH sensor RS485 soil Testing instrument soil ph meter for agriculture |NBL-S-PH
 Wind Speed sensor Output Modbus/RS485/Analog/0-5V/4-20mA
 Tipping bucket rain gauge for weather monitoring auto rainfall sensor RS485/Outdoor/stainless steel
 Pyranometer Solar Radiation Sensor 4-20mA/RS485


Screenshot, WhatsApp to identify the QR code
WhatsApp number:+8615367865107
(Click on WhatsApp to copy and add friends)

