


— Blogs —
—Products—
 Consumer hotline +8618073152920
 WhatsApp:+8615367865107
Address:Room 102, District D, Houhu Industrial Park, Yuelu District, Changsha City, Hunan Province, China
Product knowledge
Time:2026-06-16 14:17:57 Popularity:150
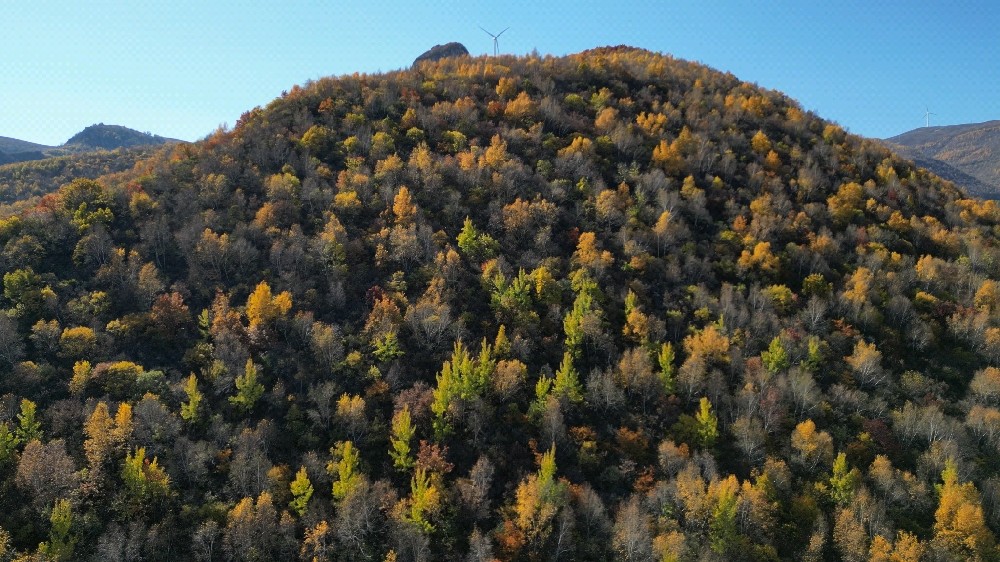
Negative oxygen ion monitoring is used in scenic areas, forest parks, resorts and ecological environments to present air-quality value, support environmental management and provide visible data for smart tourism projects.
Negative oxygen ions are often used as an environmental quality indicator in ecological and tourism projects. Scenic areas want to show clean air, forest value and environmental comfort through measurable data rather than promotional claims.
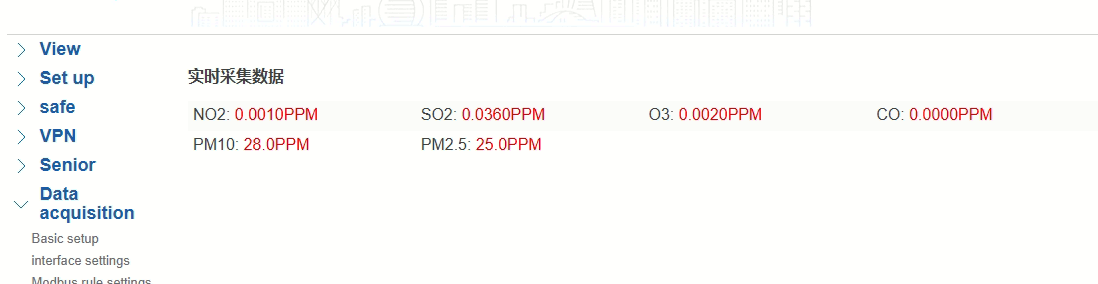
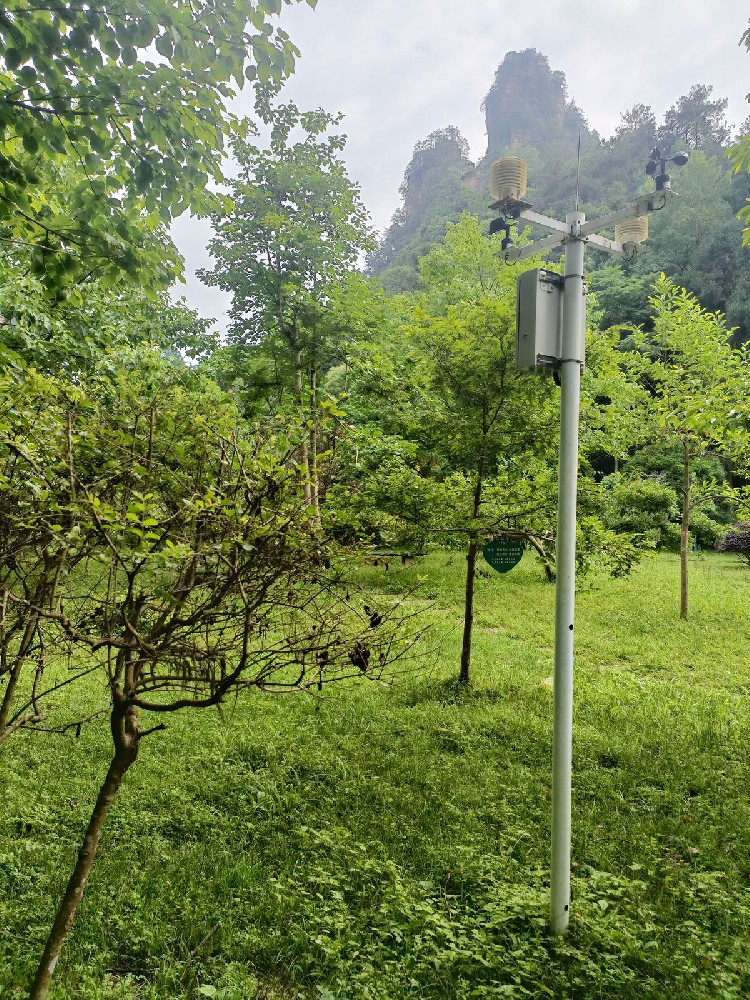
A monitoring system can combine negative oxygen ion concentration with weather parameters, PM2.5, PM10, gas indicators, illumination and platform display. This gives managers both public-facing information and internal operation data.
A practical system includes monitoring terminal, display publishing terminal, data transmission, server, management software and mobile viewing. Data can be stored, analyzed, displayed on LED screens or shown on mobile platforms.
For scenic areas, the system should be easy to maintain, reliable outdoors and suitable for public display. It may be connected with weather stations and air quality sensors to provide a more complete environmental profile.
Environmental data can be displayed at visitor centers, entrance areas, viewing platforms and online channels. The goal is to make ecological quality visible and to help managers track seasonal changes.
For system integrators, the important work is data structure: measurement point, display format, refresh interval, storage, report and platform permissions. These details decide whether the system is useful after installation.
| Item | Engineering Reference |
|---|---|
| System type | Negative oxygen ion and scenic area environmental monitoring system |
| Measured parameters | Negative oxygen ion concentration, weather parameters and optional air quality indicators |
| Display | Local screen, LED display or multimedia display depending on project |
| Data platform | Server storage, chart analysis, report management and mobile viewing |
| Communication | RS485 sensor acquisition with 4G / Ethernet / platform transmission depending on station design |
| Typical configuration | Weather five parameters, PM2.5, PM10, NO2, CO, SO2, O3, illumination and negative ion monitoring |
| Application | Scenic areas, forest parks, resorts, ecological monitoring and tourism information release |
| Data refresh | Continuous online acquisition according to station configuration |
| Integration value | Supports public display, environmental evaluation and smart tourism operation |

Site environment challenge: The operator wants to quantify ecological air quality.
System integration scheme: Deploy negative ion monitoring with weather and PM data.
User value delivered: Visitors and managers see visible environmental data.
Site environment challenge: Public air quality and comfort need regular display.
System integration scheme: Use monitoring terminals and display screens at representative points.
User value delivered: The park improves environmental transparency.
Site environment challenge: Air quality is part of the service value.
System integration scheme: Integrate negative ion, weather and air quality data into a display platform.
User value delivered: The operator supports marketing with measured data.
Site environment challenge: Managers need continuous ecological condition records.
System integration scheme: Store data on a server and generate charts and reports.
User value delivered: The owner gains long-term evidence for ecological management.
Define whether the project is for public display, internal monitoring or both.
Choose negative ion monitoring together with weather and air-quality parameters when context is needed.
Confirm display method: LED screen, multimedia screen, web or mobile.
Check outdoor protection, power supply and communication method.
Plan server storage and report export.
Confirm the required signal path before purchase: sensor or device output, data logger, RTU, 4G gateway, cloud platform and any local display should be defined as one chain.
For RS485 systems, document address, baud rate, register mapping, unit conversion and grounding method during commissioning so later maintenance does not depend on one installer.
For solar-powered field equipment, review local sunlight, battery capacity, working schedule, enclosure protection and service access. A device that works in a demo may fail if energy balance and cleaning access are ignored.
Install monitoring points away from artificial airflow or temporary interference.
Use consistent naming and map locations for multi-point scenic-area systems.
Buyers should avoid purchasing only a handheld detector when the project needs online display and long-term records. A scenic area system requires sensors, communication, platform, display and maintenance.
A professional proposal should explain which parameters are measured, how visitors see the information, how managers export reports and how the system will be maintained through seasons.
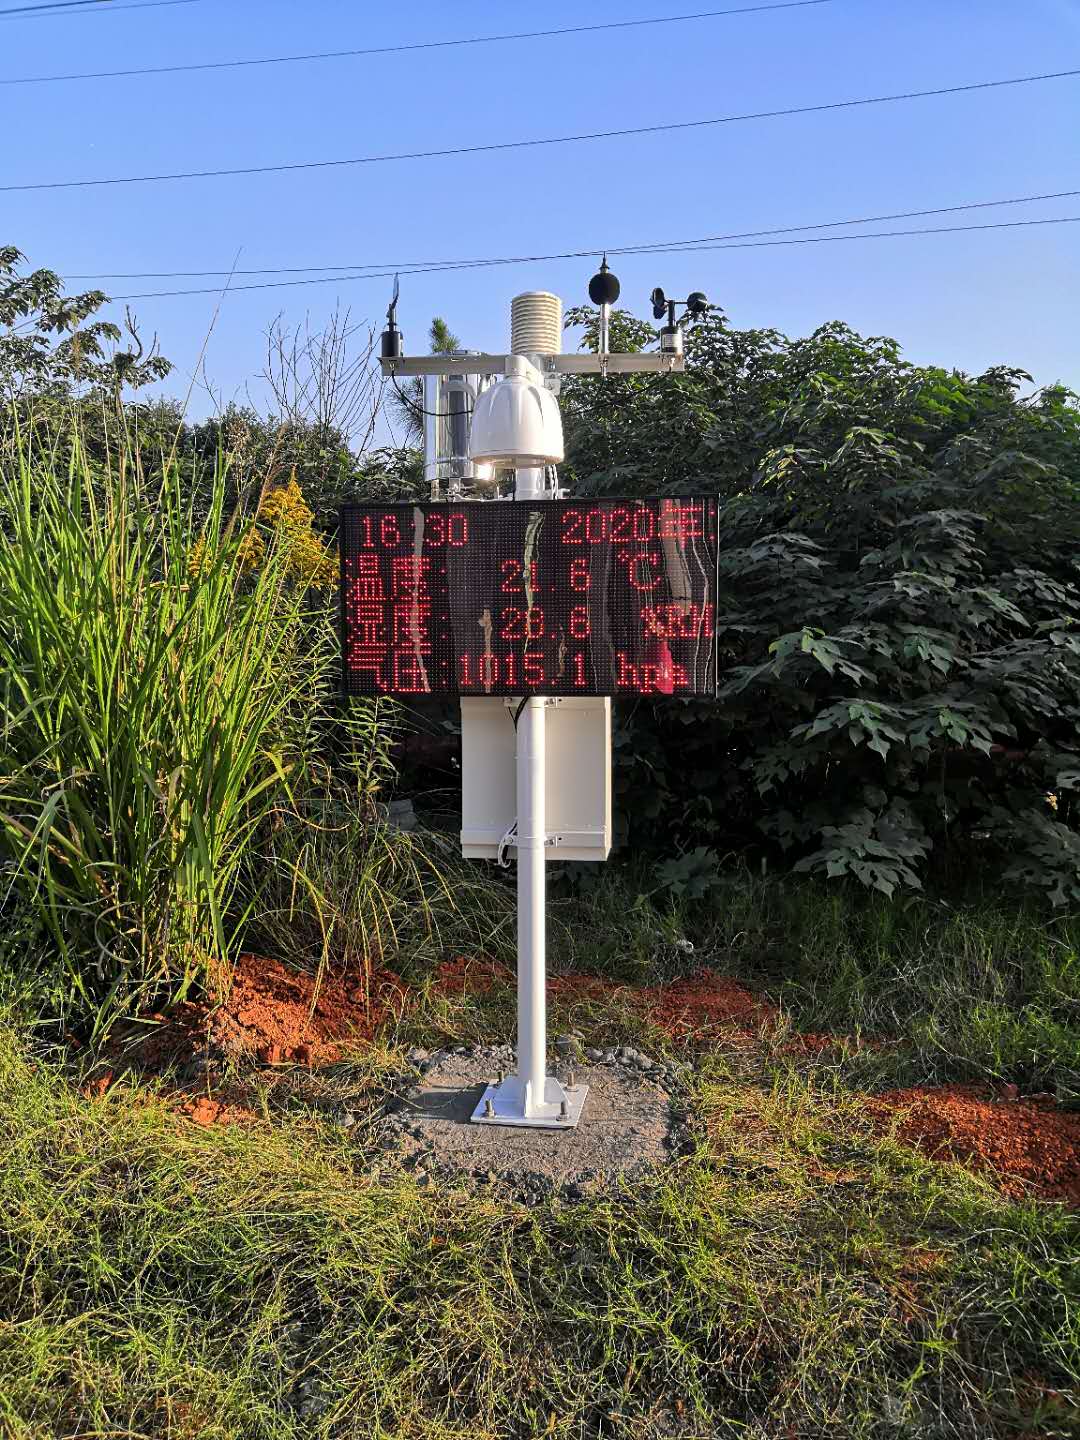
A complete system should include monitoring terminal, data transmission, platform storage, display publishing and optional weather or air-quality parameters.
Monitoring points should represent visitor areas or ecological zones and avoid artificial airflow, temporary pollution sources and non-representative corners.
Weather data, PM2.5, PM10, CO, SO2, NO2, O3, illumination and humidity can provide context for negative oxygen ion readings.
Data can be published on LED screens, multimedia displays, web pages or mobile applications depending on project design.
Buyers should check monitoring points, display method, platform functions, communication, power supply, enclosure protection and report export.
A handheld detector is not enough when the project needs continuous records, public display and platform management.
It makes ecological air data visible, recordable and publishable, helping scenic areas communicate environmental quality with measured data.
Artificial airflow, poor location, temporary interference, weak maintenance and inconsistent measurement points can reduce data reliability.
Acceptance should include live data, platform upload, display screen, historical query, report export and installation position documentation.
Provide scenic area layout, monitoring purpose, display requirements, parameter list, communication conditions and platform user needs.
For a B2B project, documentation is part of the product value. The buyer should keep the product model, installation point, wiring record, communication settings, calibration or inspection method, maintenance interval and acceptance screenshots in one project file.
This documentation helps distributors, system integrators and end users discuss the same technical facts when troubleshooting or expanding the system. It also makes later procurement easier because the original design assumptions are visible.
A quotation should be compared by application fit, not only unit price. Buyers should check whether the supplier has considered the site environment, power supply, communication method, platform requirements, maintenance path and expected service life.
When two proposals use similar product names, the better proposal is usually the one that explains installation, data use and acceptance more clearly. That is the difference between buying a device and buying a usable monitoring point.
Before the negative oxygen ion monitoring system project is accepted, the commissioning team should test power supply, equipment start-up, communication, platform display, alarm response and data storage. If the system includes solar power, battery voltage and working schedule should be checked under real field conditions.
Acceptance should include photos of the installation point, screenshots of platform data, a simple fault simulation and confirmation that the end user knows how to clean, inspect or restart the equipment. These small steps reduce later disputes between supplier, contractor and owner.
Monitoring data should be reviewed on a schedule. Daily values help operators see abnormal events, weekly trends help managers evaluate field operation, and seasonal records help the buyer decide whether more monitoring points or control devices are required.
For IoT projects, the platform should not be treated as only a display screen. It should support historical query, data export, alarm review and equipment management so the buyer can convert field measurements into practical decisions.
Every outdoor monitoring or field-control device needs a named maintenance responsibility. The owner should define who checks cables, who cleans the collection or sensing area, who reviews alarm messages and who contacts the supplier when communication fails.
For distributors and project contractors, providing a maintenance schedule improves customer trust because it shows that the system is designed for long-term operation rather than a one-time installation.
Many projects begin with one monitoring parameter or one field-control device, then expand after the buyer sees stable data. The initial design should therefore keep enough space for additional devices, future 4G gateways, platform users and more monitoring points.
A scalable design is especially useful for agricultural parks, construction groups, scenic areas and municipal platforms because they often start with one pilot area and later copy the configuration to other sites. Clear wiring, naming and data rules make this expansion easier.
Outdoor devices are affected by rain, dust, insects, vibration, sunlight, corrosion, human interference and unstable power. The supplier should explain how the selected equipment handles these conditions, and the buyer should check whether the installation method matches the actual site.
If the monitoring point is remote, the project should also define how faults are reported and how quickly maintenance can arrive. A technically suitable product still needs an operating plan that fits the service distance.
Procurement teams often receive several quotations with similar model names but different project assumptions. A useful technical article helps them ask better questions: what is measured, where it is installed, how data is transmitted, who maintains it and what action follows an alarm.
When those questions are answered before purchase, the project is easier to approve internally and easier to implement on site. This is the practical value of writing the specification around engineering use rather than around product labels alone.
The buyer should confirm spare parts, cable length, mounting accessories, platform account permissions and after-sales response before final purchase. These details are small in the quotation but important during operation.
For repeat projects, the same product configuration should be documented so the next site can be deployed faster with fewer communication mistakes between the supplier and the installation team.
If the project is delivered through a contractor, the end user should also receive a simple operating note that explains daily inspection, alarm meaning, cleaning interval and the correct contact path for service questions.
This note is useful for farms, parks, construction sites and remote monitoring stations because daily operators are often not the same people who selected the equipment during procurement.
Negative oxygen ion monitoring is most valuable when it is integrated with weather, air quality, display and data management. NiuBoL environmental monitoring solutions support scenic areas and smart tourism projects that need visible ecological data.
Related recommendations
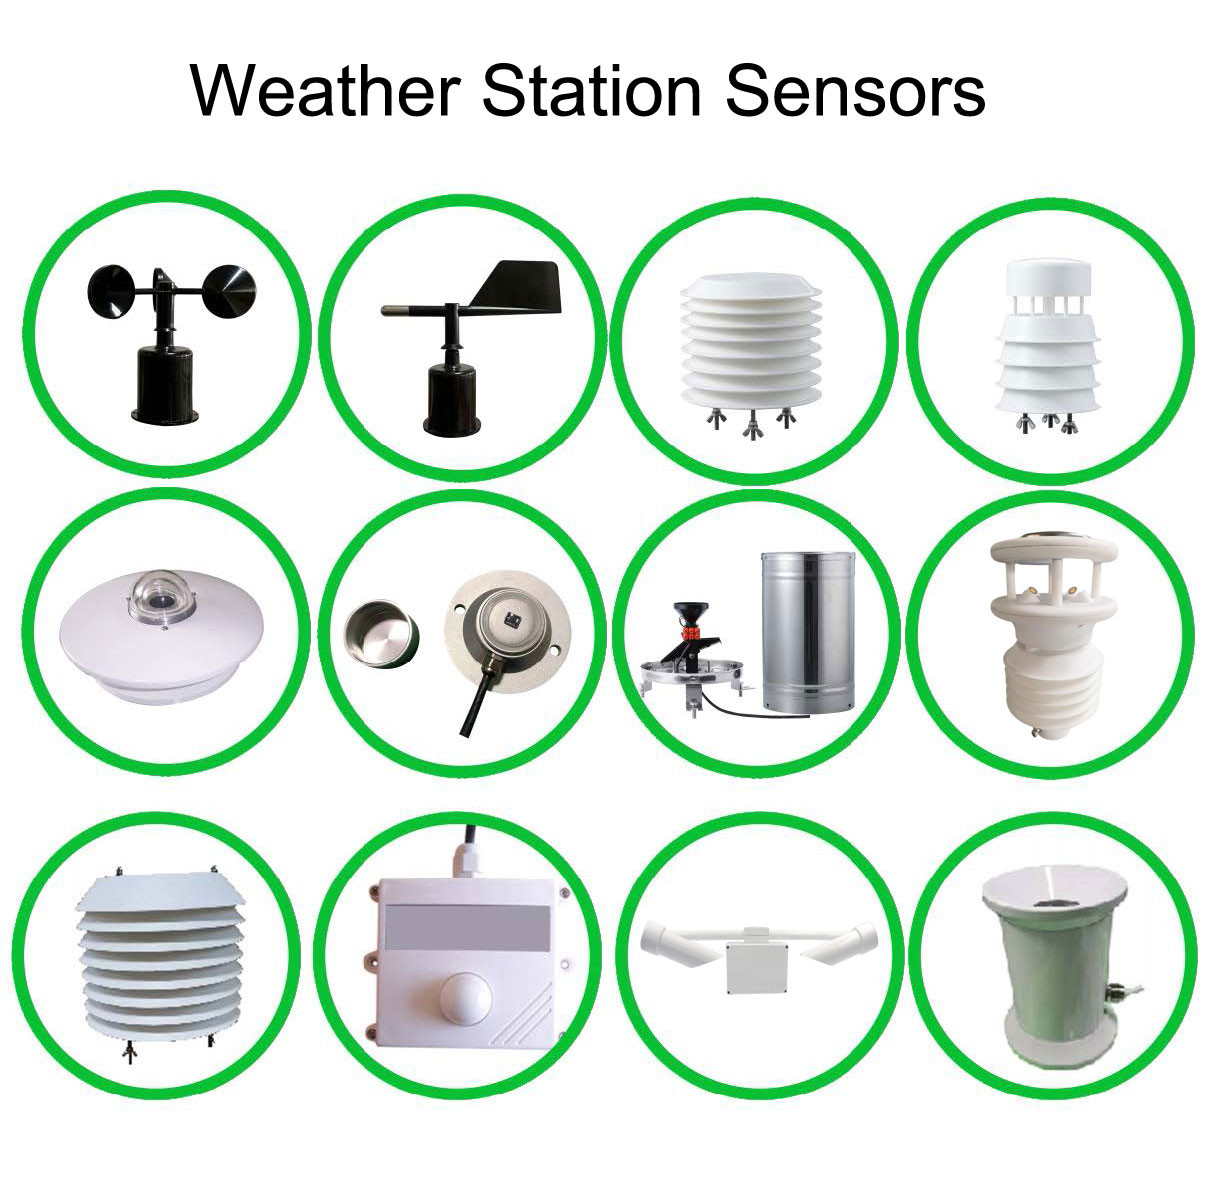
Sensors & Weather Stations Catalog
 Agriculture Sensors and Weather Stations Catalog-NiuBoL.pdf
Weather Stations Catalog-NiuBoL.pdf
Agriculture Sensors Catalog-NiuBoL.pdf
Water Quality Sensor Catalog-NiuBoL.pdf
Related products
 Combined air temperature and relative humidity sensor
 Soil Moisture Temperature sensor for irrigation|NBL-S-THR
 Soil pH sensor RS485 soil Testing instrument soil ph meter for agriculture |NBL-S-PH
 Wind Speed sensor Output Modbus/RS485/Analog/0-5V/4-20mA
 Tipping bucket rain gauge for weather monitoring auto rainfall sensor RS485/Outdoor/stainless steel
 Pyranometer Solar Radiation Sensor 4-20mA/RS485

Screenshot, WhatsApp to identify the QR code
WhatsApp number:+8615367865107
(Click on WhatsApp to copy and add friends)
