


— Blogs —
—Products—
 Consumer hotline +8618073152920
WhatsApp:+8615367865107
Address:Room 102, District D, Houhu Industrial Park, Yuelu District, Changsha City, Hunan Province, China
Product knowledge
Time:2025-09-23 11:02:47 Popularity:984
Quick Answer: Total phosphorus analyzers are useful when a project needs repeated, method-defined phosphorus results without relying on occasional manual tests alone. Their value depends on representative sampling, effective digestion and maintained reagent systems. An online analyzer does not automatically measure every phosphorus fraction, provide an instantaneous result or make a discharge compliant. Select the analytical duty and operating arrangement together.
Total phosphorus, TP, includes phosphorus present in different dissolved and particulate forms within the sample represented by the analytical procedure. A direct orthophosphate result addresses a narrower fraction. If the project needs TP, measuring orthophosphate alone can miss phosphorus associated with other compounds or suspended material.
This distinction matters at a treatment outlet, where a solids breakthrough can carry phosphorus even if dissolved phosphate appears stable. It also matters in a river during runoff. Installing a finer filter to protect an analyzer may improve its apparent reliability while changing the water fraction being measured.
The EPA Method 365.1 description distinguishes phosphorus fractions through sample preparation and digestion. Its colorimetric response is specific to orthophosphate, so pretreatment determines what broader fraction can be reported. This is analytical background, not a statement that a particular NiuBoL instrument is approved for every reporting program.
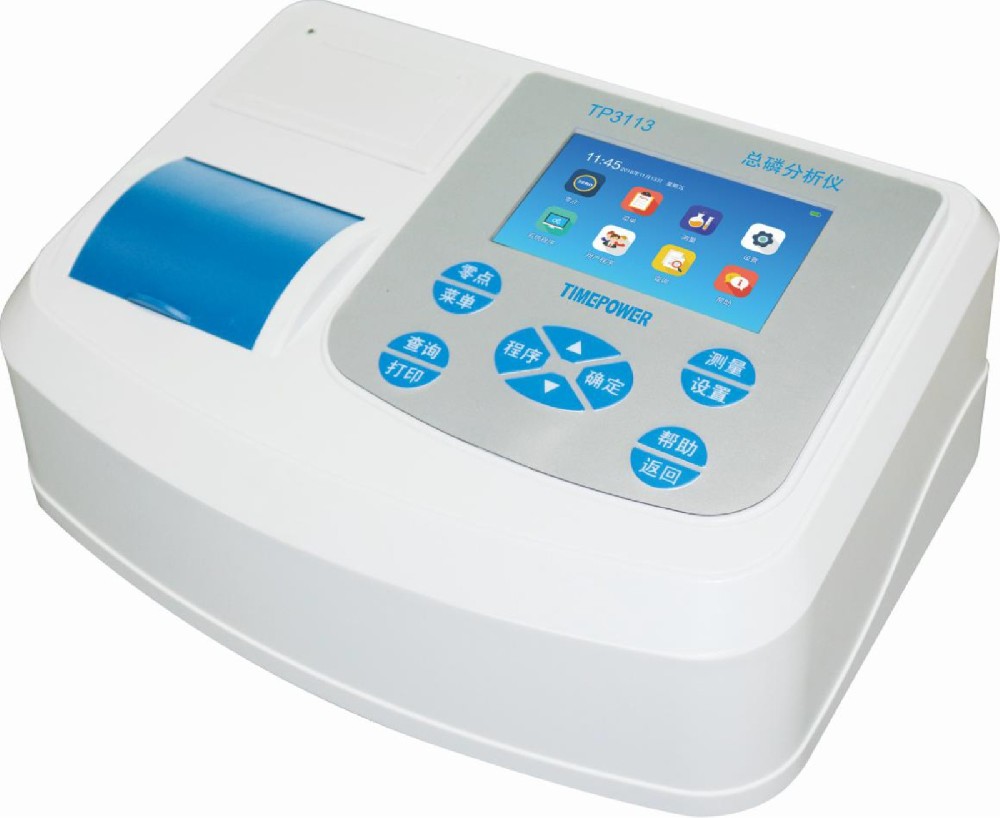
A benchtop instrument, such as the laboratory arrangement illustrated above, and an automatic process analyzer have different duties. The laboratory check includes the appropriate preparation and quality controls. The online installation must also acquire representative water repeatedly and manage its reagents, waste and measurement states.
Online total phosphorus monitoring can show when an effluent changes during production, rain events or solids carryover. Choose a sampling point that represents the defined outlet. Account for sample-line deposits, settling and the fraction retained by any protective screen. Compare the complete installed path with an appropriate reference method rather than checking only a standard poured directly into the analyzer.
The useful result is a time-associated record that prompts investigation or supports the required reporting duty when accepted for that purpose. It is not a guarantee that every short discharge peak will be captured. Sampling cadence, analysis time and outages determine the events that can actually be observed.
For wastewater phosphorus removal, TP and orthophosphate can provide different information. A dosing or biological-treatment decision may need a relatively fast soluble-phosphate observation, while final TP also depends on solids separation. A single TP trend should not be treated as a direct diagnosis of every removal mechanism.
Before closing a chemical-dosing loop, evaluate process delay, mixing and the analyzer's cycle. Repeatedly increasing a dose while waiting for the previous action to appear in the sample can cause overshoot. Use the measurement within a control strategy designed for the treatment process, rather than assigning a universal dose per mg/L of reported phosphorus.
Surface water nutrient monitoring may require low-concentration checks, storm-event samples or depth-specific observations. Select range and sample timing around that question. Phosphorus is relevant to nutrient enrichment, but one TP number does not independently predict an algal bloom or establish the cause of low oxygen.
At a drinking-water source, a nutrient observation is also not a pathogen test or a complete public-health assessment. In aquaculture, combine the nutrient program with the water-condition measurements and sampling needed for the operating decision. An analyzer should answer a defined question rather than complete a standard package of every available parameter.
A typical automated TP sequence draws an aliquot, adds the required reagents, digests the sample, develops a colored reaction product and measures its optical response. It then drains and cleans the fluid path. The exact chemistry and detection wavelength depend on the method and configuration. Do not assign a single blue-color wavelength or fixed digestion recipe to every phosphorus instrument.
Phosphorus digestion must recover the forms that matter in the actual water. A successful orthophosphate calibration confirms the response to that reference under the test conditions; it does not alone demonstrate digestion recovery for particulate or organic phosphorus. Include appropriate actual-water comparisons and quality checks in the acceptance plan.
Color, suspended material, salinity and other constituents can affect sampling or analytical behavior. Dilution may help a selected method, but it also raises the effective reporting limit and introduces its own uncertainty. Treat dilution as a defined procedure, not a universal solution to all interference.
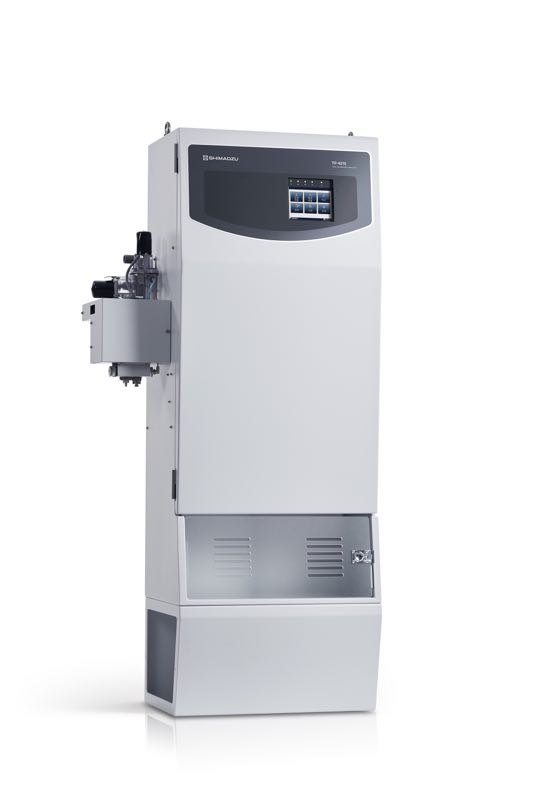
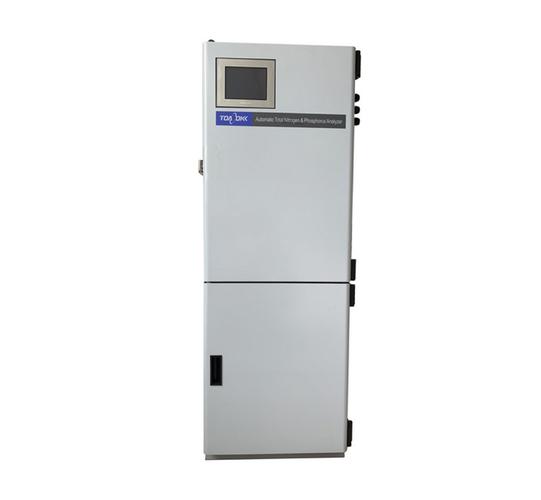
The TP-300C cabinet configuration is an example for a controlled monitoring station. It is not the same installation as an immersed in-situ analyzer. The cabinet photographs illustrate the equipment category; the figures below apply to the selected TP-300C configuration, not to every pictured instrument.
| TP-300C item | Configuration specification | Engineering consequence |
|---|---|---|
| Analytical method | Ammonium molybdate colorimetry with TP digestion | Keep TP and direct orthophosphate modes distinguishable |
| Range options | 0-2, 0-10 or 0-50 mg/L | Select the range against background, action limit and expected peaks |
| Indication error and repeatability | Maximum indication error: +/-5%; repeatability: <=3% | Agree the applicable concentration basis and actual-water checks before defining acceptance |
| Detection limit | 0.01 mg/L | A detection limit is not guaranteed accuracy at a nearby reporting threshold |
| Measurement and sampling cycles | 37-minute measurement cycle; sampling schedule 1-24 hours | Polling more frequently does not produce a new completed analysis each time |
| Sample and analytical waste | 7.5 mL sample per test; 8 mL analytical waste per test | Allow separately for rinsing, calibration and any bypass discharge |
| Power | 220 VAC +/-22 V; 50 Hz +/-0.5 Hz; 150 W power specification | Design the supply for this cabinet, not for a low-power 12 V immersion probe |
| Installation environment | Temperature-controlled indoor location, recommended 5-28 degrees C; RH at or below 90%, non-condensing | Provide suitable station-room conditions; do not treat the cabinet as an immersed IP68 probe |
| Interfaces | RS485, RS232 and USB; two 4-20 mA outputs and two switching input/output channels | Confirm the supplied protocol, channel functions and electrical arrangement |
| Data retention and export | Three years of measurement-data storage; USB export | Verify record coverage, status and export behavior for the operating schedule |
Specify enclosure protection, sample tubing, cable length and jacket requirements for the supplied installation. The controlled indoor temperature recommendation is not the water-temperature range of every connected probe. Do not infer outdoor weather resistance or chemical compatibility from a cabinet's appearance.
A 37-minute analytical cycle is not a 37-minute sampling interval guaranteed under all operating states. Calibration, washing, faults and the configured schedule can delay the next completed result. An analysis is associated with the water aliquot sampled, not necessarily the water currently passing the intake when the result reaches the server.
Consider an illustrative sample path holding 1 L at an actual 0.2 L/min flow. Its nominal hydraulic residence time is five minutes. Adding a 37-minute analysis gives about 42 minutes before other transfer and reporting delays. Actual dispersion and stabilization may extend this. An application requiring immediate shutdown must not rely solely on a delayed TP result without a separately designed protective strategy.
Test this delay from the intake, not just by changing a number in the receiving software. Record sample acquisition, analysis completion and server receipt where supported. A PLC that reads the same completed concentration every minute must not interpret those polls as independent new analyses.
An intake needs protection from debris, but excessive settling or fine filtration can remove material relevant to TP. Decide the permitted sample preparation with the analytical program. Compare the intake and analyzer-feed samples when investigating a systematic low result, especially after a dirty line or filter has been serviced.
In a high-solids or variable industrial stream, confirm that the aliquot entering the digestion system remains representative. A clear-looking feed is not automatically a better total-phosphorus sample. Conversely, forcing unsuitable solids through small valves can cause blockage and invalidate the record. Resolve that trade-off through an appropriate sampling design and actual-water trial.
Use contamination-controlled containers and the required reference-sample handling procedure. A low result from one clean standard does not rule out contamination of sampling bottles or loss within a field intake. Check blanks and carryover as well as the concentration displayed after calibration.
Automated operation reduces repeated manual analytical steps; it does not eliminate analyzer maintenance. Check reagent levels, shelf life, tubing condition, leaks, cleaning performance and standard checks. Keep new and old reagents separate where the procedure requires it, and verify performance after changes. Chemical preparation and service belong with trained personnel using the appropriate protective measures.
At one test per hour, 8 mL of analytical waste per test gives 192 mL/day, or 3.84 L over twenty days. That calculation excludes calibration, rinsing and other liquid streams. It therefore cannot establish a waste-container emptying interval by itself. Provide capacity and spill containment for actual operation, then verify accumulation during commissioning.
Collect analytical waste according to its chemical hazards and the applicable site requirements. Do not assume that a small volume can be discharged to a drain. Separate any sample bypass from reagent-bearing waste where the installation requires different handling.
For an RS485 Modbus RTU integration, obtain the matching protocol and confirm that the delivered controller supports it. RS485 describes the electrical interface and does not by itself prove a particular register map. Identify concentration units, selected range, analysis state, fault indication and the meaning of any remote-start command.
For 4-20 mA, define which channel is mapped to which variable and what happens during cleaning, a failed test or power restart. Do not use an old concentration as a fresh result while the analyzer is unavailable. Remote 4G transmission, a server connection and operator notifications require the appropriate gateway and receiving-system setup; they are not native functions implied by a serial port.
When requesting a NiuBoL quotation, send the intended TP fraction and method, representative water results, expected range, required sampling schedule and station-room conditions. Include sample preparation, reagents, waste handling and commissioning checks in the scope. Those details determine whether a cabinet, an assessed in-situ arrangement or laboratory testing fits the project.
Not without the required preparation and digestion for the intended TP method. Orthophosphate alone does not include every dissolved and particulate phosphorus form.
No. Check blank behavior, calibration, actual-water recovery and uncertainty around the intended decision level. Detectability and a defensible quantitative result are different requirements.
No. This configuration requires a controlled indoor arrangement with the specified power and environmental conditions. An in-situ installation needs a separately suitable analyzer and utility design.
No. The example cabinet has a 37-minute analytical cycle. The receiver must distinguish a new completed result from repeated reads of the previous analysis.
No. A reference standard checks part of the analytical response. The installed sample path, relevant phosphorus forms, digestion and matrix effects still need appropriate verification.
No. Add rinsing, calibration and other contributing streams, then provide suitable capacity and containment. Verify the actual accumulation instead of relying on analytical waste alone.
Test representative intake samples against the chosen reference method, check blanks and standards, measure intake-to-result delay and verify fault handling at the receiver. Confirm the installed operating conditions and service access.
Total phosphorus analyzers add value when their sample, method and time coverage match the project. Evaluate automation together with digestion, utilities and service requirements. A defined NiuBoL configuration and an actual-water acceptance trial provide a sounder procurement basis than generic promises of fast, maintenance-free nutrient monitoring.
Prev:Multi-Parameter Water Quality Sensors: Modules, Shared Services and Limits
Next:Total Phosphorus Analyzer Working Principle: Digestion to a Valid Result
Related recommendations
Sensors & Weather Stations Catalog
 Agriculture Sensors and Weather Stations Catalog-NiuBoL.pdf
Weather Stations Catalog-NiuBoL.pdf
Agriculture Sensors Catalog-NiuBoL.pdf
Water Quality Sensor Catalog-NiuBoL.pdf
Related products
 Combined air temperature and relative humidity sensor
 TDR Soil Moisture & Temperature Sensor for irrigation| RS485 |4-20mA| NBL-S-THR
 Soil pH sensor RS485 soil Testing instrument soil ph meter for agriculture |NBL-S-PH
 Wind Speed sensor Output Modbus/RS485/Analog/0-5V/4-20mA
 Tipping bucket rain gauge for weather monitoring auto rainfall sensor RS485/Outdoor/stainless steel
 Pyranometer Solar Radiation Sensor 4-20mA/RS485


Screenshot, WhatsApp to identify the QR code
WhatsApp number:+8615367865107
(Click on WhatsApp to copy and add friends)