





— Blogs —
—Products—
 Consumer hotline +8618073152920
WhatsApp:+8615367865107
Address:Room 102, District D, Houhu Industrial Park, Yuelu District, Changsha City, Hunan Province, China
Product knowledge
Time:2026-02-15 10:04:34 Popularity:688
Agricultural four-condition monitoring combines soil-water observations, crop-growth records, pest observations and local weather information. The useful result is a clearer field decision, not four equipment icons on one screen. For a NiuBoL farm project, first establish what each module can actually observe, which conclusions need interpretation and where field inspection remains necessary. A moisture probe does not diagnose a disease, and a crop photograph does not measure root-zone water content.
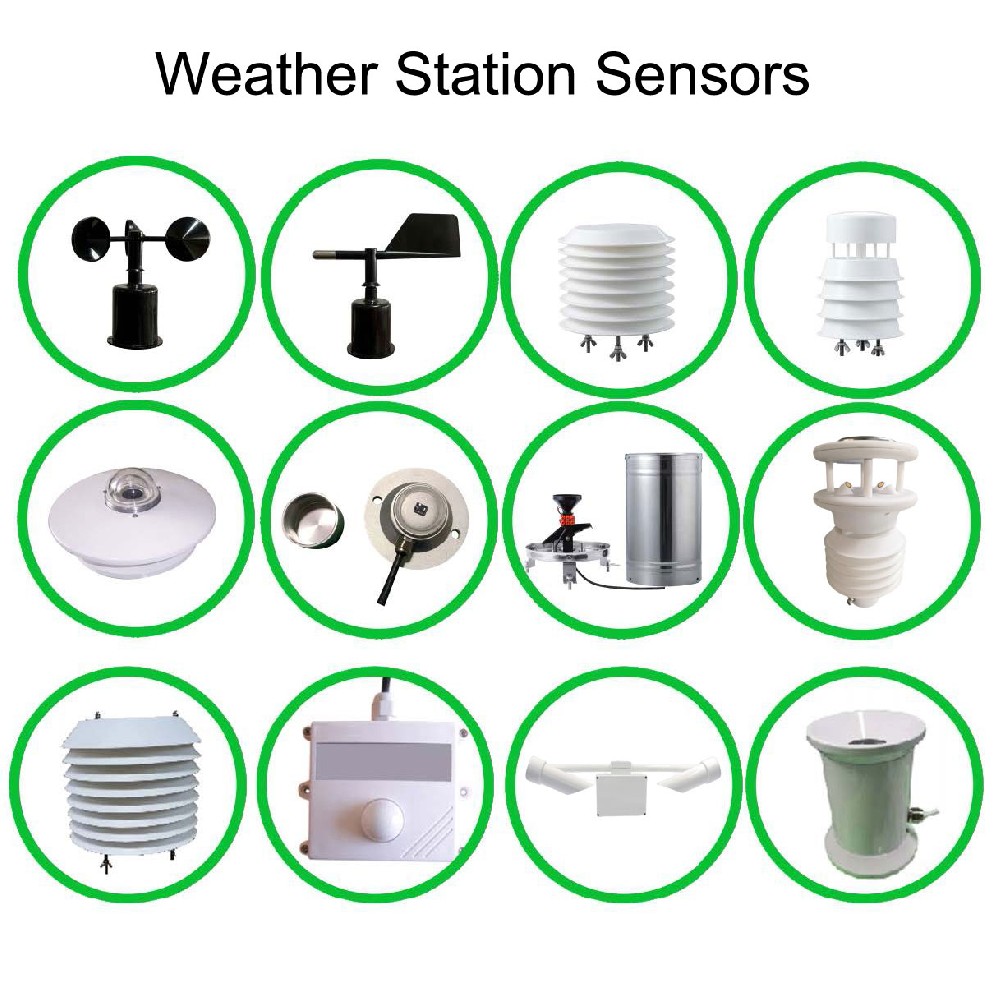
The term covers several information streams rather than one standard sensor with a shared accuracy. A practical project can use the four roles below to compare proposed equipment. Different crops and management questions may require different instruments within each role; there is no requirement to buy an identical package for every field.
| Module | Direct evidence | Further interpretation |
|---|---|---|
| Soil-water condition | Selected soil-water quantity at identified depths and positions | Root-zone availability and irrigation need depend on soil, roots and the chosen method |
| Crop growth | Images or other specified observations of the crop | Disease cause, nutrient deficiency and growth indices need appropriate checks or validated analysis |
| Pest condition | Captured specimens, images and reviewed counts for the selected trap | Field damage and treatment need require crop and pest-specific assessment |
| Weather and environmental stress | Local temperature, humidity, wind, rain or irradiance channels as ordered | Forecasts and crop-risk calculations require defined models and additional information |
Keep this distinction in the equipment schedule. An attractive dashboard can display several derived quantities without adding a new measurement. Ask where each value originates and what observation supports it. A value calculated from other channels should remain identifiable as calculated, rather than appearing as an independent sensor result.
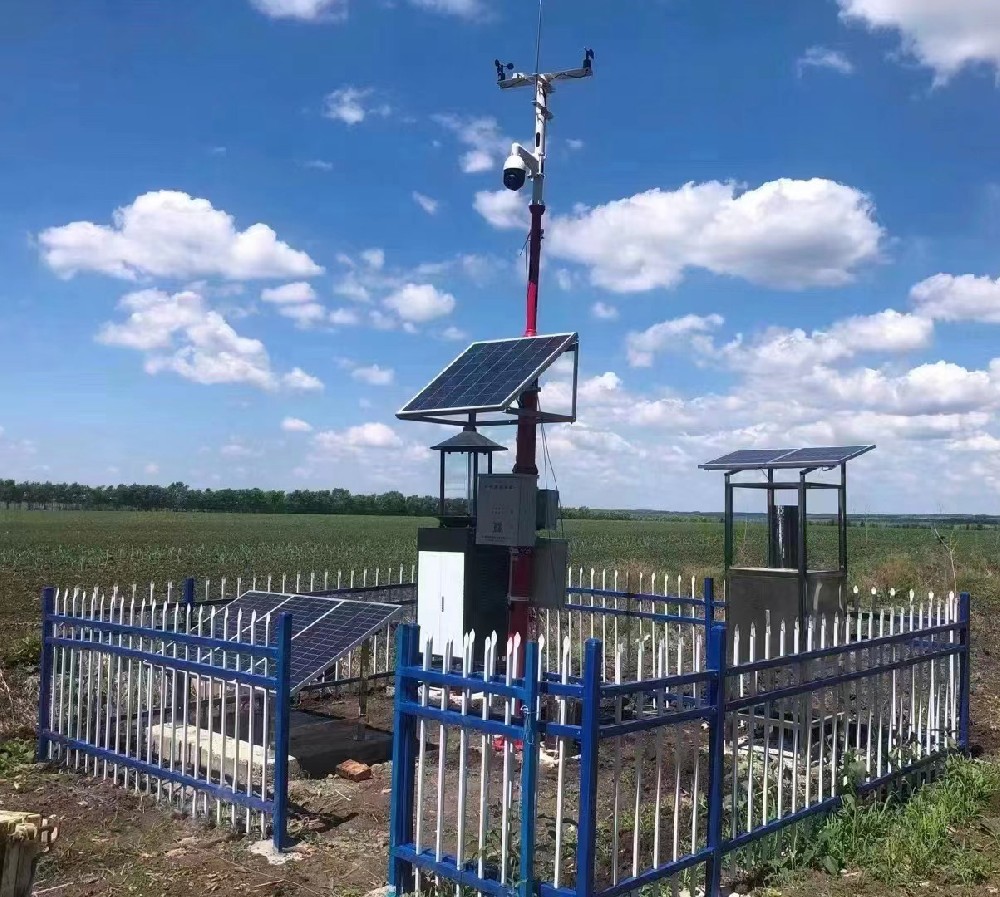
A soil moisture profile can show how water changes at several depths after irrigation or rain. It does not automatically represent every soil zone or irrigation block. Record the sensing depths from the local surface, the soil zone and the probe's position relative to the crop and water application. A sensor immediately beside an emitter answers a different question from one between emitters.
Distinguish volumetric water content from water potential and from a percentage of field capacity. For an illustrative calculation, a volumetric water content of 0.24 m3/m3 is 24% VWC. It is not automatically 24% of field capacity. If an accepted site value for field capacity were 0.30 m3/m3, the simple ratio would be 80%; that ratio is still not a complete measure of plant-available water.
Do not assume that a moisture instrument also measures pH, EC or nutrients. Those require identified channels and methods. Where the project needs an irrigation trigger, establish the threshold through the selected soil-water method and crop management plan. A generic percentage copied from another soil can cause incorrect operation even when the instrument is functioning.
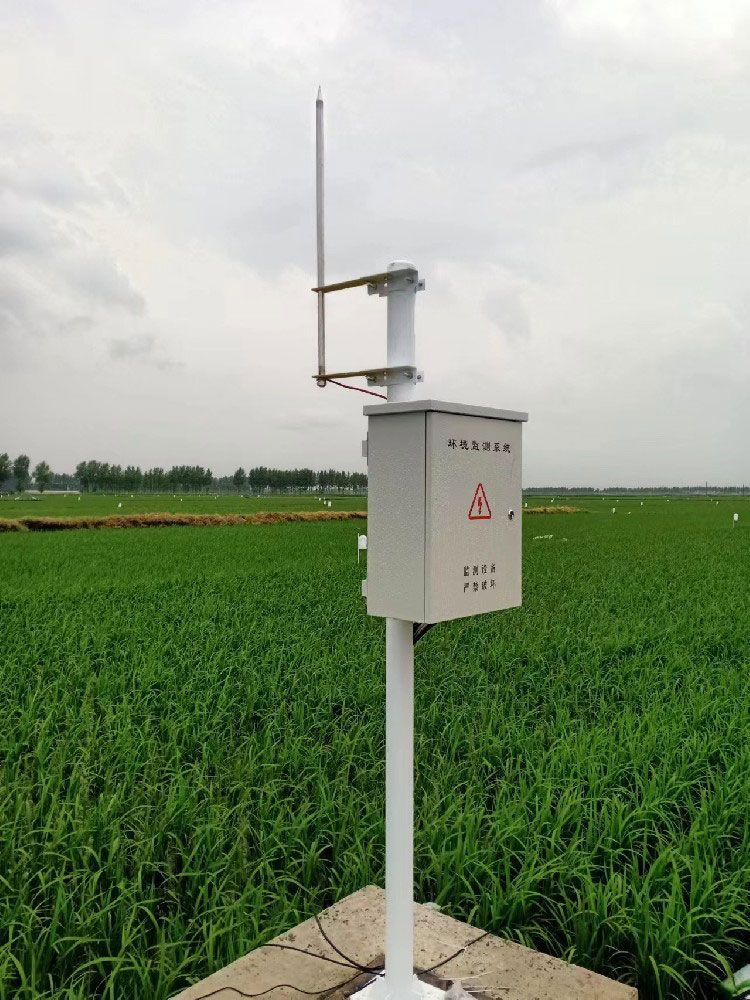
A fixed camera can document emergence, canopy development, lodging or a visible change in a defined view. Its usefulness depends on repeatable framing, focus and lighting. Keep the crop area and image scale identifiable; moving or zooming a camera can change the apparent canopy coverage without any biological change.
Yellow leaves can have several causes, including water stress, nutrient problems, pests and disease. Use the image to direct inspection and sampling rather than naming the cause from appearance alone. A camera does not become a calibrated plant-height, leaf-area-index or chlorophyll instrument simply because an analysis option is mentioned in a proposal.
For a research project that requires a numerical growth index, request the method, reference observations and validation conditions. For a farm manager who only needs repeatable visual inspection, a simpler photographic record may be sufficient. Match the purchase to that requirement instead of adding analysis claims that cannot be tested.
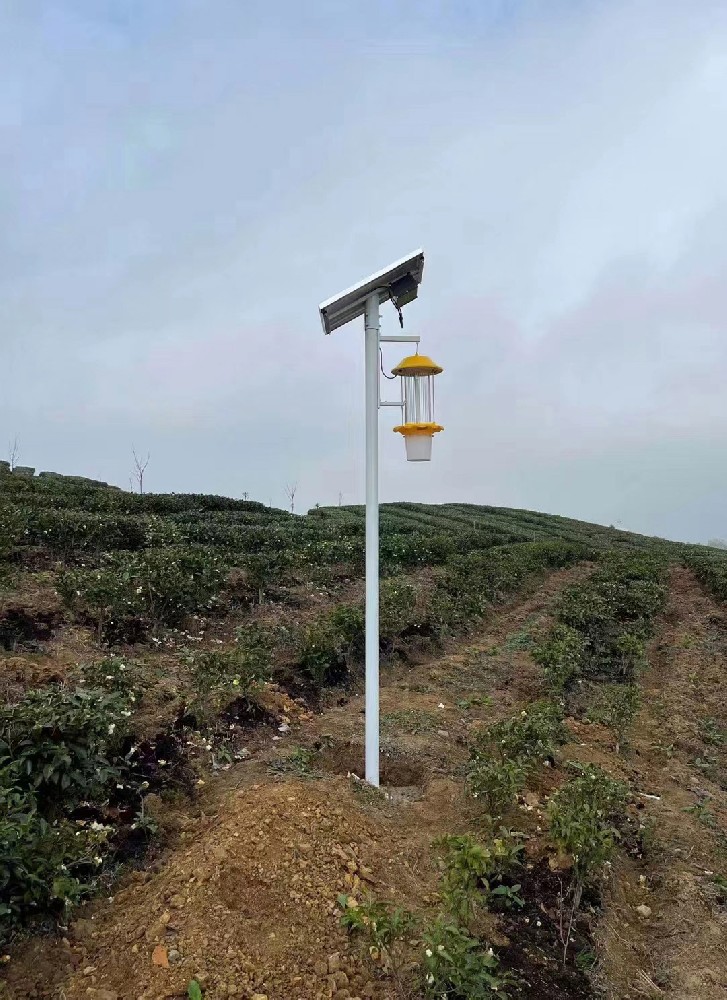
A light-based monitoring cabinet processes attracted insects for images and review. A solar insect trap intended for suppression has a different operating purpose. The illustrated equipment types should not be treated as interchangeable just because both use a lamp. A reduction in insects at one capture point is not by itself proof of reduced damage across a crop.
The NBL-IoT-SRPMS remote insect monitoring system uses light attraction, infrared processing and image acquisition. Its role in this project is an insect-observation stream. Verify the target species and review process for the local crop; do not assume that it identifies plant pathogens, monitors rodents or guarantees a forecast several days ahead.
A rise in adult trap counts can justify targeted scouting, but treatment still depends on the relevant pest, crop stage and field evidence. Similarly, the absence of an insect in a trap does not prove its absence from the field. Use the monitoring record alongside an appropriate plant-protection procedure rather than connecting a generic count directly to spraying.
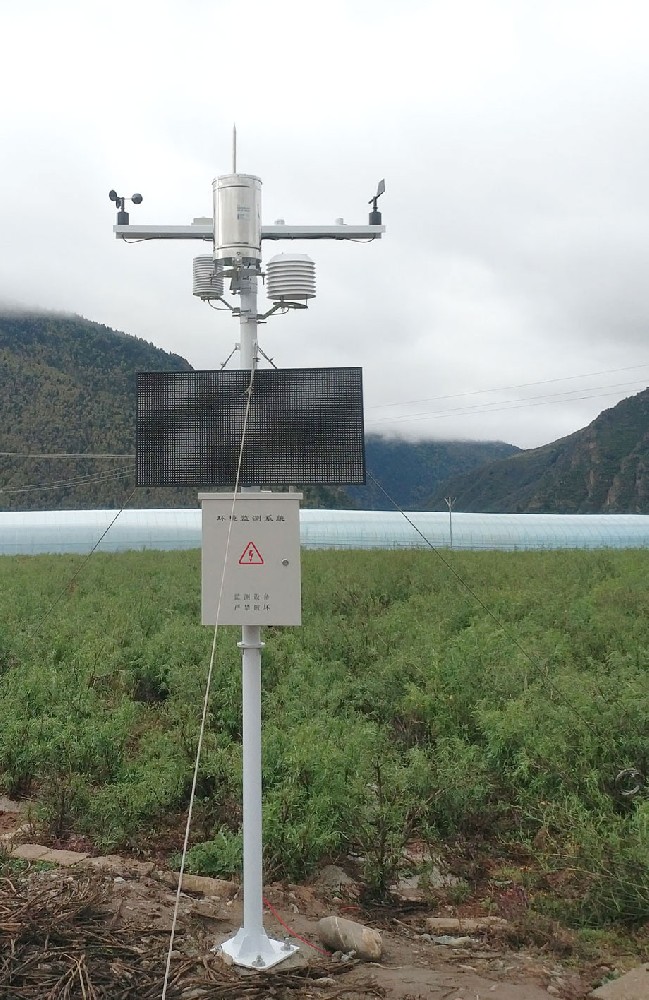
Temperature and humidity can support local environmental assessment. Rainfall describes precipitation at the gauge, not standing water across the field. Solar irradiance and illuminance are different light quantities. Select the channels required by the intended calculation rather than asking for an undefined number of weather elements.
| Component example | Relevant specification | Use in the project |
|---|---|---|
| NBL-W-LBTH temperature | -40 to 80 C; +/-0.5 C; resolution 0.1 C | Air-temperature observations at the identified exposure |
| NBL-W-LBTH humidity | 0-100% RH; +/-5% RH; resolution 0.1% RH | Atmospheric moisture context, not direct leaf wetness |
| Selected LBTH digital configuration | DC 12-24 V; RS485 Modbus RTU | Local connection to a compatible acquisition device |
| NBL-IoT-SRPMS imaging | 12-megapixel industrial camera; 4G/Ethernet reporting | Insect image records, with identification performance assessed separately |
| Separate NBL-W-SS and NBL-W-DS instruments | IP65; ordered output to be specified | Wind channels where the management question requires them |
The NBL-W-LBTH air sensor is one component example, not a station-wide accuracy statement. A forecast of crop frost, evapotranspiration estimate or disease-risk indicator needs its own input requirements and method. CO2 concentration and incoming light alone do not directly measure crop photosynthetic rate.
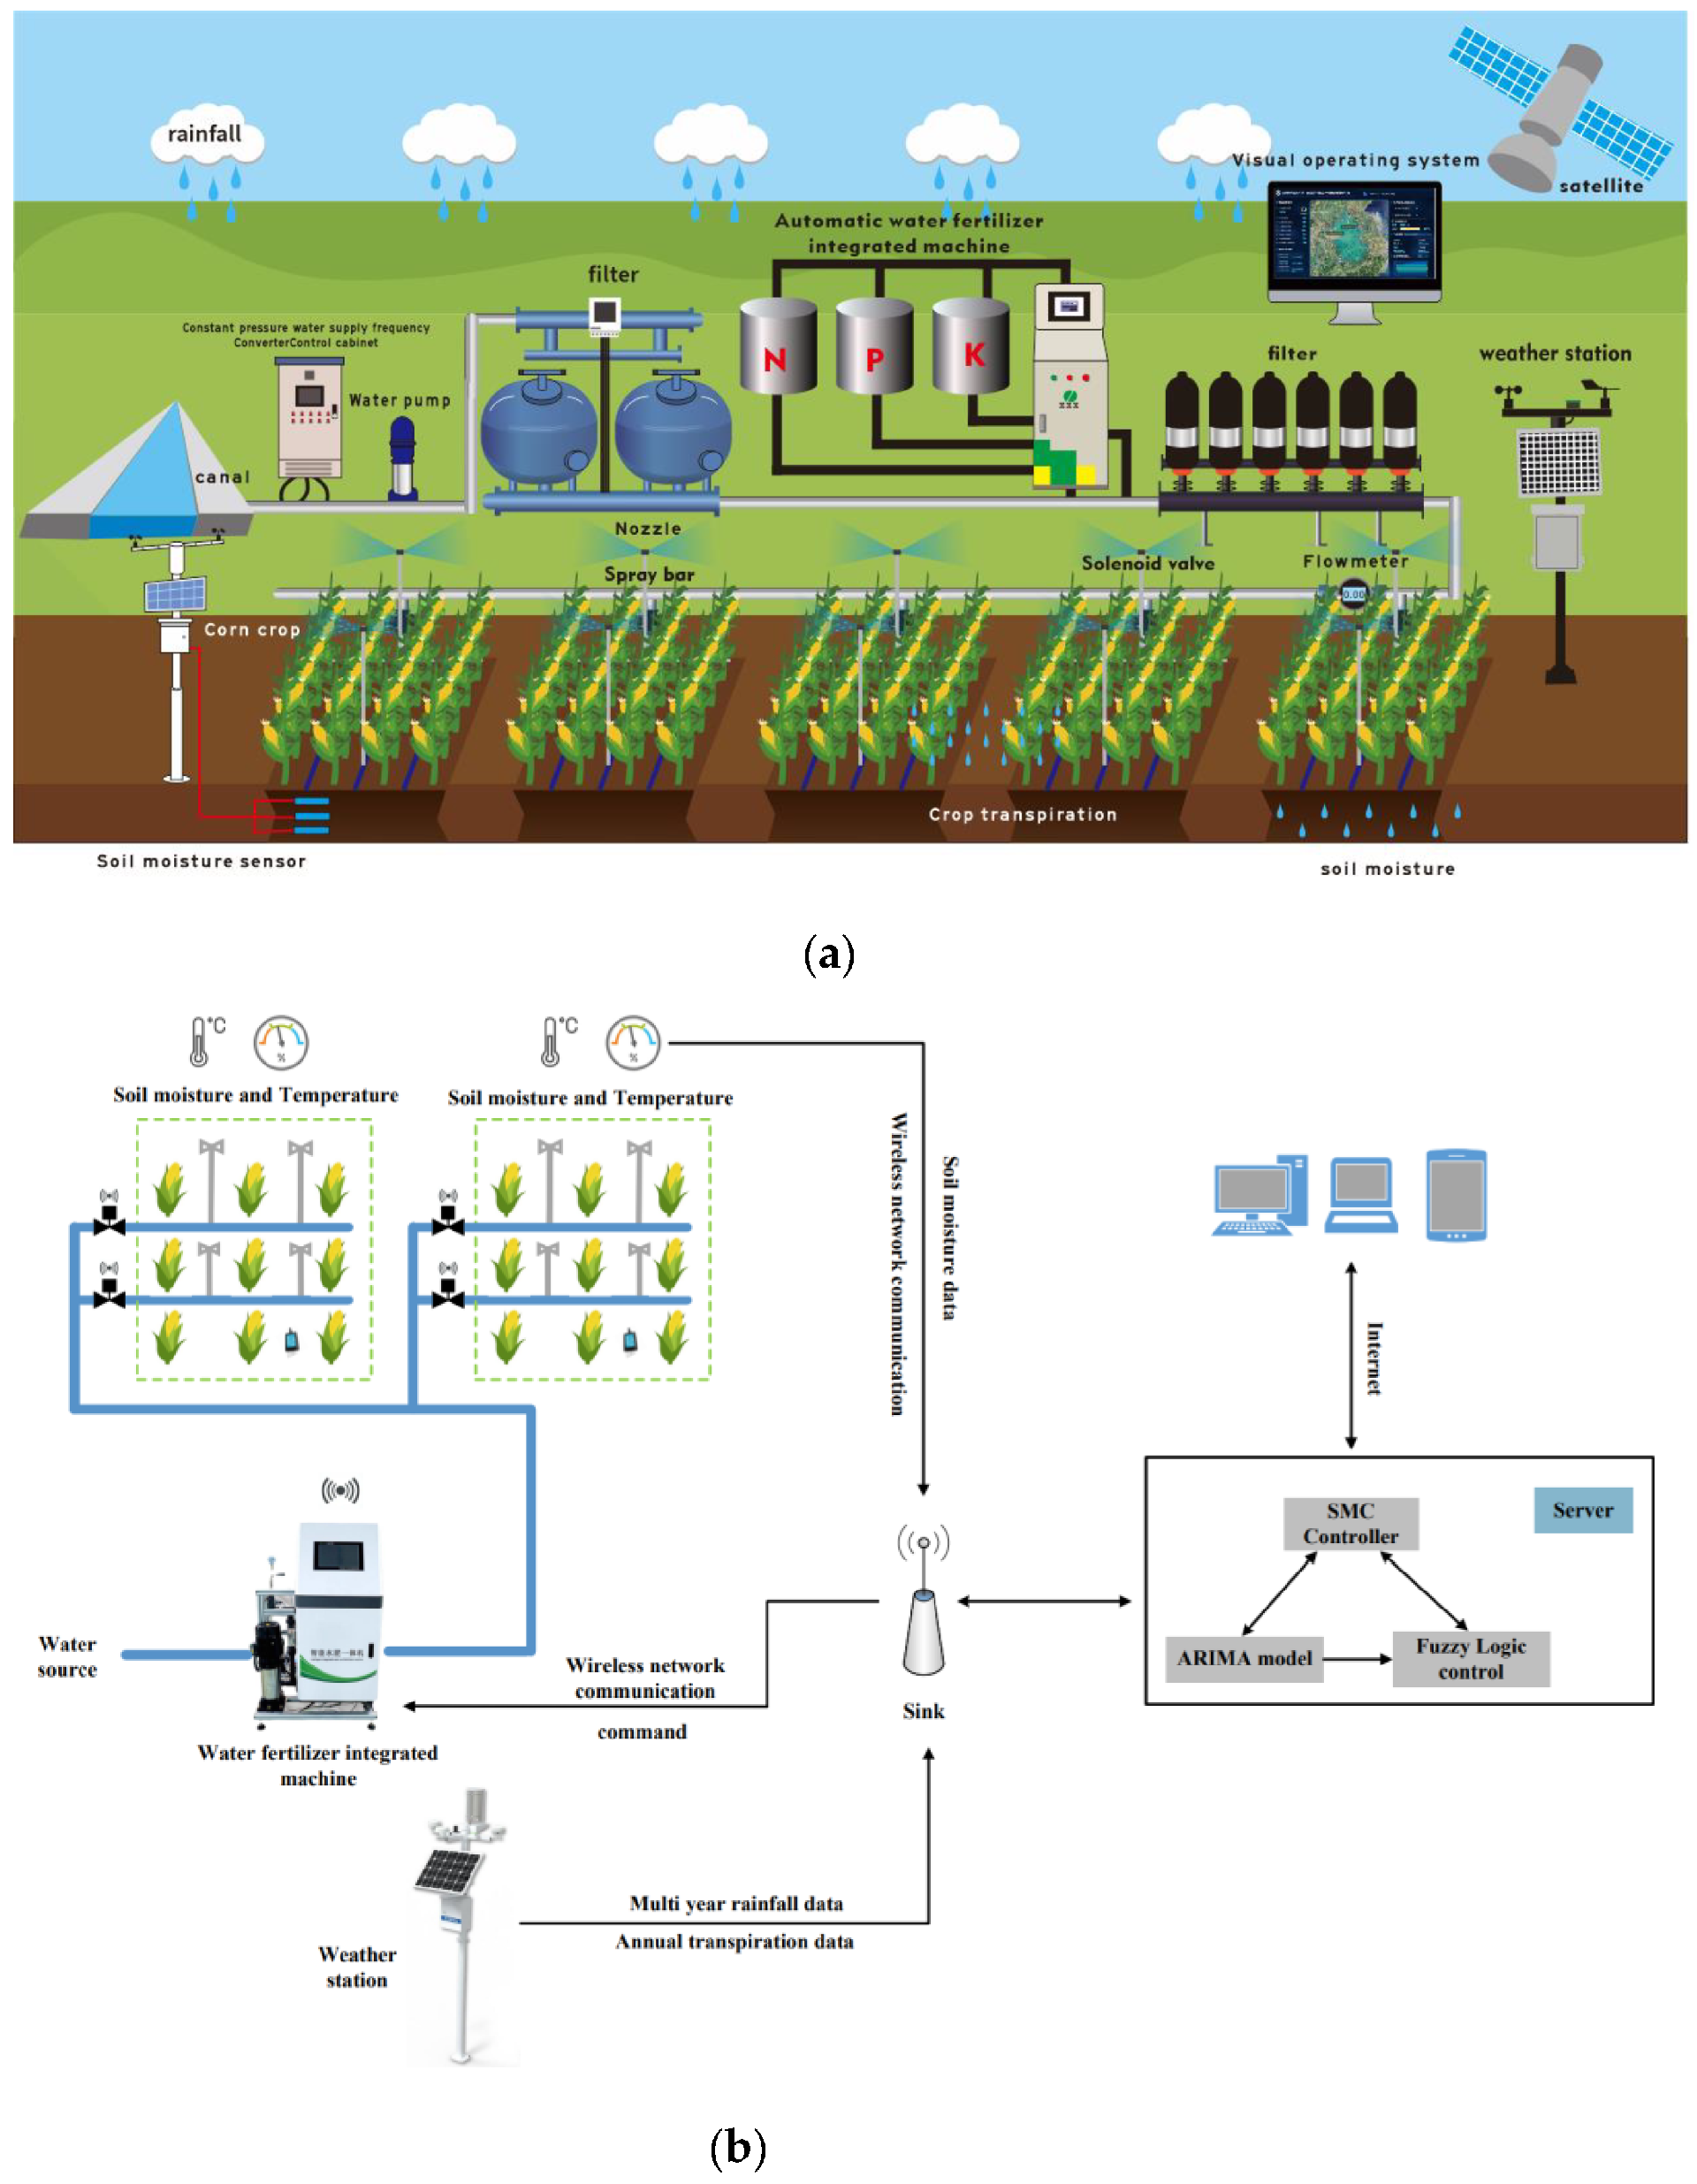
During a pilot, ask the team to answer one real question with each module. Can the soil record distinguish an irrigation response at the monitored depths? Can the camera show the same crop area clearly on successive dates? Can an insect count be traced to a sample image? Can the weather feed distinguish a valid low value from a disconnected instrument?
Then investigate a disagreement between modules without forcing a single diagnosis. A wet soil reading and wilted plants may reflect a local wet spot, root problems or an unrepresentative position. High trap activity with little crop damage may concern a different life stage or capture area. The value is in directing a better field check, not making every observation confirm the same automatic conclusion.
Test the actual interfaces as separate data paths. RS485 Modbus RTU can carry selected numerical sensor values, while images and cabinet reports may use a different transfer mechanism. Reserved RS485/RS232 ports do not establish an image-transfer format or a ready-made driver. Require the offered data definitions and a demonstration with the intended receiving system.

If the farm already has reliable weather observations, a soil profile or repeatable crop images may provide more new information than another weather head. If the priority is a particular insect, establish that the proposed trap and review workflow suit that target before buying a general monitoring package. Expansion should address an identified gap.
For a NiuBoL enquiry, send the crop, management questions, existing instruments and field zones. Identify the quantities or records that must be delivered, and specify whether numerical analysis or manual review is expected. Compare equipment, acquisition, image reporting and field verification as separate items. This makes the proposal assessable without inventing uniform yields, savings or service life.
No. It describes four information roles. A module may contain several instruments, and a project can start with the roles that address its current management questions.
Only after defining the measured quantity and the relevant soil and crop conditions. VWC, water potential and percentage of field capacity are different values and cannot share one unexplained threshold.
They can reveal visible symptoms and guide inspection. A reliable diagnosis may require expert assessment or testing; the photograph alone does not identify every cause of similar symptoms.
Not through its insect images alone. Disease monitoring requires an appropriate observation or test method. Do not substitute a light-trap count for pathogen identification.
Not automatically. Numerical sensors, images and monitoring cabinets can have different interfaces. Confirm each data path, available definitions and receiving software before agreeing the integration scope.
It should produce usable, traceable observations for the selected farm questions and demonstrate how staff investigate uncertain results. A screen showing four online icons is insufficient evidence.
Agricultural four-condition monitoring works when each module supplies a distinct, useful observation. NiuBoL component selection should follow the farm's missing information: soil-water measurements, repeatable crop views, reviewed insect records or local weather channels. Keeping measurement separate from diagnosis makes the system easier to evaluate and use.
Prev:Weather Inputs for Dynamic Line Rating: Wind Angle and Data Validity
Next:Remote Pest Forecasting Device and Solar Insect Trap: Project Roles
Related recommendations
Sensors & Weather Stations Catalog
 Agriculture Sensors and Weather Stations Catalog-NiuBoL.pdf
Weather Stations Catalog-NiuBoL.pdf
Agriculture Sensors Catalog-NiuBoL.pdf
Water Quality Sensor Catalog-NiuBoL.pdf
Related products
 Combined air temperature and relative humidity sensor
 TDR Soil Moisture & Temperature Sensor for irrigation| RS485 |4-20mA| NBL-S-THR
 Soil pH sensor RS485 soil Testing instrument soil ph meter for agriculture |NBL-S-PH
 Wind Speed sensor Output Modbus/RS485/Analog/0-5V/4-20mA
 Tipping bucket rain gauge for weather monitoring auto rainfall sensor RS485/Outdoor/stainless steel
 Pyranometer Solar Radiation Sensor 4-20mA/RS485


Screenshot, WhatsApp to identify the QR code
WhatsApp number:+8615367865107
(Click on WhatsApp to copy and add friends)

