





— Blogs —
—Products—
 Consumer hotline +8618073152920
WhatsApp:+8615367865107
Address:Room 102, District D, Houhu Industrial Park, Yuelu District, Changsha City, Hunan Province, China
Product knowledge
Time:2025-09-27 16:42:42 Popularity:1028
Soiling monitoring for Middle East solar plants is useful when it helps an operator decide whether, where and when to clean. The NiuBoL NBL-W-PSS measures the optical effect of contamination on its sensing glass and communicates through RS485. Use that local indication with plant performance, cleaning access and water availability. It is not a direct measurement of every module's energy loss.

A reduction in plant output can follow lower irradiance, higher module temperature, clipping, curtailment, equipment faults or surface contamination. Cleaning is relevant to only some of these causes. Compare the time of the change with irradiance and operating records before sending a crew to wash an array. A soiling instrument adds an independent observation of surface condition to that investigation.
For a desert project, describe the dust source and cleaning method rather than specifying equipment from a regional label alone. Deposits near an unpaved road can differ from deposits farther inside the plant. Humidity, occasional rainfall and the way modules are cleaned can change how contamination remains on glass. Local measurements should be evaluated against the actual modules and maintenance routine.
The NBL-W-PSS soiling sensor uses blue-light optical measurement to assess contamination on glass. It is a different measurement from airborne PM2.5 or PM10 concentration. Dust passing through an air-sampling chamber does not directly indicate the deposit on a tilted module, and a glass soiling indication does not describe the chemical composition of the dust.
| NBL-W-PSS item | Specification | Meaning for the plant |
|---|---|---|
| Supply | DC 12 V | Provide a regulated supply suitable for the installed cable and enclosure. |
| Output and communication | RS485; standard Modbus; 9600 bps | Confirm the supplied register definition and serial configuration with the receiver. |
| Average power | 1 W | Continuous operation represents approximately 24 Wh/day for the sensor alone. |
| Ratio measurement range | 50-100% | Verify the register's meaning, scale and clean baseline before assigning a loss label. |
| Ratio accuracy | +/-1% at 90-100%; +/-3% at 80-90%; +/-5% at 50-80% | The stated accuracy varies across the range; it is not a universal +/-0.5% specification. |
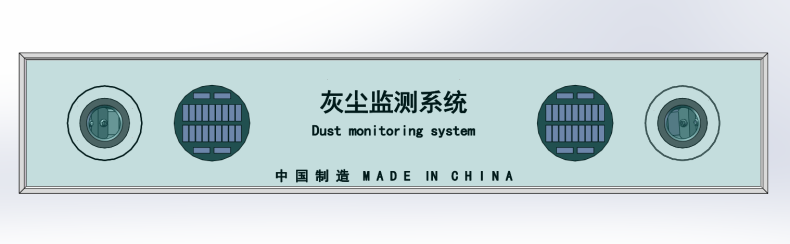
| Dimensions | 907 x 170 x 40 mm | Check frame space, brackets and service access before selecting the mounting point. |
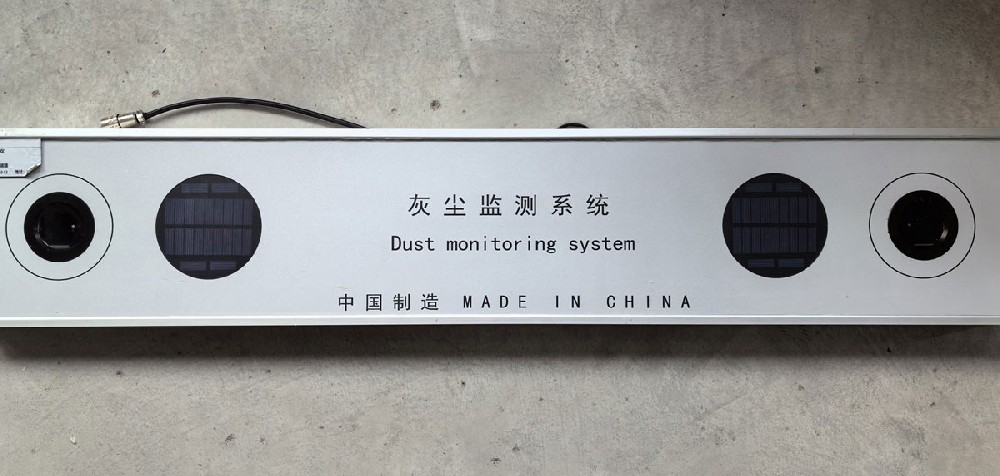
Agree what each returned value represents, including any separate sensing channels, scaling and invalid-value codes. Then clean the sensing surfaces, complete the specified calibration procedure and compare the resulting values at the data logger and SCADA display. A displayed percentage is ambiguous until the team knows whether it represents a retained optical ratio, a loss or another defined quantity.
Do not label a value of 95 as 95% dust coverage merely because a register contains a percentage. Keep the clean check and calibration time with the instrument record. Review the trend through a genuine accumulation and cleaning cycle before using it to schedule work. If values behave unexpectedly, inspect the glass, mounting and data interpretation before changing a plant-wide threshold.
Install the sensor in the same plane as the modules it is intended to represent, with exposure appropriate to that array. A unit sheltered under a frame or washed more often than surrounding modules will develop a different contamination history. Keep the mounting clear of shading and unintended runoff, and obtain approval for attachments to the module or support structure.
For plants with different tilt angles, cleaning schedules or dust exposures, evaluate whether separate monitoring points are needed. One instrument cannot establish that every row has the same surface condition. Start with the zones that can be cleaned independently and compare nearby module condition. Add instruments where a distinct exposure changes the cleaning decision, rather than using a fixed number per megawatt.
A cleaning decision should consider the expected recoverable energy before the next planned intervention or likely effective rainfall. The relevant cost includes mobilisation, labour, equipment, water supply and any operational restriction. The energy estimate must also account for the plant's ability to export or use the additional production. A curtailment period changes that calculation.
For illustration, a block expected to produce 5000 kWh/day without soiling, with an independently supported 2% recoverable loss over five days, represents 500 kWh of potential recovery. This is a calculation example, not an NBL-W-PSS performance claim or a prediction for a Middle East site. The operator must establish the loss relationship and financial assumptions for the actual block.
Do not adopt a universal 2-5% cleaning trigger. Different cleaning costs, export values, water constraints and access windows can produce different decisions at the same optical indication. Where several blocks are affected, the instrument can help prioritise an inspection or cleaning sequence without claiming that a single ratio determines the economically correct action.
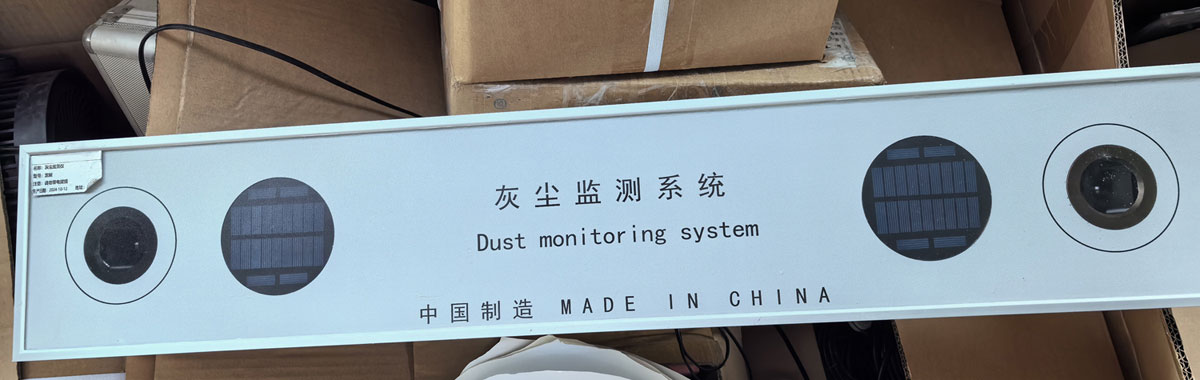
Clean both sensing areas as part of the module-cleaning procedure so their histories remain comparable. Record the start and end of the work. Cleaning the sensor alone can create an apparent improvement while the array remains dirty; cleaning the array but leaving the sensor contaminated can create the opposite impression.
Inspect representative modules and review performance under comparable irradiance and operating conditions after the job. A change in the sensor is useful feedback, but it does not verify every module or prove the energy recovered by the contractor. Keep observations of incomplete coverage, residue or new contamination with the cleaning record.
Use the selected RS485 Modbus RTU configuration and register map to connect the instrument to a compatible logger or PLC. Verify units, scale and timestamps at the receiving system. Define how missing or invalid readings appear so an old clean value does not remain displayed as a current observation after a communication fault.
RS485 is the local instrument connection, not a promise of an included radio, solar supply or cloud service. Specify those separately if required. For an off-grid assembly, add logger and communication loads to the sensor's approximately 24 Wh/day before calculating battery reserve and charging requirements. Describe high ambient temperature, enclosure exposure and cable routing for a site-specific configuration review.
No. It observes the optical effect of contamination on sensing glass. PM concentration and deposited soiling answer different questions. Select the PSS for array-surface monitoring, and use a separate suitable particle instrument if ambient dust concentration is also required.
No. Its observation is local and needs comparison with the modules and plant operating records. Different cleaning zones, orientations and dust exposures may need separate assessment. Do not multiply one local indication across the plant without validating that relationship.
The ratio accuracy is range-dependent: +/-1% in the 90-100% band, +/-3% in 80-90%, and +/-5% in 50-80%. Clarify the required measurement range and interpretation with NiuBoL. These figures do not establish the same uncertainty for a calculated plant energy-loss estimate.
Coordinate cleaning of both sensing areas with the represented modules and keep a dated record. Unscheduled cleaning of the sensor alone changes the comparison. Follow the applicable calibration procedure after installation or when a check indicates it is needed.
Provide array tilt and mounting details, independently cleaned zones, dust exposure, supply, cable length and receiving equipment. State any remote communication or power-system requirement separately. Include the proposed cleaning method so brackets and service access can be reviewed.
Soiling monitoring for Middle East solar plants should make cleaning decisions more specific, not attach a guaranteed saving to a percentage. Match the NiuBoL NBL-W-PSS exposure to the modules, verify its ratio interpretation and compare trends with real cleaning and production records before expanding the installation.
NBL-W-PSS technical datasheet:
 NBL-W-PSS Soiling Sensor Photovoltaic Dust Monitoring Instrument Data Sheet.pdf
Prev:Coastal Flood Monitoring: Combine Water Levels, Rainfall and Weather
Next:Environmental Sensors for Mining: Dust, Weather and Water Monitoring Limits
Related recommendations
Sensors & Weather Stations Catalog
Agriculture Sensors and Weather Stations Catalog-NiuBoL.pdf
Weather Stations Catalog-NiuBoL.pdf
Agriculture Sensors Catalog-NiuBoL.pdf
Water Quality Sensor Catalog-NiuBoL.pdf
Related products
 Combined air temperature and relative humidity sensor
 TDR Soil Moisture & Temperature Sensor for irrigation| RS485 |4-20mA| NBL-S-THR
 Soil pH sensor RS485 soil Testing instrument soil ph meter for agriculture |NBL-S-PH
 Wind Speed sensor Output Modbus/RS485/Analog/0-5V/4-20mA
 Tipping bucket rain gauge for weather monitoring auto rainfall sensor RS485/Outdoor/stainless steel
 Pyranometer Solar Radiation Sensor 4-20mA/RS485


Screenshot, WhatsApp to identify the QR code
WhatsApp number:+8615367865107
(Click on WhatsApp to copy and add friends)

