

— Blogs —
—Products—
 Consumer hotline +8618073152920
 WhatsApp:+8615367865107
Address:Room 102, District D, Houhu Industrial Park, Yuelu District, Changsha City, Hunan Province, China
Product knowledge
Time:2023-04-15 20:59:13 Popularity:3144
Quick Answer: Soil NPK sensor integration requires both a controlled sampling method and a verified data connection. A functioning RS485 link establishes that values can be acquired, not that a reading equals a laboratory nutrient test or a fertilizer prescription. Validate repeatability and the intended field relationship before using the observations for management.
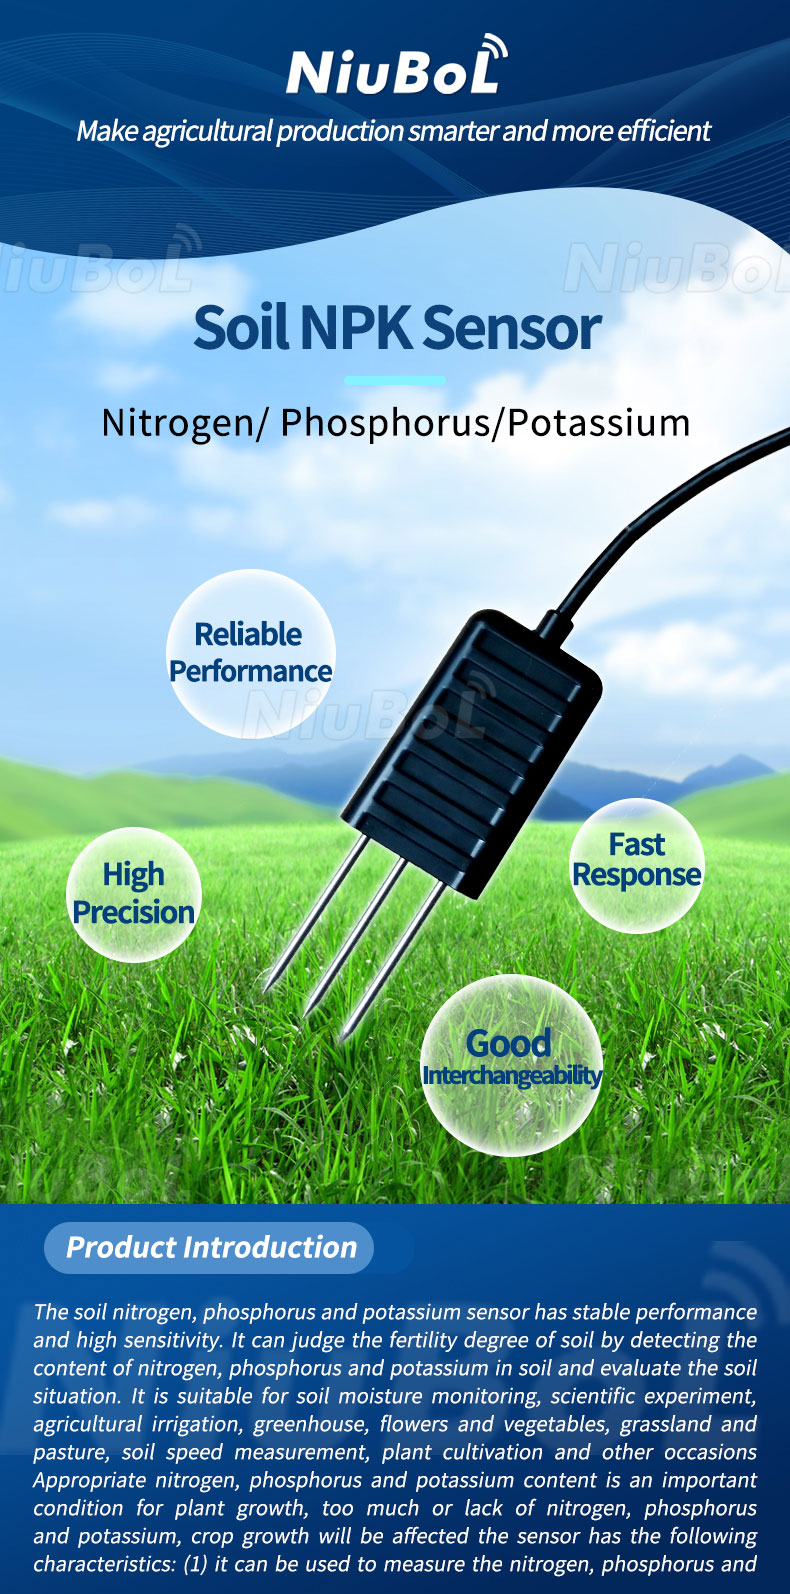
In field projects, an in-situ NPK sensor can increase measurement frequency and reveal relative changes between monitored zones. Its result is affected by soil contact, moisture, salinity, texture, temperature and the product's measurement method. It should not be described as a universal replacement for laboratory extraction and chemical analysis.
First ask whether the device is communicating correctly. Then ask whether repeated measurements are consistent under the chosen field method. Finally, ask whether those observations support the intended nutrient decision. Passing the first question does not establish the second or third.
For a distributor or system integrator, this distinction changes project acceptance. A bench test can confirm supply, addressing, channel values and scaling. A field comparison evaluates the measurement under representative soil conditions. An agronomic decision also needs crop requirements, nutrient availability and an appropriate reference approach.
A point beside a fertilizer band may not represent the surrounding bed. Likewise, a dry point and a recently irrigated point differ in more than nutrient status. Keep these conditions with the observations rather than treating every numerical difference as evidence of fertilizer depletion.
Choose the intended depth and position relative to rows, emitters and recent fertilizer placement. Use consistent contact and allow the installed reading to settle according to the actual instrument behavior. Avoid comparing a probe loosely inserted in disturbed dry soil with another tightly installed in a wet root zone.
For repeated spot checks, define the number and distribution of locations and retain individual observations. Combining several points can be useful, but the aggregation method should match the question. Do not hide a locally anomalous result in an average before inspecting its contact and field condition.
For a permanent installation, mark the point and protect the cable against cultivation and strain. Record changes in location or replacement hardware. A new point a short distance away may sample a different fertilizer distribution, so it should not silently continue the old series as an unchanged observation.
Pair sensor observations with reference samples from an appropriate nearby soil volume and record timing. Identify the laboratory method and reported nutrient quantity. Total nutrient, an extractable fraction and a sensor's in-situ estimate are not interchangeable because their labels contain N, P or K.
A useful comparison covers the conditions under which the device will be used, rather than only one favorable sample. Examine moisture, salinity, texture and temperature alongside the nutrient estimates. A relationship observed at one site is not automatically a universal calibration for every soil.
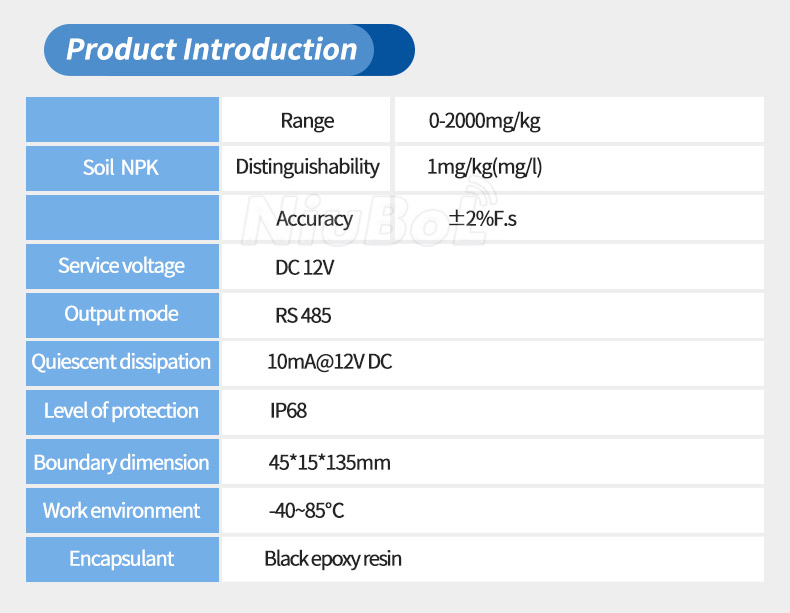
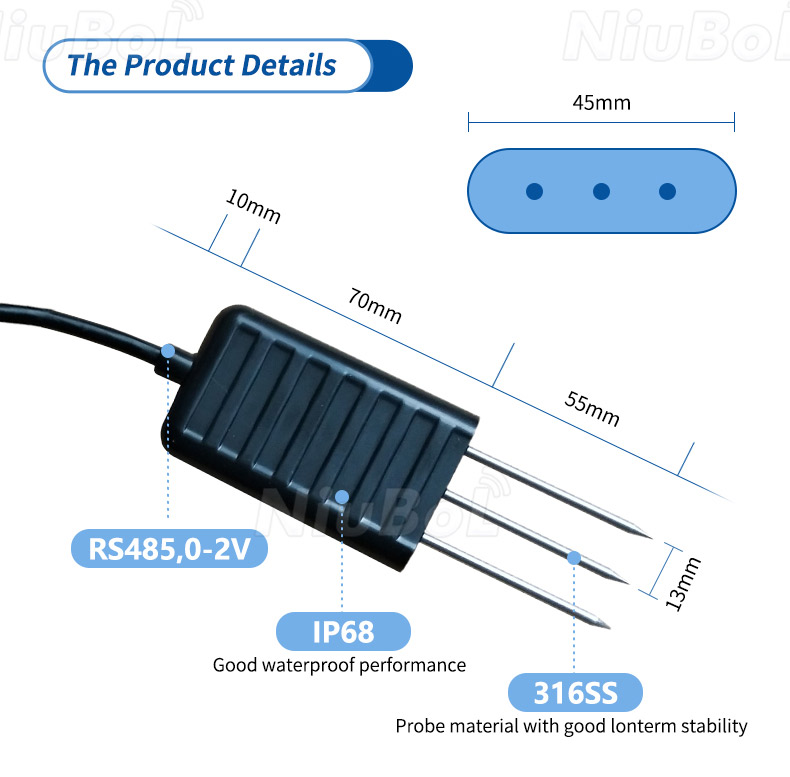
The NiuBoL NBL-S-NPK option provides the following instrument characteristics. Earlier labels and product illustrations can identify different electrical revisions, so confirm the supplied nameplate and wiring before applying a supply range. Do not extend a 12 V-only device's input on the strength of another revision's specification.
| NBL-S-NPK characteristic | Specified value | Project interpretation |
|---|---|---|
| N, P and K channels | Range 0-2000 mg/kg | Retain the quantity and unit assigned to each channel; do not relabel soil readings as solution concentration. |
| Resolution | 1 mg/kg | A display increment does not establish accuracy against a laboratory method. |
| Stated instrument accuracy | +/-2% full scale | For a 2000 mg/kg full scale, the term is +/-40 mg/kg, not +/-2% of every reading. |
| Power for this version | 12-24 V DC; static current 10 mA at 12 V | Confirm the actual revision and budget the logger and other equipment separately. |
| Communication | RS485; defined Modbus RTU exchange | Verify address, request, response, register units and scale with the delivered device. |
| Environment and protection | Operating -40 to +85 degrees C; IP68 probe | These ratings do not guarantee a validated nutrient relationship in every medium. |
| Construction and cable | Black epoxy sealing; cable jacket and length to be specified | Check exposure and field connections; do not infer all material details from an illustration. |
The full-scale calculation explains the instrument notation, not a guaranteed field agreement with chemical analysis. At a reading of 100 mg/kg, an accuracy term of 40 mg/kg would be 40% of that displayed value. This is why resolution, instrument accuracy and suitability for a low-concentration decision must be evaluated separately.
| Item | Required project record |
|---|---|
| Power | Ordered supply range, cable voltage drop and protection |
| Serial settings | Address, baud rate, parity and bus topology |
| Register map | Function code, register address, data type, scaling and units |
| Logger setup | Sampling interval, timestamp, missing-data handling and local storage |
Remote 4G, Ethernet, Wi-Fi, MQTT or cloud transmission requires a compatible logger or IoT gateway. The RS485 sensor itself supplies local measurement data.
Test each physical instrument individually before joining several on a bus. Confirm its identity and unique address, then capture an actual response for the intended registers. Check that a dashboard label has not assigned a nitrogen value to phosphorus or reused one channel for all three displays.
Use the delivered data type and byte order. A communication response that passes its error check can still be interpreted incorrectly by software. Compare the instrument response, acquisition record and displayed engineering value using the same mapping.
Store observation time, point identity, units and validity along with the numerical result. If a request times out, preserve an invalid or missing state rather than repeating the last value as a new measurement. A smooth trend made from repeated stale readings can conceal a failed field connection.
A value at the lower limit, a configured missing-value code and no reply are different conditions. Establish the actual device and logger behavior before assigning alarms. If the receiving system interprets an invalid code as a very low nutrient level, it can create a misleading request for fertilizer.
Check supply at the probe if acquisition is intermittent, especially during other loads on a shared cabinet. Inspect addressing and wiring before changing a calibration. Remote communication faults and field-bus faults occur at different points in the route and need separate diagnosis.
Verify identification, wiring, stable communication, units and plausible response at each point. Keep a baseline dataset and reference-test record. Inspect the probe, cable and connector according to field exposure, and avoid presenting one reading as a whole-field nutrient result.
When the data will influence fertilizer decisions, agree the reference sampling frequency, acceptable difference, review authority and action threshold before commissioning. Without those rules, a connected sensor can produce frequent numbers without a defensible management decision.
A change in an NPK channel can justify further inspection or reference sampling. It does not automatically establish the mass of fertilizer required. A dose also depends on crop targets, nutrient form and availability, rooting depth, application method and the farm's agronomic recommendations.
Soil concentration and application rate have different dimensions. Converting mg/kg into kg/ha would require an appropriate soil mass for a defined depth, among other assumptions; even that arithmetic would not make the result a fertilizer recommendation. Avoid embedding an unexplained concentration-to-dose formula in the control platform.
Ask NiuBoL for the exact sensor version, electrical interface and acquisition requirements. Describe the soil, installation method, intended reference comparison and receiving system. Quote the instrument and gateway separately when the customer already has usable acquisition hardware, and include the validation work in the project plan.
No. It proves a communication exchange when interpreted correctly. Measurement repeatability and agreement with the intended reference need separate field evaluation.
Not by itself. Dosage requires crop targets, nutrient availability, an appropriate soil assessment and the fertilizer and application method. A concentration channel is not a mass-per-area prescription.
With a 2000 mg/kg full scale, the numerical term is +/-40 mg/kg. It is not +/-2% of every displayed reading, and it does not establish the same agreement with all laboratory extraction methods.
Moisture and the local electrical and contact conditions can change as well as nutrient distribution. Review the measurement method and field context before attributing the entire change to nutrient uptake or loss.
Not by simply changing the unit label. Soil mass concentration and solution concentration describe different quantities. Confirm the instrument's intended medium and the actual measurement definition for that version.
Establish a repeatable sampling procedure and a representative validation set, then verify channel mapping for each point. Expand only after the project can explain what the observations mean and which decisions they support.
Request model and revision, supply, wiring, communication definition, channel units, cable and the required acquisition package. State the intended soil conditions and comparison method so electrical compatibility is not mistaken for validated agronomic performance.
A soil NPK sensor is most useful as part of a controlled sampling and data system. Integration details and reference checks determine whether the trend is usable.
Use soil NPK measurements within a consistent sampling and validation procedure. Keep communication, instrument characteristics and agronomic interpretation separate, and make every stored channel identifiable. That produces a more useful project than a connected display that implies an unsupported fertilizer recommendation.

Prev:Soil Temperature and Humidity Sensor: The Perfect Solution for Your Agricultural Needs
Next:Soil pH Sensor: The Solution for Accurate Soil Monitoring
Related recommendations
Sensors & Weather Stations Catalog
 Agriculture Sensors and Weather Stations Catalog-NiuBoL.pdf
Weather Stations Catalog-NiuBoL.pdf
Agriculture Sensors Catalog-NiuBoL.pdf
Water Quality Sensor Catalog-NiuBoL.pdf
Related products
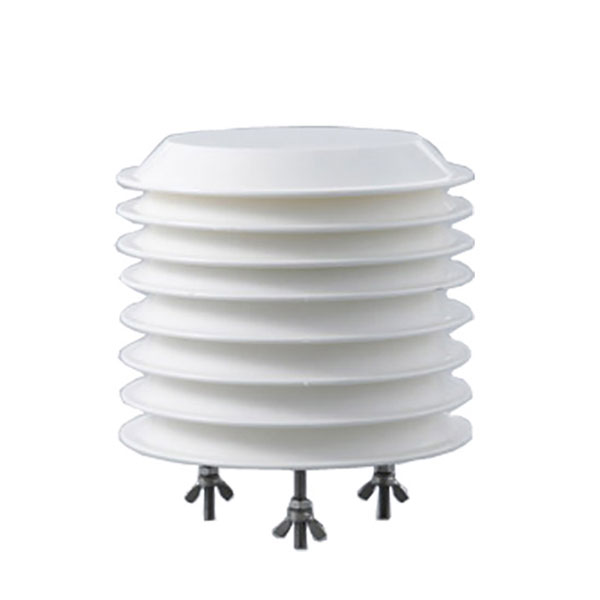 Combined air temperature and relative humidity sensor
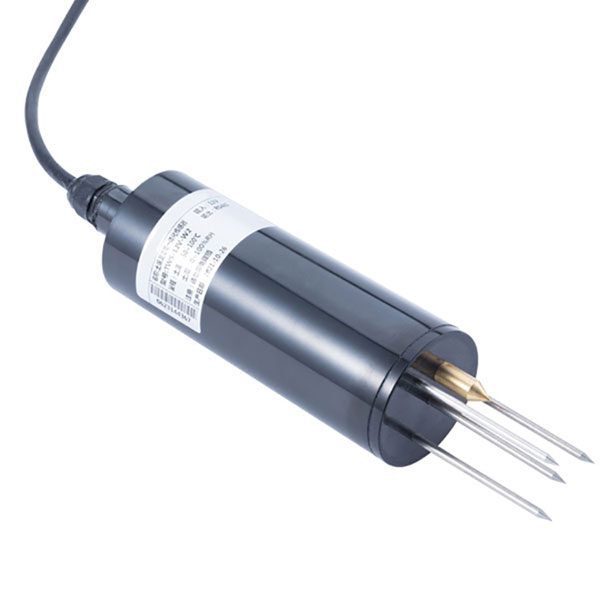 TDR Soil Moisture & Temperature Sensor for irrigation| RS485 |4-20mA| NBL-S-THR
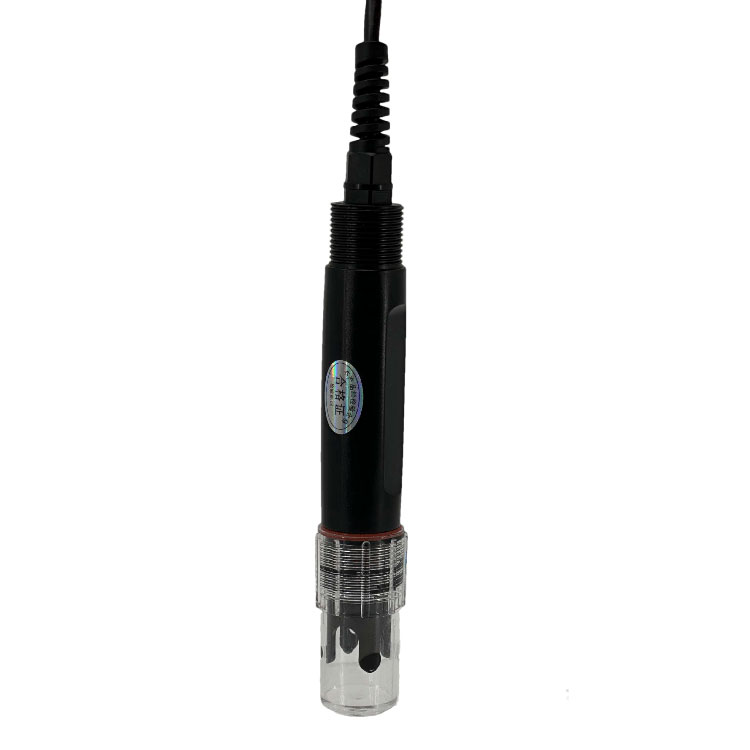 Soil pH sensor RS485 soil Testing instrument soil ph meter for agriculture |NBL-S-PH
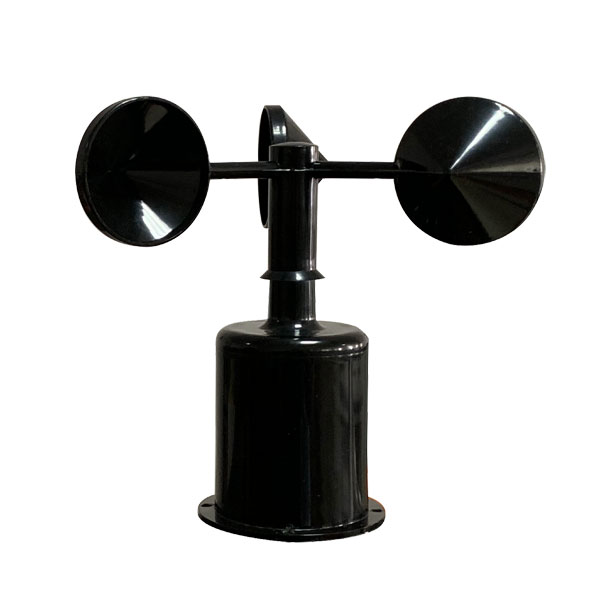 Wind Speed sensor Output Modbus/RS485/Analog/0-5V/4-20mA
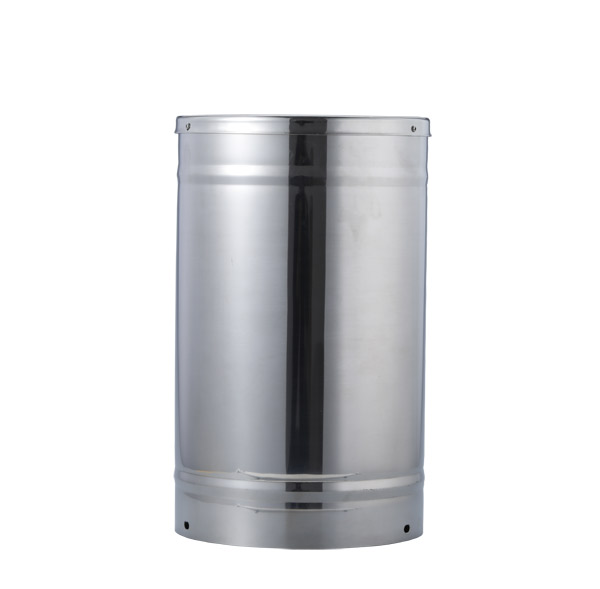 Tipping bucket rain gauge for weather monitoring auto rainfall sensor RS485/Outdoor/stainless steel
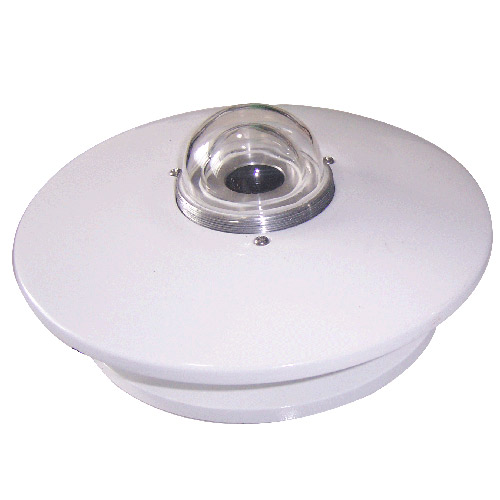 Pyranometer Solar Radiation Sensor 4-20mA/RS485

Screenshot, WhatsApp to identify the QR code
WhatsApp number:+8615367865107
(Click on WhatsApp to copy and add friends)