





— Blogs —
—Products—
 Consumer hotline +8618073152920
WhatsApp:+8615367865107
Address:Room 102, District D, Houhu Industrial Park, Yuelu District, Changsha City, Hunan Province, China
Product knowledge
Time:2025-10-18 10:49:02 Popularity:1465
PV soiling sensor readings must be interpreted according to the instrument's channel definition. The NiuBoL NBL-W-PSS reports two local optical cleanliness values; these are not a direct measurement of whole-plant electrical energy loss. Preserve both channels and their scaling before using the data to investigate contamination or evaluate cleaning.

The NBL-W-PSS soiling sensor uses an optical sensing-glass method. It observes contamination at the instrument, rather than weighing airborne particles or measuring the electrical output of every surrounding PV module. Its data can help investigate whether a monitored location is becoming dirtier.
That distinction matters when a dashboard labels the channel as loss. An optical ratio, a clean-versus-soiled reference-module comparison and a plant energy calculation are different observations. Do not assign the same meaning to them simply because each can be displayed as a percentage.

The PSS data example contains raw values 965 and 968, decoded as cleanliness values of 96.5% and 96.8%. Keep those channel names and decimal scaling in the logger. Displaying 965% is a scaling error; calling the value 96.5% power loss reverses its meaning.
If the application calculates 100 minus 96.5, the arithmetic result is 3.5 percentage points below the cleanliness reference. It does not establish that the entire plant lost 3.5% of its energy. That further interpretation needs an appropriate relationship to the modules, deposits and performance analysis.
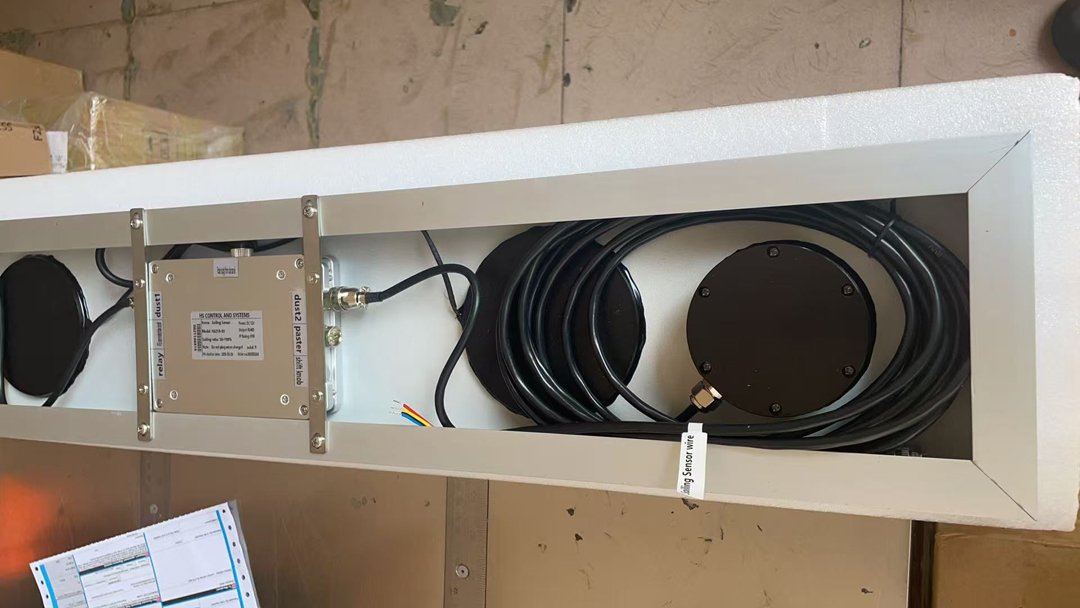
Retain both values when one changes more than the other. An immediate average can conceal a local deposit, uneven cleaning or an instrument issue. Inspect the two sensing surfaces and compare their histories before deciding that either channel is wrong.
Record whether the change followed rain, a service visit or a reset. If a channel jumps after cleaning the instrument alone, the array may be unchanged. If nearby modules have isolated deposits while the instrument is clean, a favourable sensor value does not rule out a local module problem.
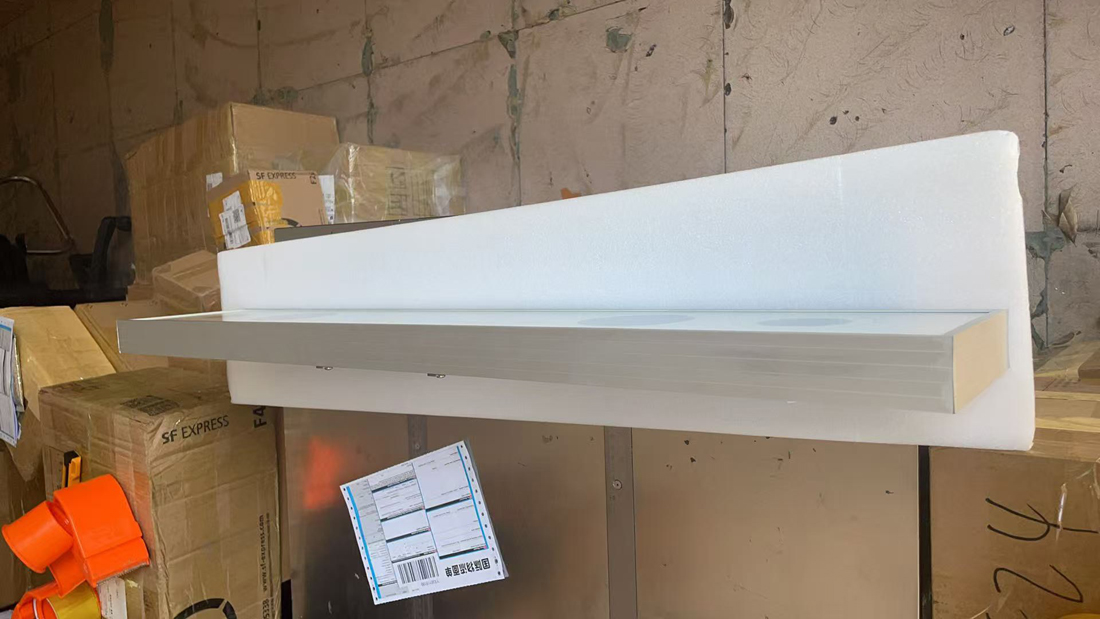
| NBL-W-PSS item | Specification | Data-system consequence |
|---|---|---|
| Supply | 12 V DC | Check the supply at the instrument under load |
| Average power | Approximately 1 W | Allow separately for the logger and network equipment |
| Communication | RS485 Modbus; 9600 bps | Match serial settings and channel decoding |
| Ratio range | 50-100% | A reading is a bounded instrument result, not a plant energy total |
| Accuracy bands | +/-1% at 90-100%; +/-3% at 80-90%; +/-5% at 50-80% | Use the applicable band when judging a small change |
The ratio accuracy specification is not the uncertainty of a whole-plant energy-loss estimate. Nor should extra decimal places in a report imply a more accurate contamination measurement. Set display precision and comparison tolerances to suit the instrument and the analysis.
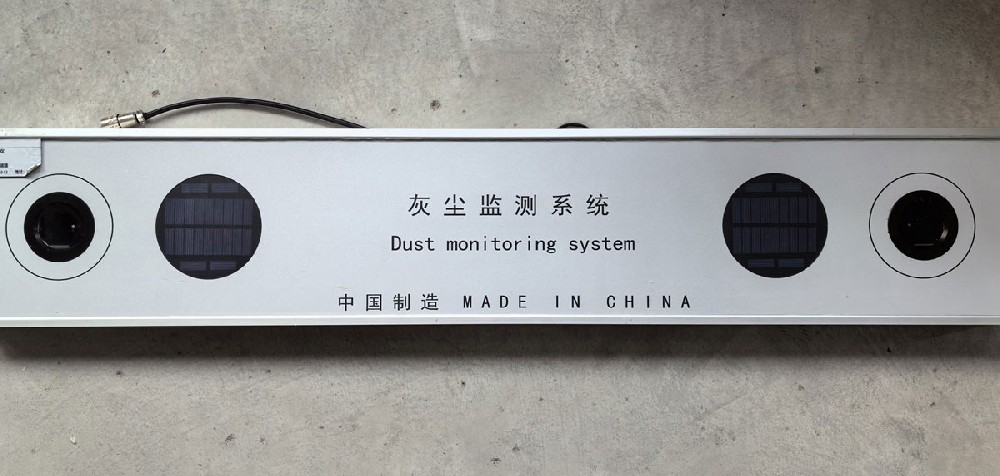
A valid RS485 Modbus RTU response establishes that a frame was received, not that the receiving software has assigned the correct unit or meaning. Compare the raw reply, decoded channels and exported record during commissioning. Preserve the original values if an application adds a derived index.
Keep missing or failed reads distinct from a valid low ratio. Do not silently replace a failed response with zero or the last good value without an accompanying status indication. Otherwise a data fault can look like sudden contamination or an unchanged clean surface.
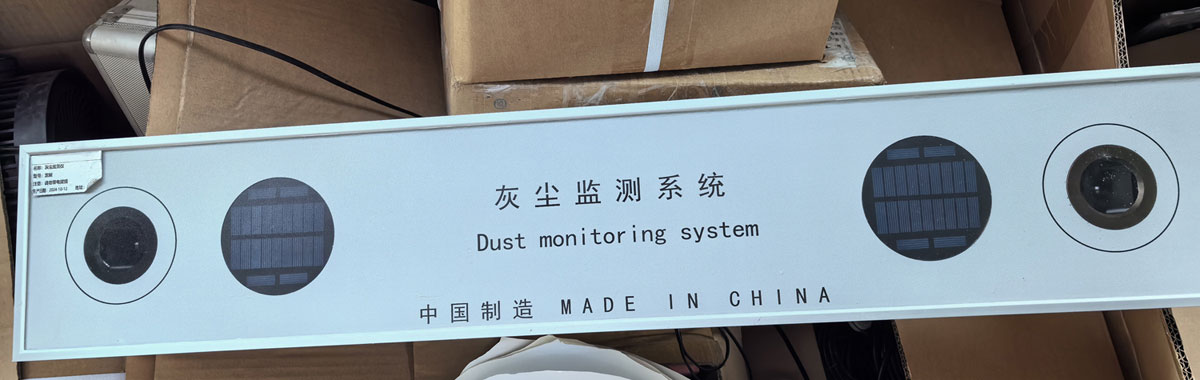
Take a dated observation before service and inspect the instrument and representative nearby modules. Follow the applicable cleaning and reference-setting procedure, then record what was actually cleaned or adjusted. Clean both sensor probes when the associated modules are cleaned.
Keep the instrument aligned with the intended module plane. Confirm the mounting method with the module and frame requirements before making permanent alterations. After service, check the two channels for a plausible response and retain the original pre-service record; do not erase the history to make a trend appear continuous.
A sensor response can support a cleaning investigation without proving a contractual generation gain. For that broader question, use the relevant plant energy records and a defined comparison method. Keep the measurement, derived estimate and commercial acceptance criterion as separate fields.
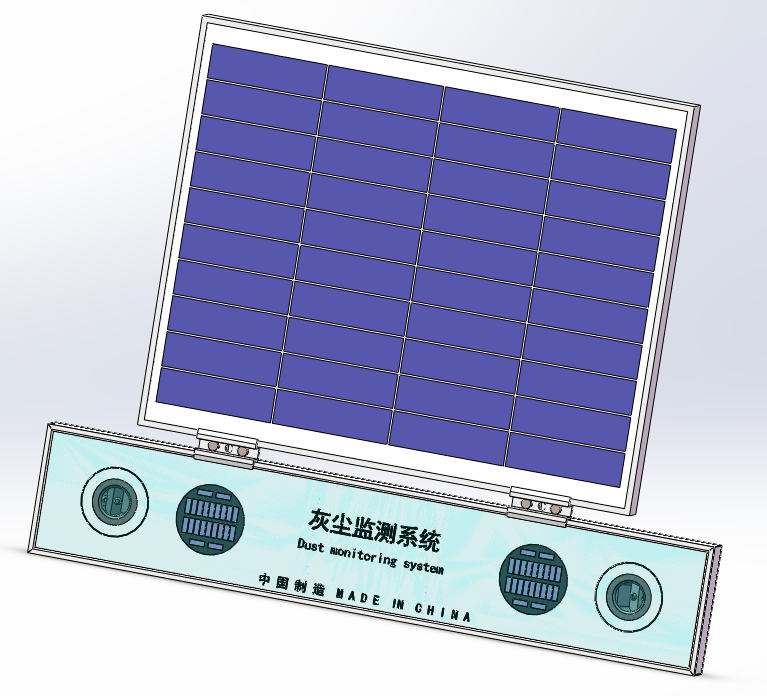
Not automatically. The arithmetic difference from 100% is 3.5 percentage points, but the PSS observes local optical contamination. A plant energy-loss claim requires an appropriate validated interpretation.
No. Keep them separately available so uneven deposits, cleaning or a channel fault can be investigated. Use an average only as part of a defined method that does not hide the underlying values.
The cleanliness result does not identify chemical composition. Site inspection and relevant environmental observations are needed when the deposit source affects the maintenance decision.
No. Instrument-only cleaning changes the measurement surface without cleaning the modules. Record the service scope and inspect the relevant array area separately.
Send NiuBoL the proposed receiving equipment, supply, cable route and required channel names. Include a sample of the intended record format and state whether derived loss calculations or contractual acceptance are separate project requirements.
NBL-W-PSS technical document
Use the matching instrument document for wiring, serial communication and the reference-setting procedure. Keep those settings with the site record so future service does not change the meaning of the historical channels.
 NBL-W-PSS Soiling Sensor Photovoltaic Dust Monitoring Instrument Data Sheet.pdf
Useful PV soiling sensor readings begin with correct channel interpretation. Retain both cleanliness values, check scaling and document cleaning or reference changes. Use the observations to investigate the monitored surface without presenting a local optical ratio as a direct whole-plant energy measurement.
Prev:WiFi vs LoRa Weather Station: Check Both Radio and Server Paths
Next:CO2 Sensors in Greenhouses: Interpret Readings Before Adding Gas
Related recommendations
Sensors & Weather Stations Catalog
Agriculture Sensors and Weather Stations Catalog-NiuBoL.pdf
Weather Stations Catalog-NiuBoL.pdf
Agriculture Sensors Catalog-NiuBoL.pdf
Water Quality Sensor Catalog-NiuBoL.pdf
Related products
 Combined air temperature and relative humidity sensor
 TDR Soil Moisture & Temperature Sensor for irrigation| RS485 |4-20mA| NBL-S-THR
 Soil pH sensor RS485 soil Testing instrument soil ph meter for agriculture |NBL-S-PH
 Wind Speed sensor Output Modbus/RS485/Analog/0-5V/4-20mA
 Tipping bucket rain gauge for weather monitoring auto rainfall sensor RS485/Outdoor/stainless steel
 Pyranometer Solar Radiation Sensor 4-20mA/RS485


Screenshot, WhatsApp to identify the QR code
WhatsApp number:+8615367865107
(Click on WhatsApp to copy and add friends)

