


— Blogs —
—Products—
 Consumer hotline +8618073152920
 WhatsApp:+8615367865107
Address:Room 102, District D, Houhu Industrial Park, Yuelu District, Changsha City, Hunan Province, China
Product knowledge
Time:2026-06-18 09:13:50 Popularity:138
Construction site dust monitoring is useful only when the monitoring point represents actual site emissions. A dust monitoring station placed in a convenient corner may be easy to install, but it may not show vehicle entrance dust, material storage dust or demolition activity. For contractors, environmental supervisors and system integrators, point selection is therefore part of the technical design, not an afterthought.
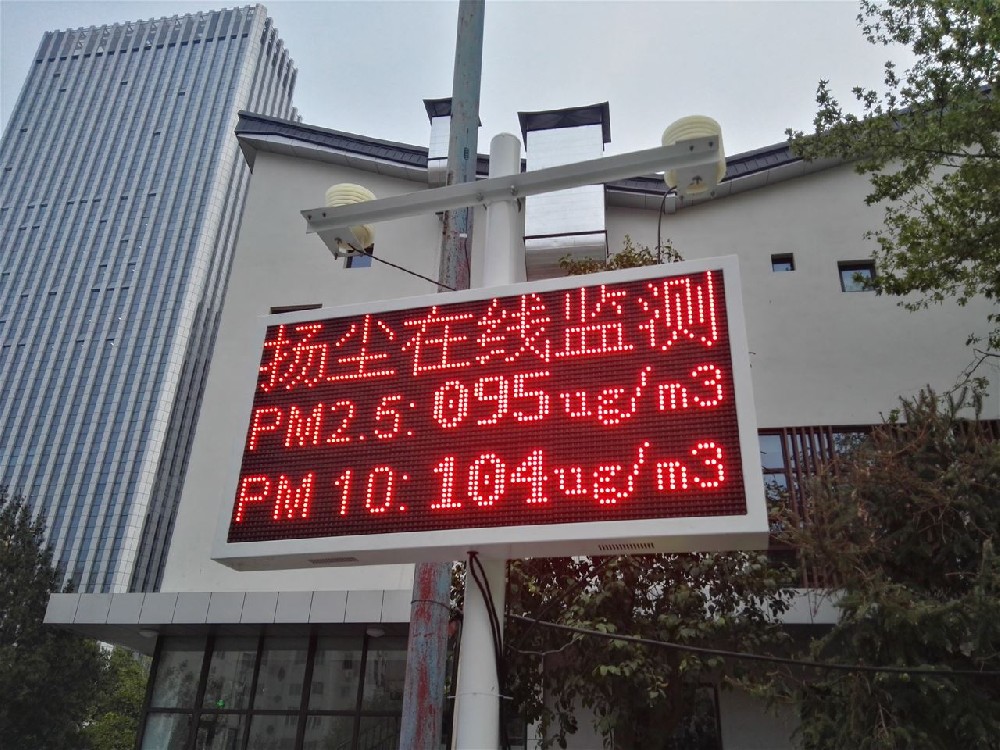
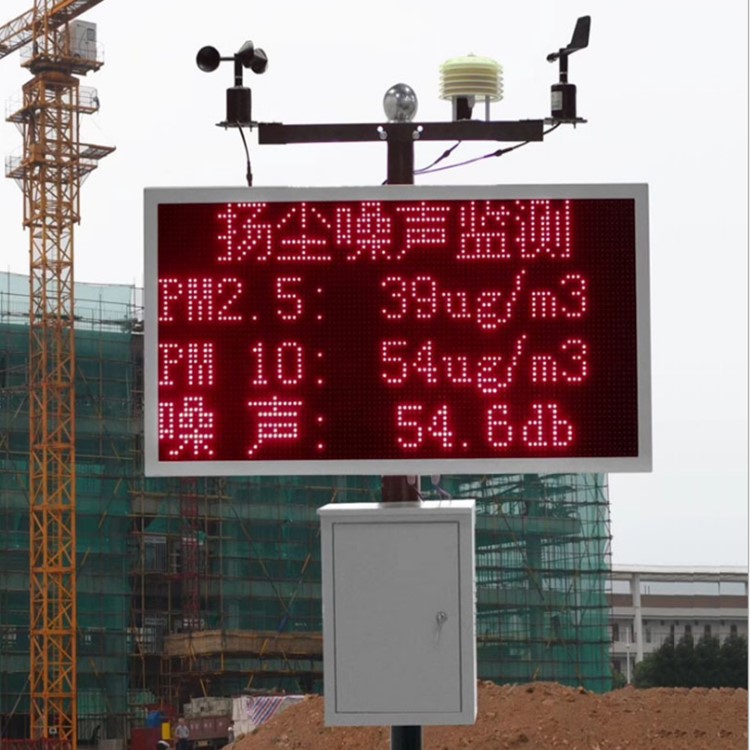
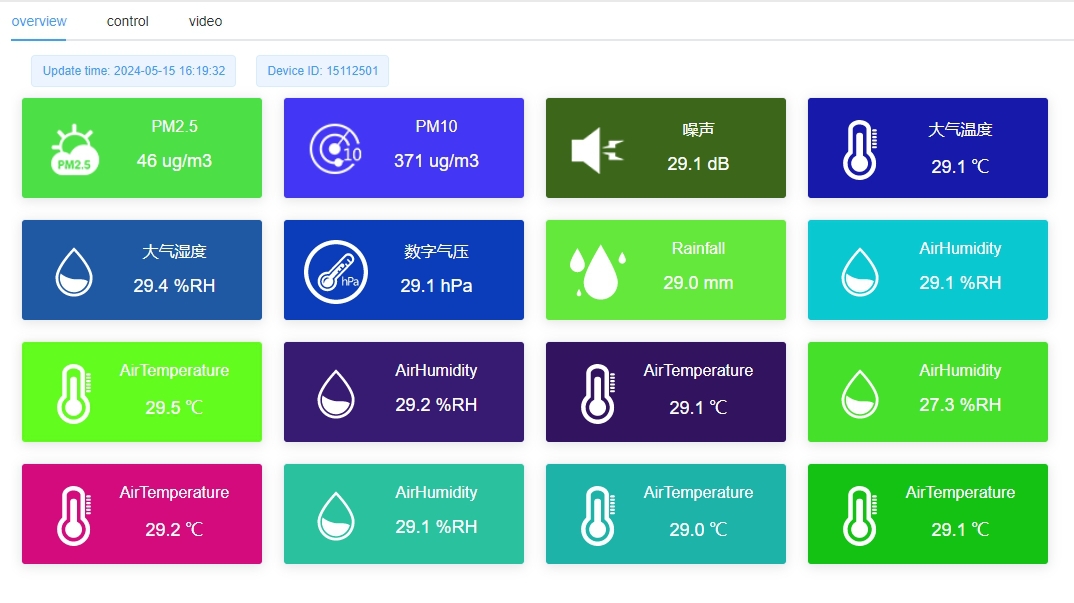
NiuBoL dust monitoring solutions can monitor PM2.5, PM10, TSP, noise, temperature, humidity, wind speed, wind direction and atmospheric pressure. Data can be transmitted through 4G, 5G or wired networks to an environmental data platform, desktop PC or mobile terminal. Some projects also connect cameras for site verification.
Construction, demolition, coal yards, industrial parks and concrete mixing stations often generate dust in large areas. Manual inspection cannot continuously track particulate concentration, wind direction and noise. Online dust monitoring creates a multi-point grid where the owner can see abnormal periods, compare entrances, review reports and respond before complaints or enforcement problems escalate.
The dust monitoring station is a field substation. Sensors collect particulate, noise and meteorological data. A data acquisition unit processes the signal, stores records and transmits data to a cloud or local platform. The platform provides real-time display, alarm processing, query, statistics and report output. In projects with video integration, camera evidence can be linked with concentration changes.
Dust monitoring projects often require multi-terminal access and remote supervision. Field sensors may use RS485 communication inside the station, while the station uploads data by 4G, 5G, Ethernet or project-specific network. The integrator should confirm data interval, platform protocol, alarm format, report export and whether the customer needs government platform docking.
| Item | Technical Reference | Project Note |
|---|---|---|
| Monitoring indicators | PM2.5, PM10, TSP, noise, temperature, humidity, wind speed, wind direction, atmospheric pressure | Select indicators according to project and local supervision needs |
| Particulate method | Online light scattering monitoring instrument in dust system configuration | Suitable for continuous trend monitoring |
| Data transmission | 4G / 5G or wired network transmission | Confirm signal availability at each monitoring point |
| Platform functions | Alarm, record, query, statistics and report output | Useful for project management and supervision |
| Video option | Camera integration can be supported | Helps verify site activity during abnormal readings |
| Power supply | Stable site power; solar option depends on station configuration | Plan power protection and maintenance access |
| Installation location | Inside construction fence safety area and able to observe main activities | Avoid affecting site safety and operations |
| Interference control | Avoid strong electromagnetic interference and blocked airflow | Improves data stability |
| Network condition | Stable 4G signal or wired network nearby | Required for real-time upload |
| Maintenance | Sensor inspection, cleaning, communication check and platform verification | Define responsible party before installation |

At least one monitoring point should be arranged near a vehicle entrance or main construction entrance. For larger sites, additional points should be placed near major dust sources. The material notes that projects over 5000 m² or 10000 m² may require extra points according to area and control zone. Once a monitoring point is confirmed, it should not be moved frequently because continuity and comparability depend on a stable location.
Airflow around the monitoring point should remain open. Tall buildings, trees and other barriers should not block ambient air. The horizontal distance from the sampling inlet to the nearest high obstacle should be at least twice the vertical height difference above the sampling inlet. This rule helps avoid readings that are biased by local blockage rather than site dust condition.
Site challenge: Vehicle movement produces short-term dust peaks and is often the most visible control point.
System integration scheme: Install one dust monitoring station near the entrance within the safe fence area.
User value: The contractor can link dust peaks with vehicle activity and improve cleaning or spraying schedules.
Site challenge: One point cannot represent a wide site with several work zones.
System integration scheme: Add monitoring points according to site area and major dust sources.
User value: The owner can compare zones and focus mitigation where abnormal readings occur.
Site challenge: Linear projects move over long distances and may operate for more than three months.
System integration scheme: Set one point per section and add points along long routes as required.
User value: Supervisors receive continuous data without relying on sporadic inspection.
Site challenge: Material storage, loading and vehicle movement produce localized dust.
System integration scheme: Place points at the main entrance and near silos or major dust sources.
User value: The plant can manage dust suppression with clearer evidence.
Buyers should define site type, area, number of entrances, major dust sources, available power, network condition, platform requirement and camera requirement. The quotation should include monitoring parameters, station structure, communication method, platform access, installation accessories and maintenance support.
Acceptance should check live PM values, noise value, weather data, platform upload, alarm rules, report export and installation position. A site photo should be kept for each monitoring point so later data can be interpreted with installation context.
A construction site dust monitoring station should be specified as a field measurement system rather than a single display device. A useful procurement document defines the monitoring target, installation environment, measured parameters, power supply, communication method, data platform, alarm logic, maintenance access and acceptance procedure. This gives distributors, integrators and project owners a common technical baseline before quotation.
For better data quality, keep the station away from walls, trees and temporary materials that block airflow. Do not place the sampling inlet directly beside a water spray nozzle or exhaust outlet. If the site changes significantly, document the change before moving a station.
The purchase request should list site area, number of entrances, main dust sources, project duration, available power, network condition, camera requirement and platform access. If the project is in a strict control zone, include the local point quantity rules and whether government platform docking is needed. These details determine whether one station is enough or a multi-point layout is required.
Contractors should also confirm installation responsibilities. Some projects require the supplier to provide hardware only; others require pole installation, wiring, platform account configuration, camera connection and operator training. A complete scope prevents the monitoring station from arriving on site without the accessories needed for commissioning.
Dust monitoring data is useful when it is connected to action. If PM10 rises at the vehicle entrance, the site may need road cleaning, wheel washing or vehicle speed control. If dust rises near material storage, covering, spraying or loading procedures may need adjustment. If dust rises together with strong wind, temporary work suspension may be more effective than local spraying.
Noise and weather data improve interpretation. Wind direction can show whether the source is inside or outside the site. Rainfall may explain lower dust levels. Noise peaks can be matched with machinery use or night construction. This is why integrated dust, noise and weather monitoring is more useful than particulate data alone.
A common mistake is placing the station only where power is convenient. This may miss the actual dust source. Another mistake is placing the station too close to a wall, fence corner or temporary building, causing local airflow distortion. Some projects also forget that a monitoring point should remain stable after installation; moving it frequently weakens historical comparison.
For better management, mark each monitoring point on a site plan and record the reason for choosing that point. If a point is near the vehicle entrance, label it as entrance control. If it is near material storage, label it as source control. This helps the platform data become meaningful during daily review.

A: The first point is usually placed near the main vehicle entrance or main construction entrance because vehicle movement and road dust often create visible particulate peaks. The point should be inside the site safety area, have stable power and network access, and still represent site activity rather than a sheltered corner.
A: The number depends on site area, number of entrances, major dust sources, local supervision rules and project duration. Small sites may need only the required entrance and control points, while larger projects need additional stations near material storage, demolition zones, long road sections or multiple entrances to form a representative monitoring layout.
A: Stable location makes historical data comparable. If a station is moved frequently, a rise or drop in PM values may reflect the new location rather than real site improvement. If relocation is unavoidable, record the reason, date, old position and new position so later reports can be interpreted correctly.
A: Blocked airflow, nearby walls, trees, temporary buildings, direct water spray, exhaust outlets or strong electromagnetic interference can distort readings. The sampling inlet should be exposed to representative air while remaining safe for equipment and workers. Network and power stability should also be checked before final installation.
A: Yes for most construction projects. PM2.5, PM10 and TSP show particulate conditions, while noise indicates construction activity and wind data helps judge source direction. Rainfall and humidity also explain dust changes. Integrated data is more useful for site management than particulate readings alone.
A: Provide site area, construction type, number of entrances, main dust sources, project duration, power condition, network coverage, camera requirement, platform docking requirement and local point quantity rules. This allows the supplier to propose a complete layout instead of only quoting one station.
A: Acceptance should verify PM2.5, PM10, TSP, noise and weather readings, platform upload, alarm threshold, report export, camera connection if included and installation photos. Each point should have a station name that matches the site plan, such as main entrance, material storage or boundary point.
A: Yes. PM peaks at vehicle entrances may indicate the need for road cleaning or wheel washing. Peaks near storage areas may require covering or spraying. Wind-related peaks may require temporary work adjustment. Data becomes valuable when it is linked to specific site actions.
A: Cameras help verify what was happening when dust or noise increased. They can show vehicle movement, material loading, demolition, road condition or whether the site was affected by outside activity. This is useful for project management and dispute review.
A: It should explain point selection, station quantity logic, data use, acceptance criteria, platform requirements and common installation mistakes. Buyers need these details to prepare inquiries, compare quotations and avoid installing equipment that cannot produce representative data.
Construction site dust monitoring point selection determines whether the system produces actionable data. By combining PM2.5, PM10, TSP, noise, weather data, network upload and platform reporting, NiuBoL dust monitoring solutions help contractors and project owners manage dust control with continuous evidence.
Prev:VOCs Online Monitoring System for Industrial Parks, Boundary Monitoring and Air Quality Projects
Next:Campus Weather Station Procurement Guide for Education, Safety and Meteorological Observation
Related recommendations
Sensors & Weather Stations Catalog
 Agriculture Sensors and Weather Stations Catalog-NiuBoL.pdf
Weather Stations Catalog-NiuBoL.pdf
Agriculture Sensors Catalog-NiuBoL.pdf
Water Quality Sensor Catalog-NiuBoL.pdf
Related products
 Combined air temperature and relative humidity sensor
 Soil Moisture Temperature sensor for irrigation|NBL-S-THR
 Soil pH sensor RS485 soil Testing instrument soil ph meter for agriculture |NBL-S-PH
 Wind Speed sensor Output Modbus/RS485/Analog/0-5V/4-20mA
 Tipping bucket rain gauge for weather monitoring auto rainfall sensor RS485/Outdoor/stainless steel
 Pyranometer Solar Radiation Sensor 4-20mA/RS485

Screenshot, WhatsApp to identify the QR code
WhatsApp number:+8615367865107
(Click on WhatsApp to copy and add friends)

