


— Blogs —
—Products—
 Consumer hotline +8618073152920
 WhatsApp:+8615367865107
Address:Room 102, District D, Houhu Industrial Park, Yuelu District, Changsha City, Hunan Province, China
Product knowledge
Time:2026-06-18 09:13:52 Popularity:160
Negative oxygen ions are formed when oxygen molecules obtain free electrons produced by air ionization. Energy from sunlight, cosmic rays, electromagnetic waves, rock and soil radiation, waterfalls, waves and weather activity can ionize air molecules. Because oxygen has stronger electron affinity than nitrogen, most negative ions in air are negative oxygen ions.
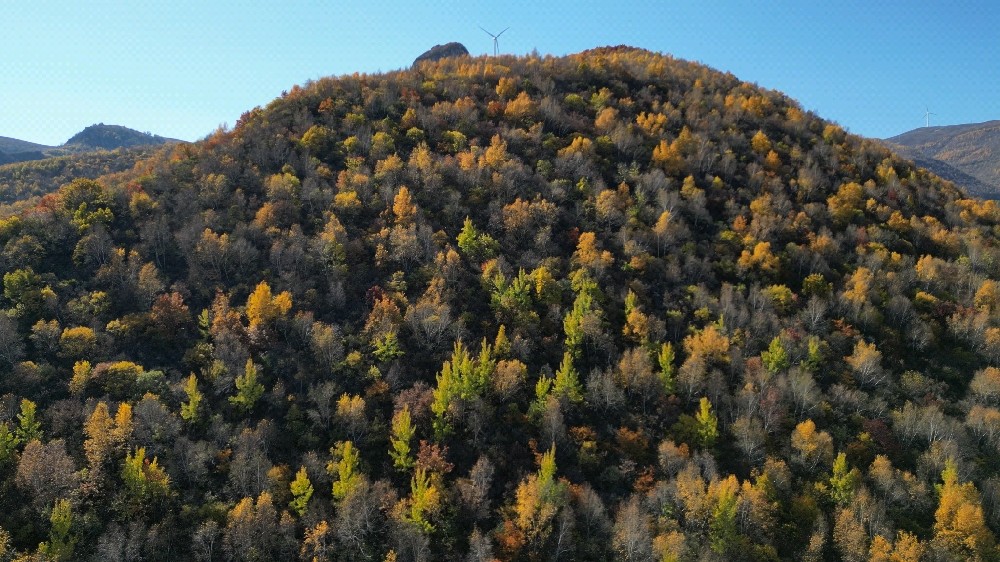
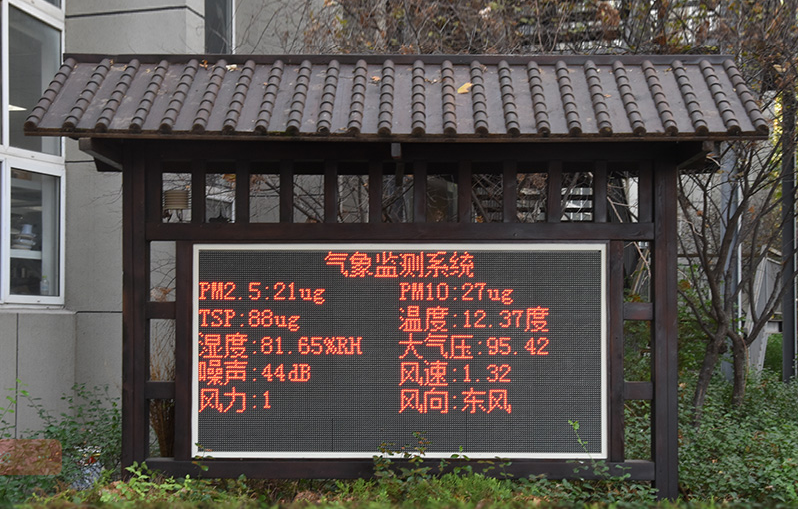
For scenic areas, parks, ecological resorts, schools and environmental display projects, negative oxygen ion monitoring is used to show air freshness indicators together with temperature, humidity, PM2.5, PM10, atmospheric pressure, wind speed, wind direction and noise. The monitoring station becomes both an environmental data node and a public display element.
Tourism and ecological management projects often need visible environmental data. A negative oxygen ion monitoring station can collect ion concentration around the clock, upload data through GPRS, 4G or Internet connection, and display results on an LED screen or software platform. This helps visitors understand the local environment while giving operators historical data for management and promotion.
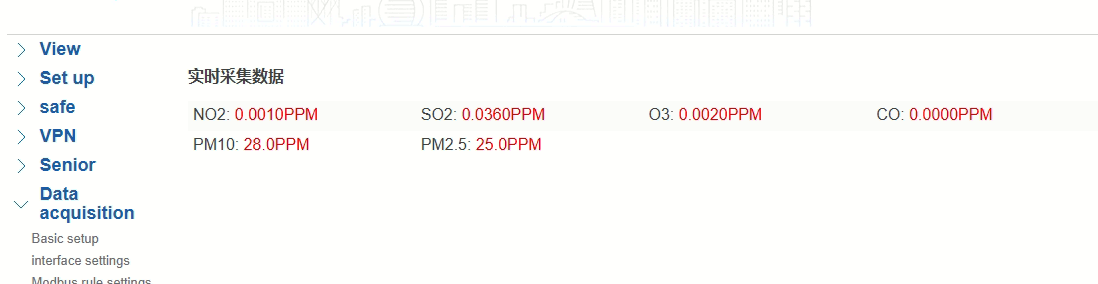
The negative oxygen ion sensor is installed in an environmental monitoring station. It measures ion concentration and outputs data through RS485. The station host collects ion data and optional weather or air quality parameters, then uploads the data to a platform. The display screen can show real-time ion concentration, weather and air quality information at scenic entrances, trails, parks or school environmental displays.
RS485 output with Modbus protocol is suitable for station integration because it allows the ion sensor to connect with a data collector, display controller or gateway. The integrator should confirm address setting, baud rate, register mapping, sampling interval and platform display units. For outdoor scenic projects, waterproof installation, stable 12 V power and communication coverage should be reviewed before deployment.
| Item | Technical Reference | Project Note |
|---|---|---|
| Power supply | External 12 V charging adapter | Use stable power or station power design |
| Average power consumption | <1 W | Suitable for low-power monitoring station |
| Resolution | 10 ions/cm³ | Useful for display and trend monitoring |
| Measurement range | 10-500000 ions/cm³ | Covers common scenic and park monitoring needs |
| Wiring | RS485 signal | Supports station data acquisition |
| Protocol | RS485 supports Modbus protocol | Confirm register map before integration |
| Output | RS485 | Compatible with controller and display system |
| Sampling rate | 1 sample per second | Supports near real-time display |
| Error | Ion concentration ≤ ±10% | Use site comparison for project acceptance |
| Mobility | 1 cm²/(S·V) | Reference technical parameter for ion measurement |
| Humidity range | 0-100% | Outdoor enclosure and condensation control still required |
| Operating environment | -10 to +50°C | Confirm local climate before installation |
| Main body size | 180 × 120 × 40 mm | Plan cabinet or station mounting space |
Site challenge: Visitors need simple, real-time environmental information.
System integration scheme: Install ion monitoring station with LED display and weather data.
User value: The scenic area presents environmental data in a visible and credible form.
challenge: Air freshness and microclimate change with season, rainfall and vegetation.
System integration scheme: Combine ion concentration, temperature, humidity, PM and wind data.
User value: Managers obtain historical environmental trends for operation and communication.
challenge: Students need measurable data for ecology and weather activities.
System integration scheme: Deploy ion monitoring with weather station data and platform export.
User value: Teachers can use real local data for environmental science learning.
challenge: Operators need environmental data across several scenic points.
System integration scheme: Connect multiple stations through 4G or Internet to a central platform.
User value: The operator can compare locations and display attractive public information.
Before buying, define whether the project needs only negative oxygen ion data or a multi-element environmental station. Scenic areas often add temperature, humidity, PM2.5, PM10, atmospheric pressure, oxygen content, noise, wind speed and wind direction. Display style matters too: some sites need a standard metal pole, while others prefer custom wood support or scenic display design.
A negative oxygen ion monitoring system should be specified as a field measurement system rather than a single display device. A useful procurement document defines the monitoring target, installation environment, measured parameters, power supply, communication method, data platform, alarm logic, maintenance access and acceptance procedure. This gives distributors, integrators and project owners a common technical baseline before quotation.
Acceptance should check sensor data, display value, platform upload, time synchronization, RS485 communication, power stability and installation position. For public display projects, screen readability and site aesthetics should also be checked.
Scenic area buyers should define whether the project is a data monitoring project, a visitor display project, or both. A data-only station focuses on sensor stability, platform upload and historical export. A visitor display station also needs LED screen layout, visual design, installation appearance and readable content. Some parks prefer customized wooden supports so the station matches the landscape.
The parameter list should be planned carefully. Negative oxygen ion data is often combined with air temperature, humidity, PM2.5, PM10, atmospheric pressure, oxygen content, noise, wind speed and wind direction. Adding every parameter is not necessary for every site, but the core data should support the environmental message that the scenic area wants to present.
Negative oxygen ion data can be used for public information, environmental interpretation, seasonal comparison and smart tourism displays. When several stations are installed, the operator can compare forest areas, waterfall areas, entrances and open plazas. This helps identify which locations have stronger environmental features and where display screens should be placed.
For schools and ecological parks, the data also supports education. Students and visitors can see how weather, vegetation, humidity and air quality relate to ion concentration. Historical records make the system more than a display; they turn it into a long-term observation tool.
A scenic entrance display station may include negative oxygen ion, temperature, humidity, PM2.5, PM10 and LED screen. A forest trail station may add wind speed, wind direction and atmospheric pressure. A smart tourism project may install several stations and compare data across scenic points on one platform.
For schools or ecological education bases, the system can be configured with a smaller display and data export function. The purpose is not only to show a number, but also to help students understand air ionization, weather change and environmental monitoring methods.
The first mistake is treating the system only as a display screen. Without stable sensors, data storage and communication, the display loses technical value. The second mistake is selecting too many parameters without deciding how the data will be used. The third mistake is ignoring site appearance; scenic areas often need equipment that blends into the landscape.
A better procurement method is to define the audience first. Visitor-facing systems should focus on readable display and visual integration. Management-facing systems should focus on data accuracy, historical records, platform comparison and maintenance convenience.
Acceptance should include both technical and visual checks. Technically, confirm ion concentration reading, sampling interval, RS485 Modbus communication, platform upload, historical records and alarm or status display if configured. Visually, check screen readability, display content, mounting position and whether the station appearance matches the scenic environment.
If several stations are installed, compare whether each station uses the same units, naming format and reporting interval. Consistent configuration makes the platform easier to use and reduces confusion when managers compare scenic locations.
The buyer should provide the project type, installation location, required display style, number of stations, power availability, communication method and parameter list. Photos of the proposed site are useful because they help judge pole type, screen visibility, cable routing and protection needs.
A: It measures the concentration of negative oxygen ions in air and can also integrate temperature, humidity, PM2.5, PM10, pressure, wind, noise and other environmental parameters. In scenic areas, the data can be shown on a display screen and uploaded to a platform for historical comparison.
A: Scenic areas often want to present measurable environmental quality to visitors. Negative oxygen ion data gives a visible air freshness indicator, especially when combined with weather and air quality data. It also helps operators compare different scenic points such as forests, waterfalls, entrances and open plazas.
A: They are formed when oxygen molecules obtain free electrons generated by air ionization. Sunlight, cosmic rays, electromagnetic waves, rock and soil radiation, waterfalls, waves and weather activity can all contribute to ionization under natural conditions.
A: Not always. Many projects combine negative oxygen ion data with temperature, humidity, PM2.5, PM10, atmospheric pressure, oxygen content, noise, wind speed and wind direction. The right parameter list depends on whether the goal is visitor display, management analysis or ecological education.
A: Buyers should define installation location, number of stations, display style, required parameters, power availability, communication method, platform access and whether the equipment must match scenic design. Site photos help the supplier judge mounting and screen visibility.
A: RS485 Modbus allows the negative oxygen ion sensor to connect to a station controller, display system or gateway. The integrator should confirm address setting, baud rate, register map, unit display and sampling interval before commissioning.
A: Install it where the data represents the target environment and where visitors or managers can use the information. Avoid locations with poor airflow, direct equipment exhaust, hidden screens or difficult maintenance access. For display projects, visibility and aesthetics also matter.
A: Check ion concentration reading, sampling interval, RS485 communication, platform upload, display screen readability, historical records, station naming, installation stability and power supply. If multiple stations are used, confirm that units and reporting intervals are consistent.
A: Operators can compare scenic points, analyze seasonal changes, display real-time environmental information and support smart tourism platforms. Schools and ecological parks can use the data for environmental education and long-term observation activities.
A: A common mistake is treating the system only as a display screen. Without reliable sensing, communication, storage and maintenance planning, the display has limited value. A stronger project connects visible display with stable data acquisition and historical platform records.
A negative oxygen ion monitoring system gives scenic areas and environmental projects a measurable air freshness indicator. With RS485 Modbus communication, low power consumption, real-time sampling and optional multi-parameter station integration, NiuBoL solutions can support smart tourism, park monitoring and environmental education projects.
Prev:Noise Sensor Selection and Measurement Methods for Environmental Monitoring Projects
Next:Five-Parameter Weather Station Advantages for Environmental Monitoring and Project Integration
Related recommendations
Sensors & Weather Stations Catalog
 Agriculture Sensors and Weather Stations Catalog-NiuBoL.pdf
Weather Stations Catalog-NiuBoL.pdf
Agriculture Sensors Catalog-NiuBoL.pdf
Water Quality Sensor Catalog-NiuBoL.pdf
Related products
 Combined air temperature and relative humidity sensor
 Soil Moisture Temperature sensor for irrigation|NBL-S-THR
 Soil pH sensor RS485 soil Testing instrument soil ph meter for agriculture |NBL-S-PH
 Wind Speed sensor Output Modbus/RS485/Analog/0-5V/4-20mA
 Tipping bucket rain gauge for weather monitoring auto rainfall sensor RS485/Outdoor/stainless steel
 Pyranometer Solar Radiation Sensor 4-20mA/RS485

Screenshot, WhatsApp to identify the QR code
WhatsApp number:+8615367865107
(Click on WhatsApp to copy and add friends)
