





— Blogs —
—Products—
 Consumer hotline +8618073152920
WhatsApp:+8615367865107
Address:Room 102, District D, Houhu Industrial Park, Yuelu District, Changsha City, Hunan Province, China
Product knowledge
Time:2025-04-01 17:02:07 Popularity:1394
Quick Answer: Campus meteorological stations are useful when they supply observations that teachers and students can question, compare and analyse. Plan the lessons and required datasets before buying extra sensor channels. A reliable archive, known instrument locations and safe access often contribute more educational value than a large live display or an untested promise of automatic forecasting.
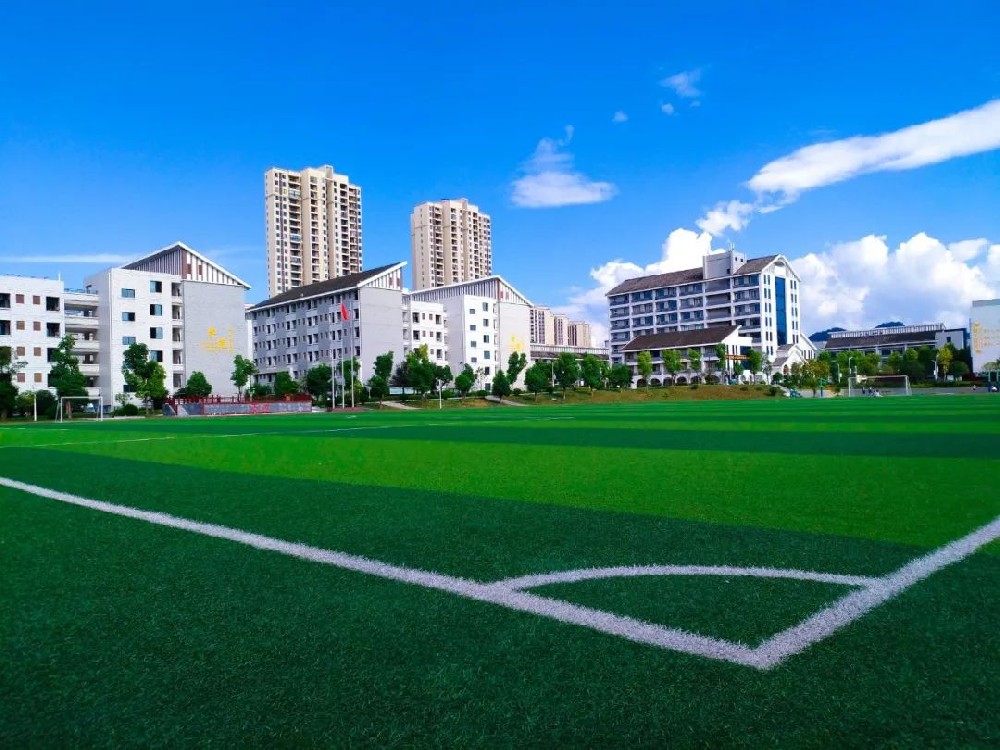
A campus station combines instruments for selected weather elements with a means of recording their observations. Air temperature, relative humidity, pressure, wind and rainfall are common choices. The educational task is to connect each reported value with the instrument, location, time and limitations of the measurement.
For school science monitoring, agree on what students should produce: a daily graph, a rainfall account, a comparison of two locations or a reasoned explanation of an unusual observation. This gives the purchasing team a way to assess the proposed system. A station that supplies current numbers but no usable historical records may not support the planned work.
Assign responsibility for the programme as well as the equipment. Teachers need suitable access and prepared datasets; facilities staff need service arrangements; the project supplier needs a defined delivery scope. Automated observation can reduce routine collection work, but it does not make the installation independent of maintenance or teaching preparation.
Ask students to plot temperature and relative humidity over the same period, then compare the pattern with sunshine, cloud observations or a known weather change. Relative humidity is temperature-dependent; a changing percentage does not on its own establish the amount of water vapour added to or removed from the air. Students should separate the observation from their proposed explanation.
Use the same reporting interval and check whether each value is instantaneous or averaged. A brief maximum seen on a screen may not appear in a more widely spaced export. Decide which data support the exercise before the lesson, rather than discovering that the archive only contains a few snapshots.
A tipping-bucket gauge provides a practical link between a physical mechanism and a recorded quantity. In a configured 0.2 mm gauge, 11 accepted tips correspond to 2.2 mm. This illustrative count explains resolution; it does not establish that the installed gauge collected all rain accurately. Level, exposure, blockage and the test procedure still matter.
Students can compare a daily total with the event record and identify the reporting-day boundary. Include one example of a counter restart or missing period in a prepared dataset. The lesson then shows why adding displayed numbers is not enough without understanding what the numbers represent.
Have students count valid observations by direction sector and report the period and sampling arrangement. State how calm conditions and unavailable readings are represented. A frequency chart of observations is not automatically an energy assessment or a forecast of tomorrow's wind. This keeps the exercise useful without asking a school station to provide an unrelated engineering conclusion.
A teaching export needs clear column names, units, timestamps and a way to distinguish missing values from valid zeros. Keep station identifiers when more than one observation point is used. If an export combines temperature, wind and rainfall, check that the records describe compatible periods rather than simply sharing a row on the dashboard.
Missing data can become a statistics exercise. In an illustrative set of four expected temperature observations, three valid readings are 18, 20 and 22 degrees C and one is missing. The mean of the three valid readings is 20 degrees C. Replacing the missing reading with zero gives 15 degrees C, which is a data-processing error rather than an observed cooling event.
For a classroom report, include the number of valid records and any excluded period. Let students explain what cannot be concluded from incomplete data. This is a more defensible learning outcome than presenting a continuous-looking line that silently connects a long outage or replaces unavailable rainfall with a dry interval.
A paved courtyard, planted area and rooftop can have different local conditions. Decide whether the study concerns those local exposures or a representative open-air observation. A sensor near a warm wall may be useful for a wall-exposure investigation, but should not then be presented as an unobstructed reference observation for the whole district.
If two instruments are used, compare them under similar exposure before moving one to the study location. Record installation height, shading, nearby surfaces and the dates of any relocation. If one instrument is moved between sites, recognise that the weather may also change during the move. These controls help students separate location effects from instrument differences and time variation.
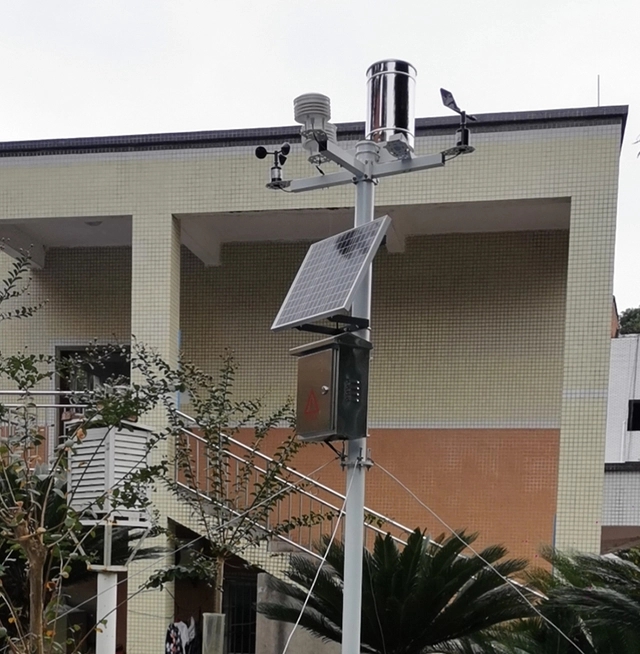
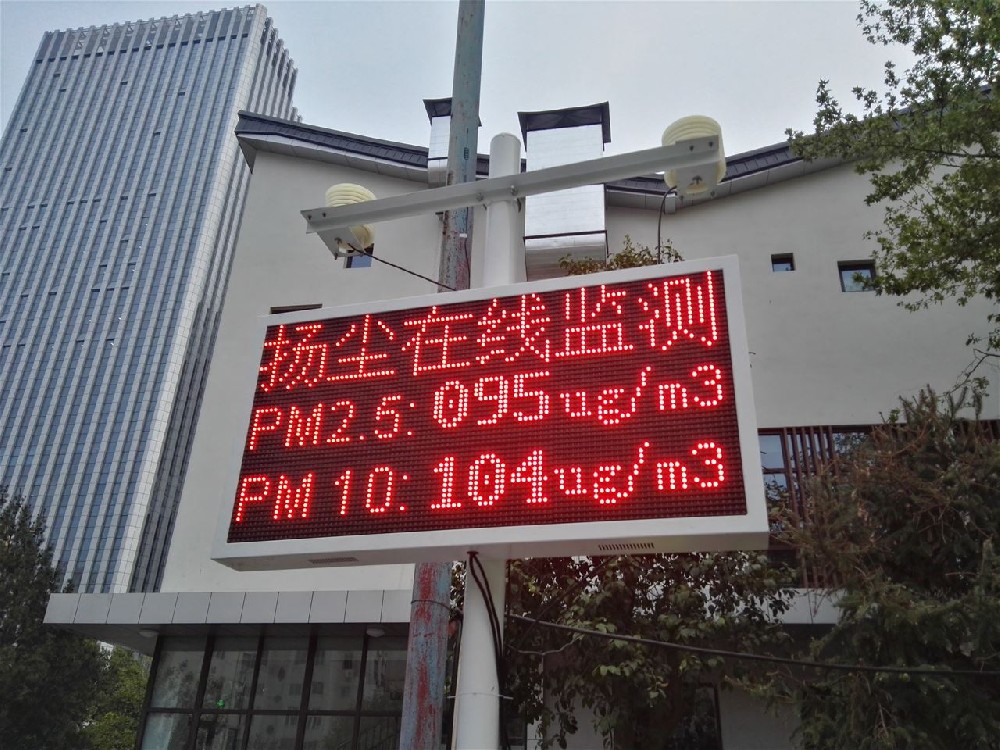
Keep project photographs descriptive. A mast beside a building illustrates an installation arrangement; the image alone cannot establish reference-quality exposure. Discuss the site's limitations with the supplier and teachers before deciding which comparisons the equipment will support.
A few hot days or a wet term are local weather observations. Climate concerns patterns over much longer periods; NOAA's explanation of weather and climate provides a useful distinction. Students can compare a campus series with suitable established records while noting differences in location, period and observing methods.
A school can build a valuable archive by retaining consistent observation practices and documenting changes. However, a new station should not be sold as a device that proves a climate trend from a short record. Teaching the limits of the evidence is part of scientific literacy, not a limitation to hide.
The following NiuBoL examples show how an instrument specification connects to a teaching task. They are component choices rather than a fixed package that every school needs. Keep the station's acquisition and presentation functions distinct from the physical measurements.
| Instrument example | Measurement capability | Teaching interpretation |
|---|---|---|
| NBL-W-LBTH temperature channel | -40 to +80 degrees C; accuracy +/-0.5 degrees C; 0.1 degrees C resolution | A small displayed increment is not proof that two sites differ by that increment. |
| NBL-W-LBTH humidity and pressure | 0-100% RH, +/-5% RH; 10-1200 hPa, +/-1.5 hPa | Use the correct quantity and unit; measured station pressure differs from a calculated sea-level pressure. |
| NBL-W-LBTH interface | 12-24 VDC; RS485 or 4-20 mA versions | The selected output must match the collector; the probe alone does not provide a classroom website. |
| NBL-W-RS, 0.2 mm version | 0-4 mm/min intensity; 0.2 mm resolution; +/-4% in an indoor static test at 2 mm/min | Separate counting resolution, the calibration test and installed rainfall uncertainty. |
| NBL-W-SS and NBL-W-DS | Separate wind speed and direction sensors; IP65 housings | Orientation and surrounding obstructions remain important even when the instruments are weather-protected. |
The rain gauge configuration operates at 0-50 degrees C and should not be assumed to measure snow correctly without a suitable arrangement. Do not assign one universal IP rating to the mast, collector, cables and display. Ask for the actual component specifications and service access appropriate to the school's conditions.
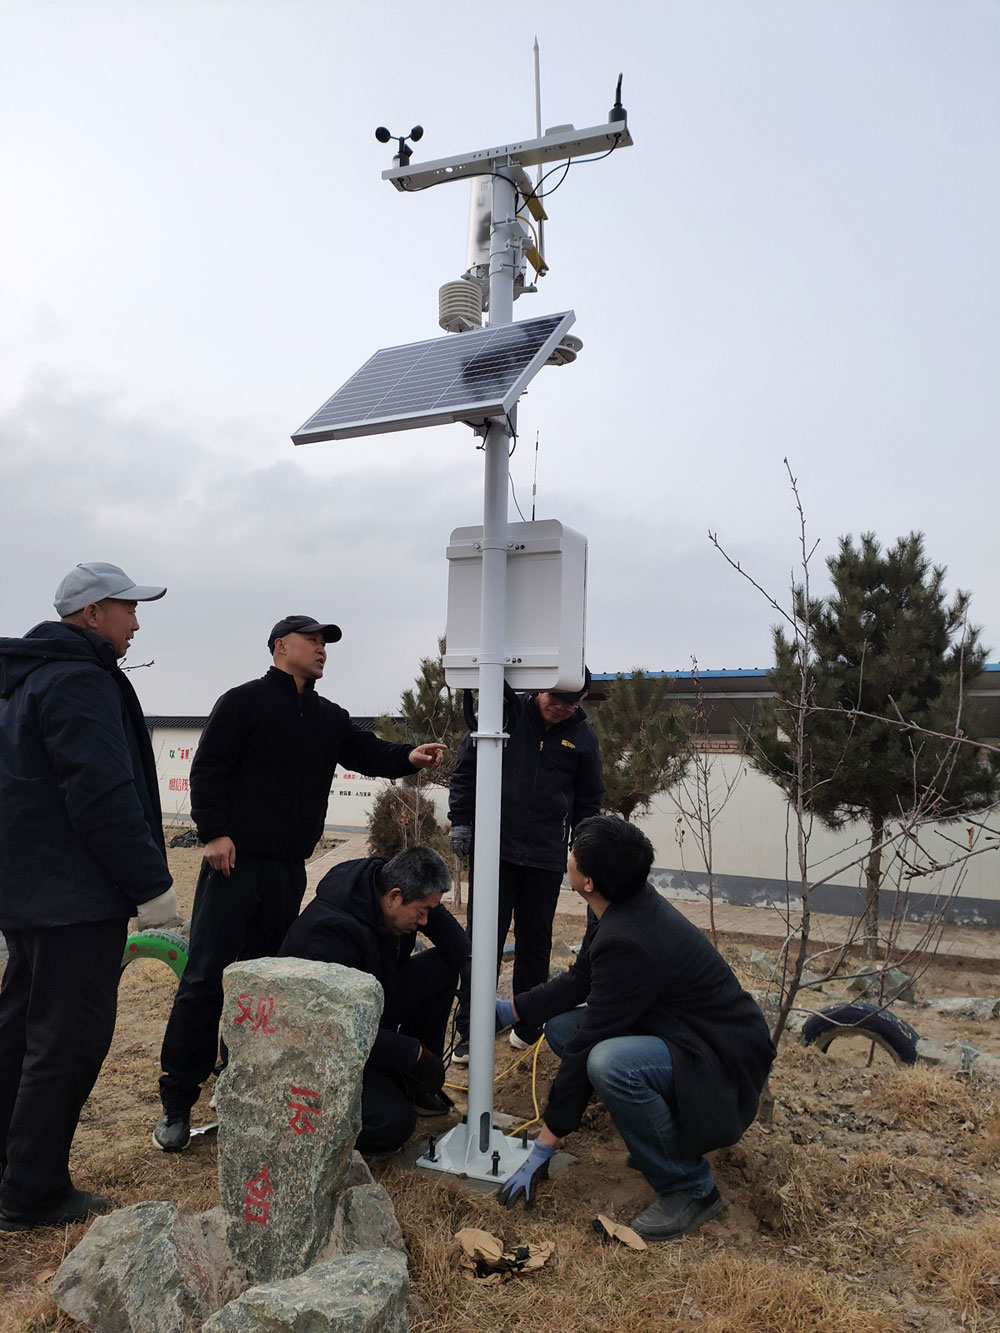
Students can inspect graphs, record observations and participate in supervised ground-level demonstrations. They should not need to climb a mast, handle exposed power connections or change protected calibration settings to complete a lesson. Qualified personnel should install and service equipment requiring electrical or elevated access.
Provide viewing and export permissions appropriate to classes, with separate authorised access for device settings. Before a lesson, check the clock, data availability and any recent maintenance change. A stored dataset can keep the planned exercise available when the live connection fails, provided that it is labelled as historical rather than live.
Outdoor installation also needs practical maintenance access for checking the rain collector, cleaning appropriate surfaces and inspecting cables. Identify who undertakes these tasks during holidays. A display that remains powered during a school closure does not establish that every sensor is operating or that its latest observation is fresh.
Ask the supplier to demonstrate one full classroom workflow: retrieve a chosen period, identify units and missing values, produce the intended calculation and explain the observation location. Include a network interruption or unavailable channel in the demonstration. This tests educational usability more directly than a screen photograph.
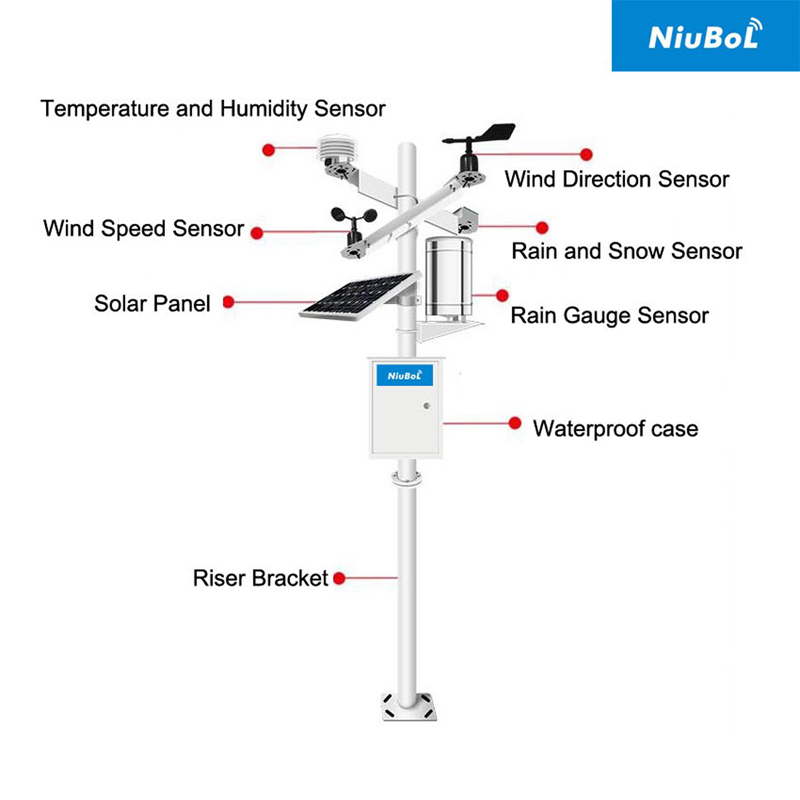
For procurement, define the lessons, required channels, archive access and export format, display location and maintenance responsibility. Request separate prices for instruments, acquisition, mounting, software or hosting and installation. Extra sensors are justified when they support an identified teaching or research task, not simply because a product family can accept them.
NiuBoL can configure weather instruments and acquisition equipment around those observations. For the separate wiring, storage and school-network design, use the campus weather station architecture guide. Here, the acceptance question is whether teachers can deliver the agreed activities with the available records.
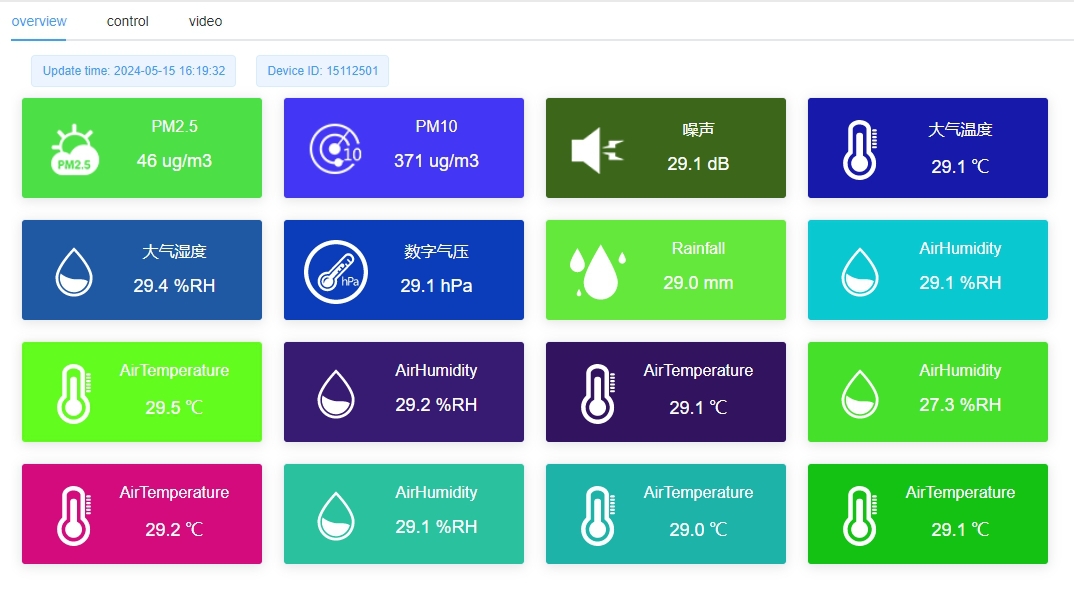
A PM2.5 or PM10 channel is a separate particle measurement, not one of the basic weather quantities by default. If included, it needs its own units, sensing limits and verification. A particle concentration on an outdoor display is not automatically an official air-quality index, an authorised health warning or evidence of the conditions throughout the campus.
Keep school activity and safety decisions within the established procedures and official information arrangements. The educational system can help students examine measurements and question differences, but a forecast or alert function needs its own defined service and responsibility. More channels do not remove those distinctions.
Choose them from the intended activities. Temperature and humidity support daily-cycle work; rainfall supports event and accumulation exercises; wind needs suitable exposure and interpretation. Add pressure, radiation or other channels when the programme has a clear use for them.
No. A school-year record can support weather and seasonal investigations, but a climate assessment needs suitable long-term records and attention to observing changes. Compare periods and locations carefully rather than attributing a short anomaly to a trend.
The instruments may observe different exposure, height, location, times or statistics. Check those factors and instrument condition before interpreting the difference. A local reading need not equal a regional observation to be useful for a clearly defined microclimate study.
Routine classroom analysis should not require configuration or calibration access. Keep those functions with authorised staff and qualified service personnel. Supervised demonstrations can explain calibration without exposing the operating system to uncontrolled changes.
Complete an agreed exercise from an exported dataset, including unit checks, valid-record counts and treatment of missing data. Verify that teachers retain the required access and can retrieve another period without depending on a supplier-prepared screenshot.
No. Historical investigations require retrievable observations with timestamps and known sampling or averaging rules. Confirm retention, export and account arrangements separately from the display's ability to show current values.
Provide the teaching tasks, required observations, proposed location, available power and network, class access needs and maintenance arrangements. This supports a quotation for a usable programme rather than an unexplained list of sensor channels.
Campus meteorological stations support practical education when measurements become usable evidence for a specific question. Build the programme around clear activities, comparable observations and accessible records. Select NiuBoL equipment for that task, keep service access safe and assess the delivered system by a completed lesson rather than by channel count or display size.
Prev:Weather Station Edge Processing: Define Calculations Before Ordering
Next:Small Meteorological Station Calibration: Check the Scope and Records
Related recommendations
Sensors & Weather Stations Catalog
 Agriculture Sensors and Weather Stations Catalog-NiuBoL.pdf
Weather Stations Catalog-NiuBoL.pdf
Agriculture Sensors Catalog-NiuBoL.pdf
Water Quality Sensor Catalog-NiuBoL.pdf
Related products
 Combined air temperature and relative humidity sensor
 TDR Soil Moisture & Temperature Sensor for irrigation| RS485 |4-20mA| NBL-S-THR
 Soil pH sensor RS485 soil Testing instrument soil ph meter for agriculture |NBL-S-PH
 Wind Speed sensor Output Modbus/RS485/Analog/0-5V/4-20mA
 Tipping bucket rain gauge for weather monitoring auto rainfall sensor RS485/Outdoor/stainless steel
 Pyranometer Solar Radiation Sensor 4-20mA/RS485


Screenshot, WhatsApp to identify the QR code
WhatsApp number:+8615367865107
(Click on WhatsApp to copy and add friends)

