

— Blogs —
—Products—
 Consumer hotline +8618073152920
WhatsApp:+8615367865107
Address:Room 102, District D, Houhu Industrial Park, Yuelu District, Changsha City, Hunan Province, China
Product knowledge
Time:2026-02-03 11:40:58 Popularity:616
A dust monitor averaging period determines which events a site supervisor sees. A short loading peak, a sustained elevated condition and a daily exposure pattern are different questions. The NiuBoL NBL-W-PM supplies local PM2.5 and PM10 observations; the logger or application determines how those observations become averages, peaks and alarms. Specify that processing explicitly before using a construction-site display to judge whether an intervention is needed.
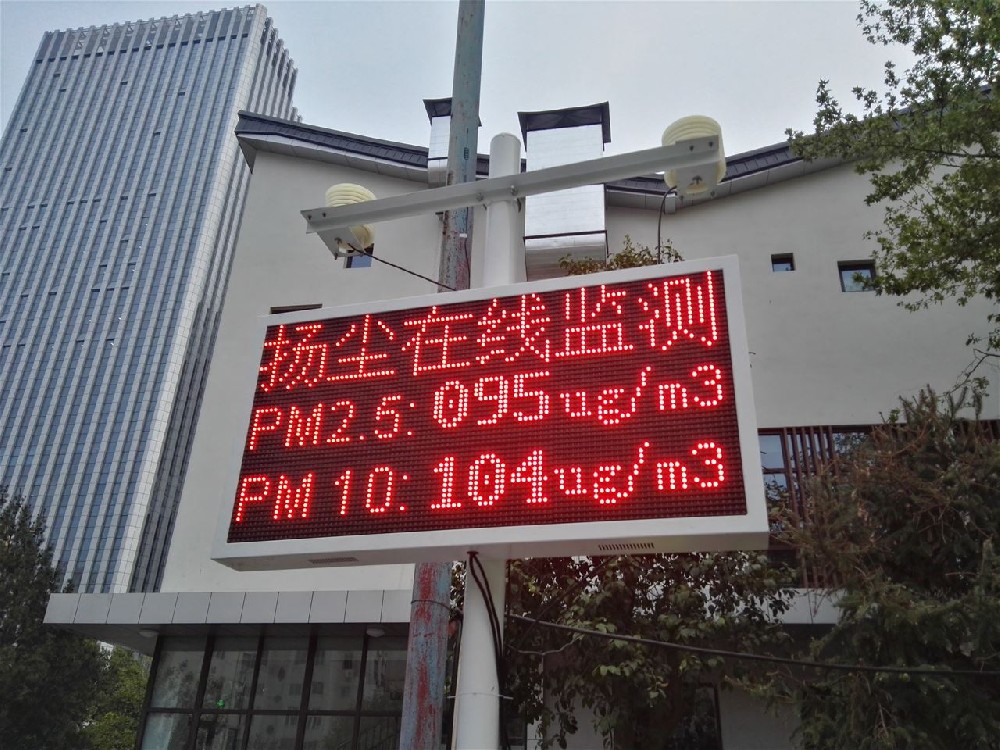
The sensor has its own measurement behavior, the logger polls it at a chosen interval, and the application updates a display or chart. Those intervals need not be equal. A dashboard refreshed once per minute might show a recent individual reading, a one-minute mean, or a mean of the last five minutes. All three can carry the same concentration unit while describing different conditions.
Record observation time separately from server receipt time. If a gateway uploads delayed data after an outage, averaging by arrival time can move yesterday's event into the current shift. Define whether windows are fixed to the clock or rolling, which time zone is used and how a boundary sample is assigned. These details affect comparisons between stations and with work records.
Consider a hypothetical PM10 sequence with a baseline of 120 ug/m3. During one minute, it is 120 ug/m3 for 30 seconds and 600 ug/m3 for 30 seconds. Its time-weighted one-minute mean is 360 ug/m3. If the preceding four minutes remain at 120 ug/m3, the five-minute mean ending at that minute is 168 ug/m3. The maximum remains 600 ug/m3. None of those values is an error; each summarizes a different part of the event.
| Statistic | Example result | Question it helps answer |
|---|---|---|
| Event maximum | 600 ug/m3 | How high was the largest observed value? |
| One-minute mean | 360 ug/m3 | How elevated was the affected minute? |
| Five-minute mean | 168 ug/m3 | Was elevation sustained over the longer window? |
Here ug/m3 means micrograms per cubic meter. If a project uses an illustrative operational trigger of 200 ug/m3, the one-minute result exceeds it while the five-minute result does not. That number is not a legal limit or a recommended universal trigger. It demonstrates why an alarm specification must include the averaging period, not only a concentration threshold.
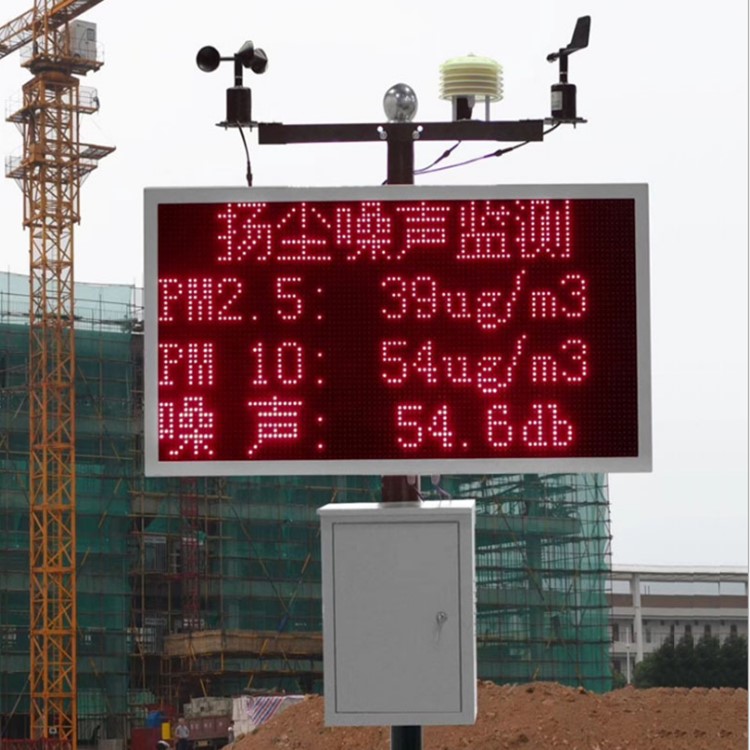
A simple arithmetic average is appropriate only when its sample weighting matches the intended time average. Suppose a second illustrative interval contains 600 ug/m3 for 10 seconds and 120 ug/m3 for 50 seconds. The time-weighted mean is (600 x 10 + 120 x 50) / 60 = 200 ug/m3. Averaging just the two numbers gives 360 ug/m3, overweighting the short high period.
Choose and document how the logger represents values between observations. A held-value calculation assumes a reading remains representative until the next one, but it must stop extending that assumption when the allowed data age is exceeded. Network delay or a failed scan should not silently turn one old reading into minutes of fresh evidence. Store enough timing information to reproduce the reported statistic.
A five-minute window contains 300 seconds. If only 180 seconds have valid observations, its valid coverage is 60%. Do not insert zero for the missing 120 seconds and divide by the full window; that would manufacture a lower concentration. Calculate the available-data statistic using its actual valid duration, identify the coverage, and apply the project's completeness rule before labeling it as an accepted five-minute result.
Do not fill a communications gap with the last value indefinitely either. Separate sensor failure, logger failure and remote-upload interruption. Local observations may exist during an uplink outage, whereas a disconnected sensor creates no new particulate observations. If backfill is supported by the selected logger, recompute historical windows from correctly timed data without presenting their alarms as new current events.
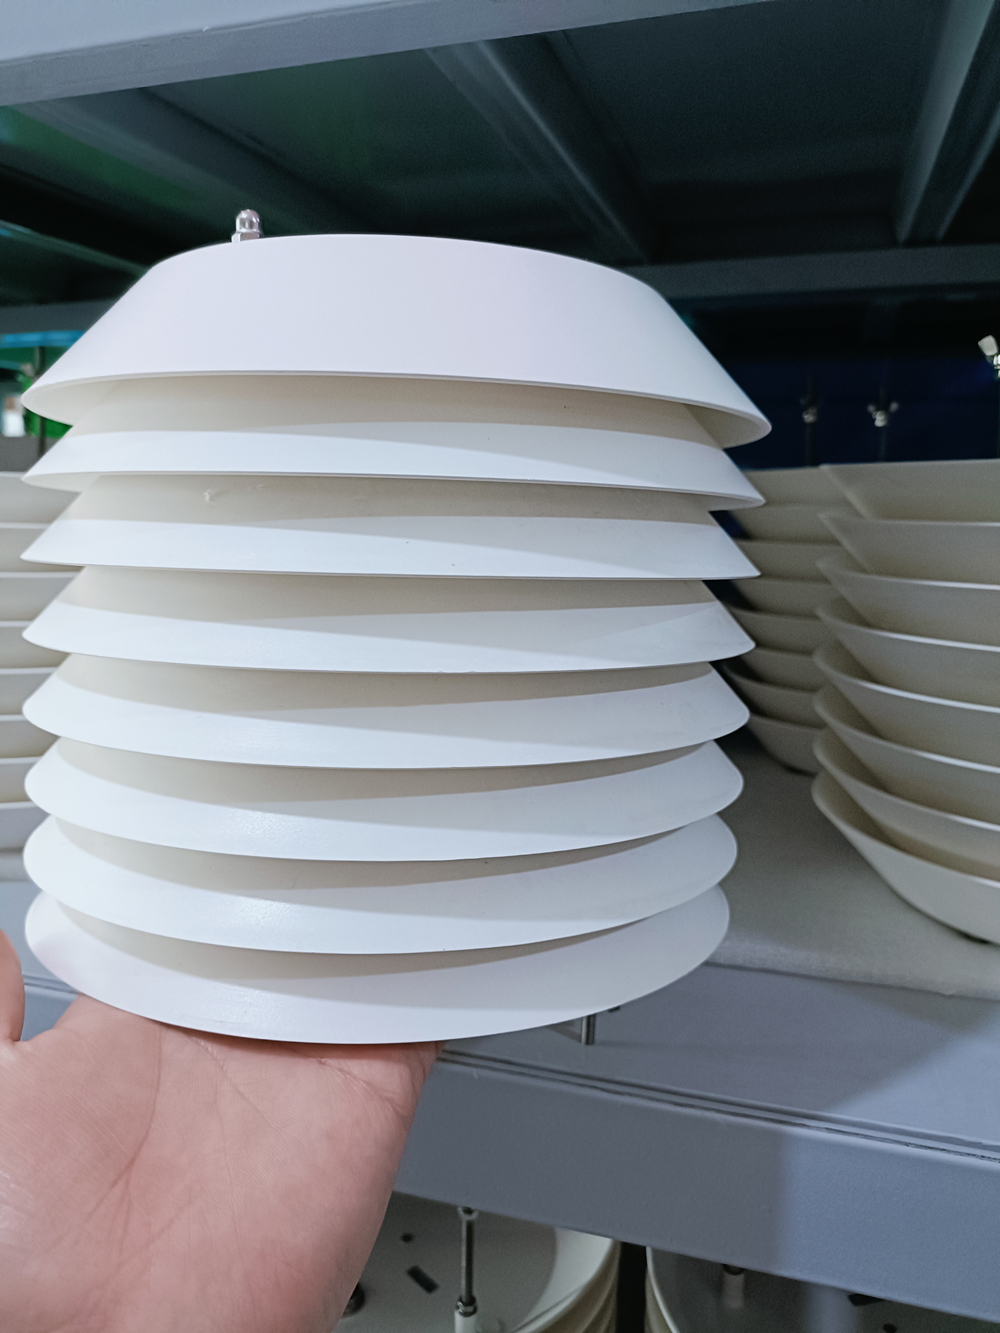
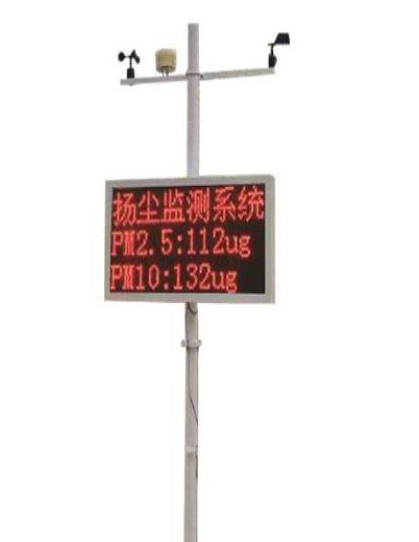
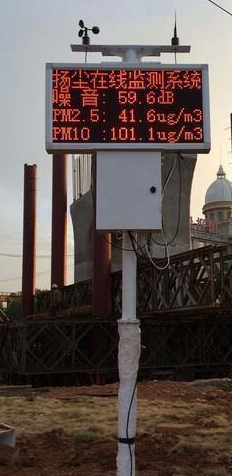
The NiuBoL NBL-W-PM PM2.5 and PM10 sensor uses laser scattering and fan-assisted sampling. It estimates airborne particulate mass concentrations. It is a sensing component, not the outdoor display, camera, noise instrument or suppression controller shown in complete monitoring-station configurations. The selected logger and application must provide the required storage and calculations.
| NBL-W-PM item | Specified information |
|---|---|
| PM2.5 range | 0-1000 ug/m3 |
| PM10 range | 0-2000 ug/m3 |
| Measurement error | +/-15% or +/-10 ug/m3, whichever is greater, at 25 C and 50% RH |
| Minimum detectable particle diameter | 0.3 micrometers |
| Supply and sensor power | 12-24 V DC; approximately 350 mW |
| Digital output | RS485 Modbus RTU; 9600 bps, 8N1 |
| Request spacing | At least 1000 ms |
| Environment | -20 to +60 C; 0-99% RH, avoiding condensation and liquid ingress |
| Cable | Standard 2.5 m; confirm jacket and termination for the installation |
Do not treat the minimum request interval as a guaranteed physical response time to every dust event. Averaging many readings also does not automatically reduce the stated error by the square root of sample count: repeated observations can share aerosol-related bias and other systematic effects. A smoother chart can still be biased. Use an appropriate field comparison to establish whether the optical response is useful for the site's materials and conditions.
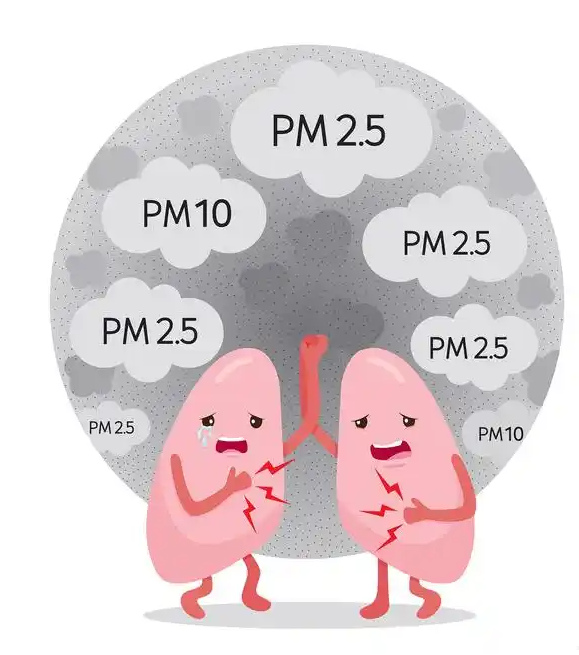
PM10 includes the finer PM2.5 fraction. Adding both readings does not produce total suspended particulate concentration. Keep two separate channel names, units and window definitions. An approximate coarse-fraction difference can be informative under suitable conditions, but it should not be relabeled as an independently measured TSP channel or used to hide a channel disagreement.
A displayed peak should identify its observation interval and validity rule. A one-second sampled maximum and the maximum of one-minute means are different quantities. When a value repeatedly reaches the sensor's range ceiling, the observed maximum is not the true maximum of an event that may exceed range. Preserve the ceiling condition and investigate measurement suitability rather than reporting a clipped number as a precisely quantified peak.
Laser scattering responds to optical properties of sampled particles. Humidity can alter those properties, and liquid droplets from a fog cannon or direct spray can affect the measurement. A high reading immediately after spraying may reflect the altered sample environment; it is not automatically evidence that airborne dry dust increased. Conversely, a later decrease is not by itself a measured dust-removal efficiency.
Keep spraying times, wind changes and activity changes with the data. Protect the inlet from direct liquid entry while maintaining representative airflow. Avoid an arrangement where a monitor drives spraying that repeatedly wets its own sample path, creating a feedback problem. The appropriate separation depends on actual spray reach and airflow, not a universal distance copied into every construction specification.
Use a controlled replay or test input to check the window, threshold, persistence and clearing rules. Keep replayed values separate from production measurements. Confirm that a brief peak, a sustained event, a missing-data interval and a range-ceiling period produce the intended distinct outcomes. Test near a window boundary to expose off-by-one timing or duplicate-sample handling problems.
Where automatic suppression is included, a suitable PLC or controller operates the actuator. The sensor's RS485 measurement output is not a motor-control connection. Test equipment feedback, water availability and local authorization separately. A valid PM10 alarm and a successful network command do not demonstrate that a pump ran or that a nozzle delivered water where intended.
Do not derive environmental compliance from an operational alarm reset. Formal reporting can require a specified method, siting, averaging period, completeness rule and approved performance. A configurable IoT dashboard does not establish those conditions. For site supervision, retain the raw observations and processing settings so an unusual result can be examined rather than explained only by a screenshot of the final chart.
State the required raw-record interval, fixed or rolling windows, peak definition, missing-data treatment and retention period. Specify whether historical recalculation and local backfill are required, and identify the intended alarm recipient or controller. These are acquisition and software requirements in addition to the PM sensor. A large LED display does not imply that these functions exist.
For NiuBoL configuration review, provide the work activities, expected concentration range, site layout, nearby spray equipment, power and receiving system. Separate the optical instrument from weather channels, communications, storage and control hardware. Request an equivalent scope when comparing quotations; there is no sound fixed station price without knowing what processing and installed equipment the project requires.
Use the period required by the decision or reporting obligation. Short windows retain activity peaks; longer ones describe persistence but dilute brief events. Keep both when the project needs both, and identify them rather than presenting an unlabeled concentration.
No. Zero is a measured concentration, not a missing-data marker. Retain a validity state, calculate coverage and apply an agreed completeness rule. Filling gaps with zero biases averages downward and can suppress an operational alarm.
No. The physical sensor response, sample transport through the instrument and polling sequence all affect the observations. Verify event behavior with suitable comparison tests rather than equating request timing with instantaneous measurement.
Droplets, humidity changes, airflow changes or concurrent dust activity can affect the optical result. Inspect the sample environment and event timing before attribution. Do not erase the period or automatically apply an unverified humidity correction.
No. PM10 already includes the finer fraction. If the project needs TSP, specify an appropriate measurement channel and method rather than inventing one from the sum of two overlapping size fractions.
Verify channel mapping, timing, reproducible averages, coverage handling, outage recovery and intended alarm behavior. If control is included, accept its actuator and safety functions separately. Keep measurement and reporting-method requirements explicit.
A dust monitor averaging period is part of the measurement specification, not a cosmetic chart setting. Combine NBL-W-PM observations with documented window calculations, visible data gaps and site context. This gives construction and industrial-yard teams useful event records without converting a short-term trigger into a legal conclusion or a spraying response into an unsupported removal claim.
Related recommendations
Sensors & Weather Stations Catalog
 Agriculture Sensors and Weather Stations Catalog-NiuBoL.pdf
Weather Stations Catalog-NiuBoL.pdf
Agriculture Sensors Catalog-NiuBoL.pdf
Water Quality Sensor Catalog-NiuBoL.pdf
Related products
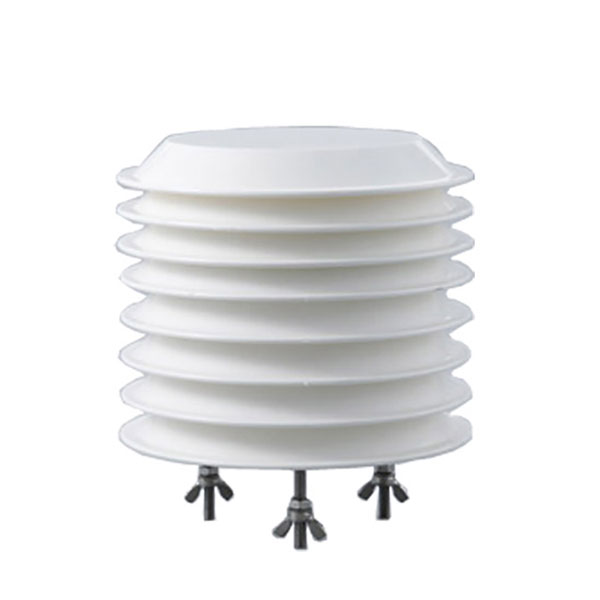 Combined air temperature and relative humidity sensor
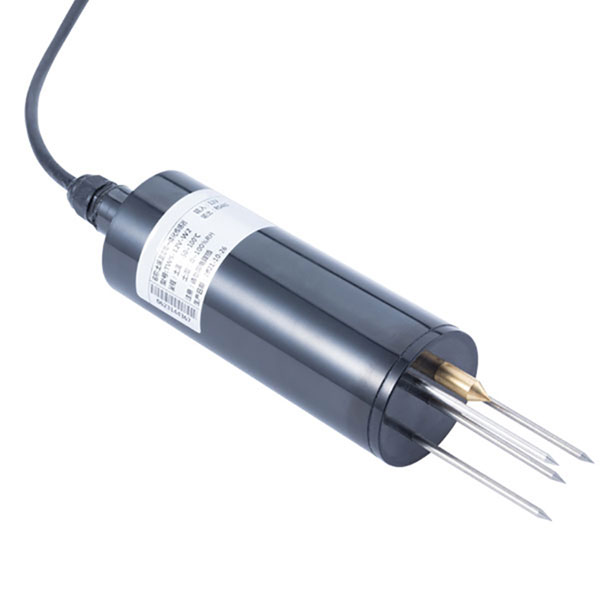 TDR Soil Moisture & Temperature Sensor for irrigation| RS485 |4-20mA| NBL-S-THR
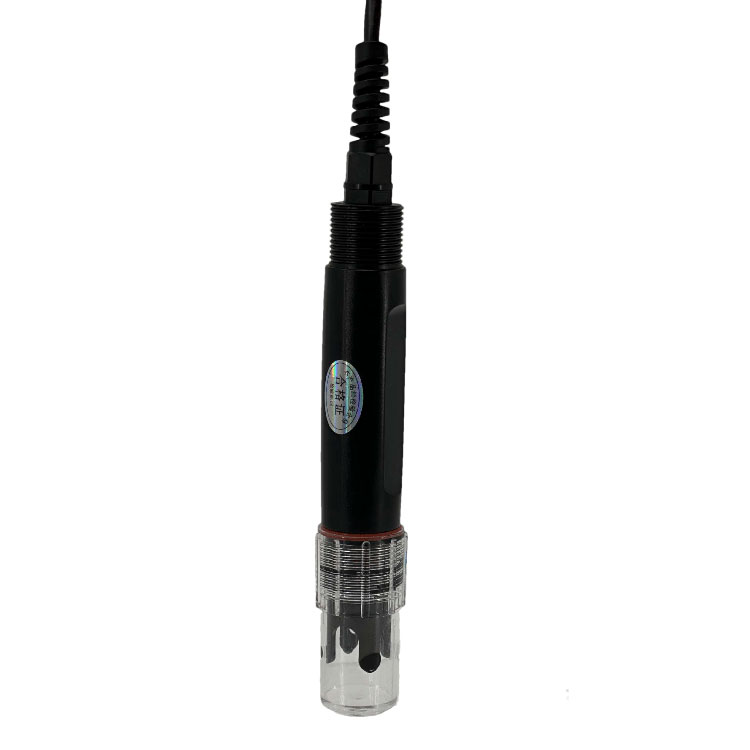 Soil pH sensor RS485 soil Testing instrument soil ph meter for agriculture |NBL-S-PH
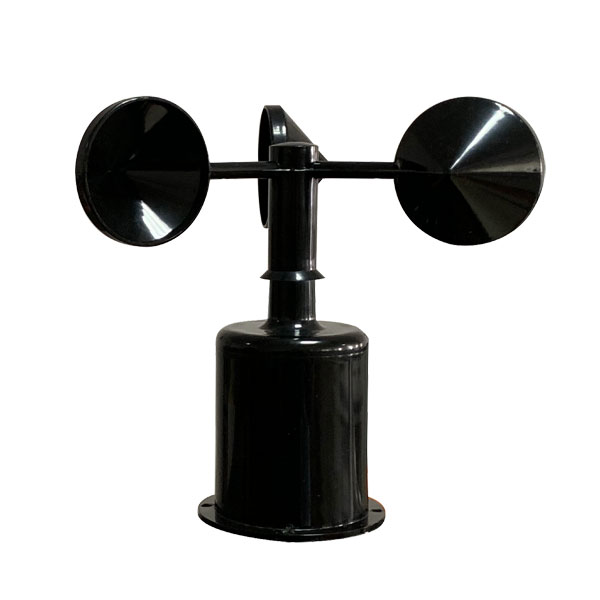 Wind Speed sensor Output Modbus/RS485/Analog/0-5V/4-20mA
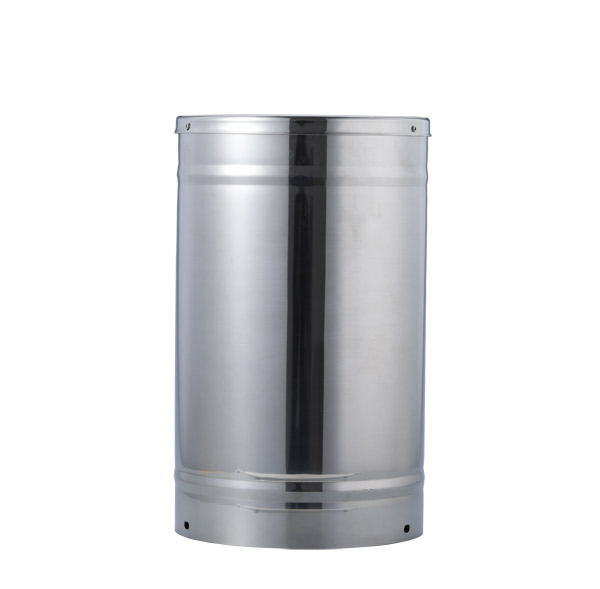 Tipping bucket rain gauge for weather monitoring auto rainfall sensor RS485/Outdoor/stainless steel
 Pyranometer Solar Radiation Sensor 4-20mA/RS485


Screenshot, WhatsApp to identify the QR code
WhatsApp number:+8615367865107
(Click on WhatsApp to copy and add friends)