

— Blogs —
—Products—
 Consumer hotline +8618073152920
WhatsApp:+8615367865107
Address:Room 102, District D, Houhu Industrial Park, Yuelu District, Changsha City, Hunan Province, China
Product knowledge
Time:2026-02-03 11:46:41 Popularity:619
Quick Answer: Compact PV weather stations help an O&M team compare generation with the environmental conditions at a solar plant. The useful configuration normally starts with representative irradiance and module temperature observations, synchronized with plant energy records. Wind, ambient conditions, rain and a dedicated soiling channel add context where required. A weather station does not identify every loss mechanism, certify tracker protection or guarantee additional generation.
A low daily energy total can reflect cloud, equipment unavailability, clipping, curtailment, heat, shading or contamination. Buying more weather channels will not separate these explanations unless the plant also records the relevant electrical and operating data. For PV weather station O&M, define the investigation first: compare blocks, explain a temperature-related deviation, review a cleaning decision or check whether the irradiance reference itself is reliable.
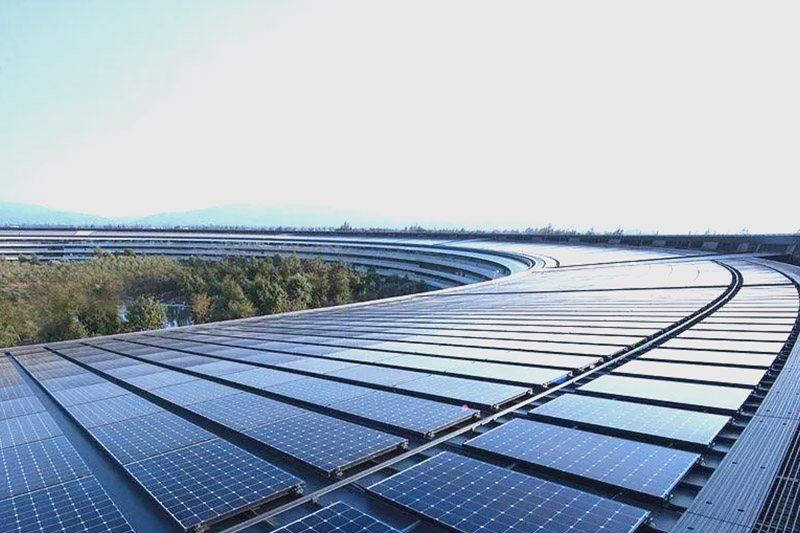
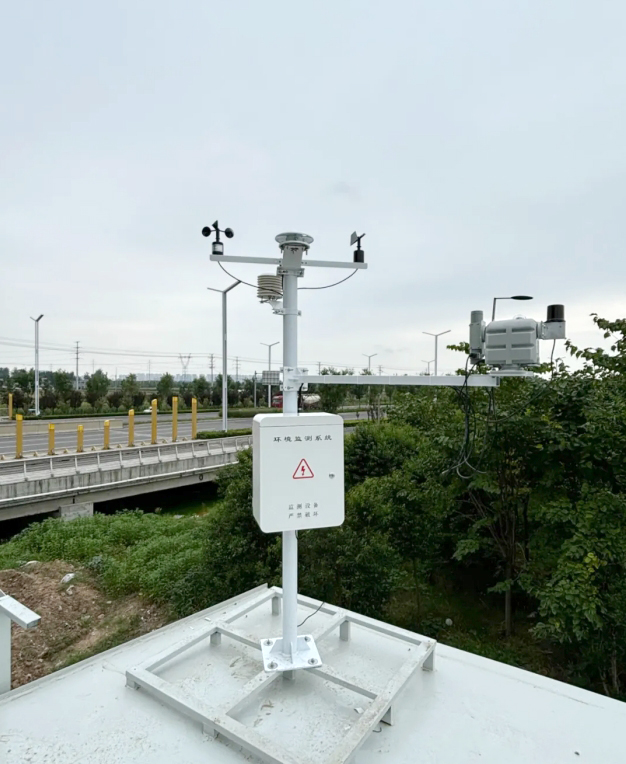
For rooftop PV monitoring, a nearby wall, parapet or taller building can shade a sensor differently from the modules. On a larger site, one instrument may not represent different terrain, orientations or weather across the array. Select observation locations according to the plant's geometry and the required comparison, not simply where a communication cabinet is available. There is no universal number of stations per installed megawatt.
| Observed concern | Useful environmental input | Additional record needed |
|---|---|---|
| Low generation during changing cloud | Representative irradiance with matching timestamps | Power or energy at the same boundary and interval |
| Hot modules and reduced output | Module backsheet temperature and irradiance | Applicable module coefficients and operating state |
| Possible contamination loss | Dedicated soiling observations, rain and inspection | Cleaning dates, cost and generation comparison |
| High-wind operation | Wind observations at the required exposure | Approved tracker or plant operating rules |
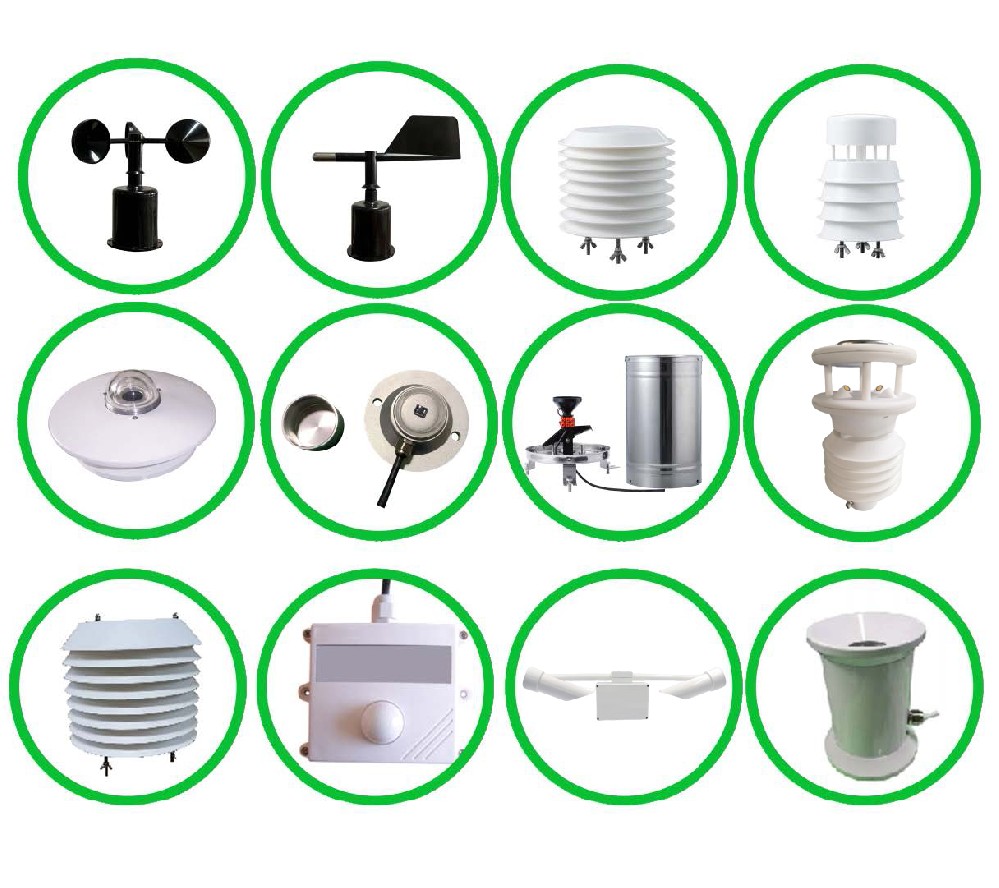
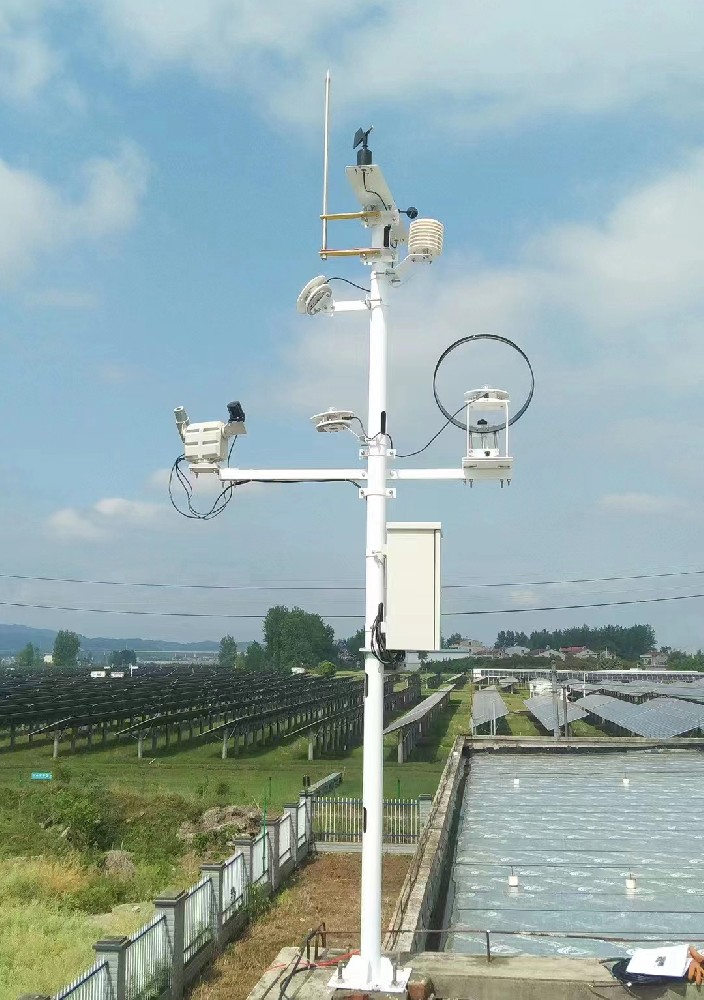
NiuBoL can configure separate instruments or an integrated weather assembly with additional PV-specific sensors. A compact weather head does not automatically contain a plane-of-array pyranometer, a backsheet contact probe or a soiling instrument. Keep those channels explicit in the equipment list rather than treating a five- or seven-element label as a complete PV performance measurement package.
Global horizontal irradiance describes radiation on a horizontal plane. Plane-of-array irradiance describes radiation incident on the module plane. They cannot be substituted merely because both use W/m2. For a fixed array, match the sensor's tilt and azimuth to the plane being assessed. For multiple roof orientations, decide which plane each measurement represents and identify it in SCADA.
For a tracking plant, the monitoring method must account for changing orientation. An instrument fixed horizontally does not directly measure the tracker plane throughout the day. The Sandia PV Performance Modeling Collaborative's POA irradiance guidance explains the plane distinction. Whether the project measures or models that plane, retain the method and geometry with the resulting data.
Keep the irradiance sensor clear of transient shading from masts, cables and adjacent instruments. Inspect shading over the relevant sun positions, not only at midday during installation. Clean and inspect the reference instrument according to its condition and the performance-monitoring plan. A dirty reference can under-report incoming energy and make plant performance look artificially favorable.
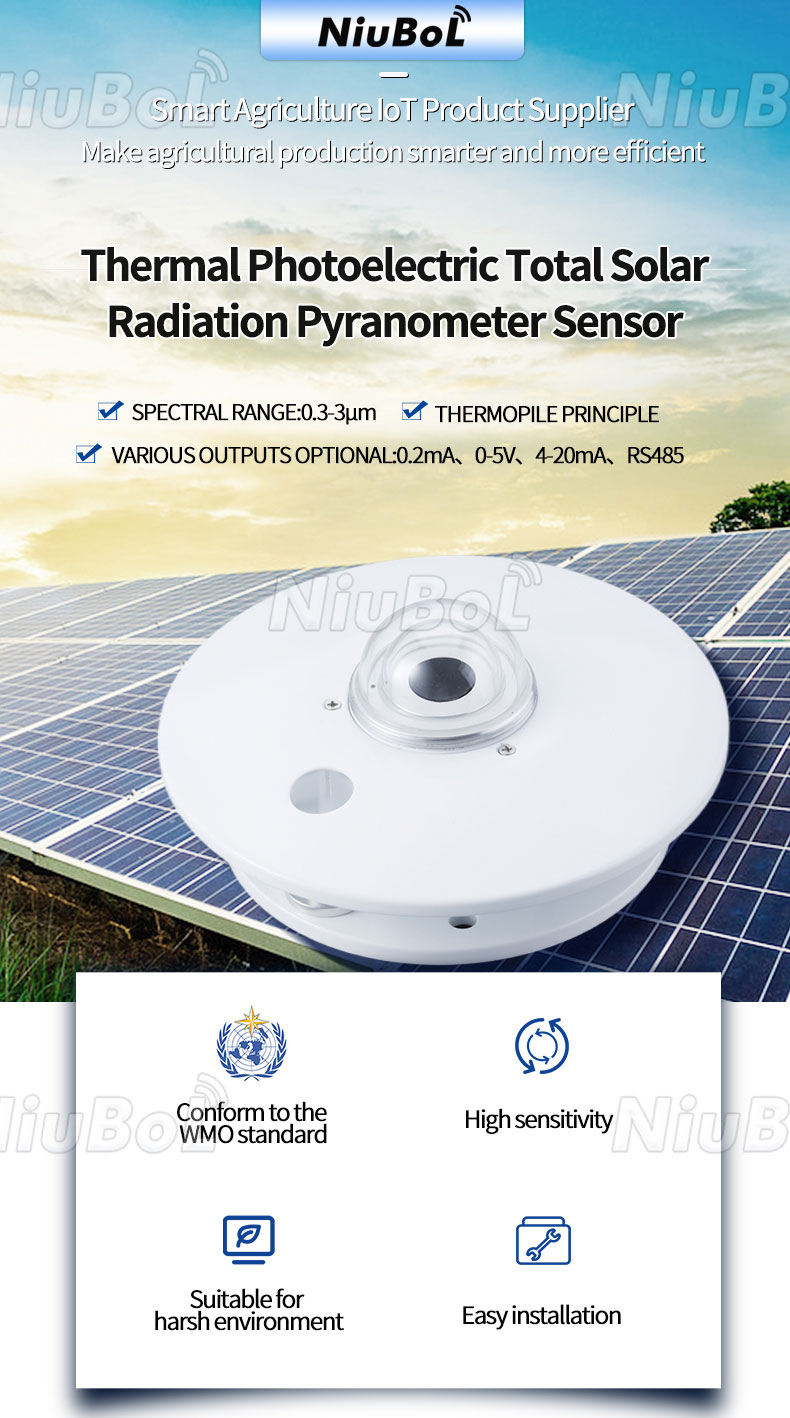
The following are examples of NiuBoL sensor configurations that can contribute to compact PV weather stations. Their limits remain separate: the operating temperature of a backsheet probe does not extend a pyranometer's operating range, and a sensor's output choice does not establish the communication functions of the complete station.
| Channel | Configuration-specific figures | O&M implication |
|---|---|---|
| NBL-W-HPRS thermopile irradiance | 0-2000 W/m2; spectral interval 0.3-3 um; response no more than 35 seconds to 99%; operating temperature -40 to +50 degrees C | Preserve orientation and response meaning. Annual stability of no more than +/-2% is not total measurement accuracy. |
| HPRS electrical connection | 12 V or 24 VDC versions; RS485, 4-20 mA or 0-5 V output selections; 2.5 m standard cable | Match the ordered output and calibration factor to the receiving channel. |
| NBL-W-PPT contact temperature | -50 to +100 degrees C or -20 to +50 degrees C range options; +/-0.5 degrees C accuracy; 0.15 W sensor figure; 5 m standard cable | State the range, supply and output version. Bond quality affects whether the reading represents the backsheet. |
| Optional NBL-W-PSS soiling channel | 12 VDC; RS485 / Modbus; 9600 baud; 1 W average power | Use its optical soiling indication with representative placement and a defined cleaning routine. |
| Separate NBL-W-SS / NBL-W-DS wind instruments | Wind speed and direction are separate channels; IP65 housings | Confirm output, measuring range and site exposure. IP65 does not establish an anti-icing or safety-control function. |
| Power, protection and cabling for the station | Logger, modem, enclosure, connectors and cable jackets selected for the site | Obtain the configured power budget and environmental limits; no single sensor rating describes the whole assembly. |
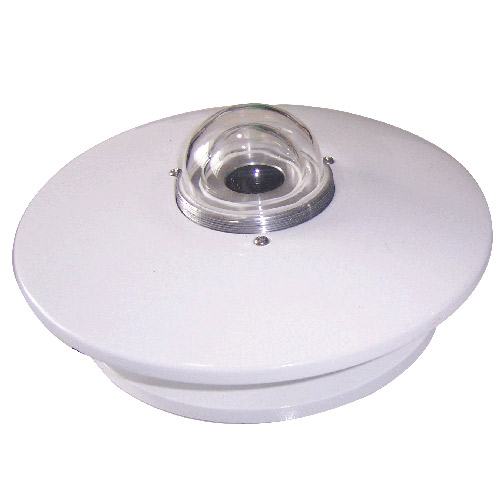
The NBL-W-HPRS pyranometer can measure the solar radiation incident on its selected plane. Its glass-covered thermopile construction should not be described as a measurement of every longwave radiation component. A claimed instrument class or a plant monitoring compliance level also needs the applicable specification and evidence; it is not established by the word pyranometer alone.
Use a repeatable attachment position and a suitable thermal bond on the module backsheet, following module and sensor installation requirements. Support the cable independently so wind and servicing do not peel the contact point away. Do not substitute a shaded air-temperature probe for a backsheet measurement. Record which module and array section the contact probe represents.
A detached probe may continue returning a plausible temperature while responding more to air than to the module. Compare its daily pattern with irradiance and adjacent observations, then inspect the bond before treating a changed trend as improved cooling. Different module constructions and mounting arrangements can need separate representative points. One convenient module near a roof edge may have different ventilation from the rest of the roof.
Use the applicable module coefficient when evaluating temperature effects; do not apply one universal percentage loss per degree to all modules. Backsheet temperature is also not automatically cell temperature. A performance model may estimate the relationship, but that assumption must remain distinct from the measured channel.
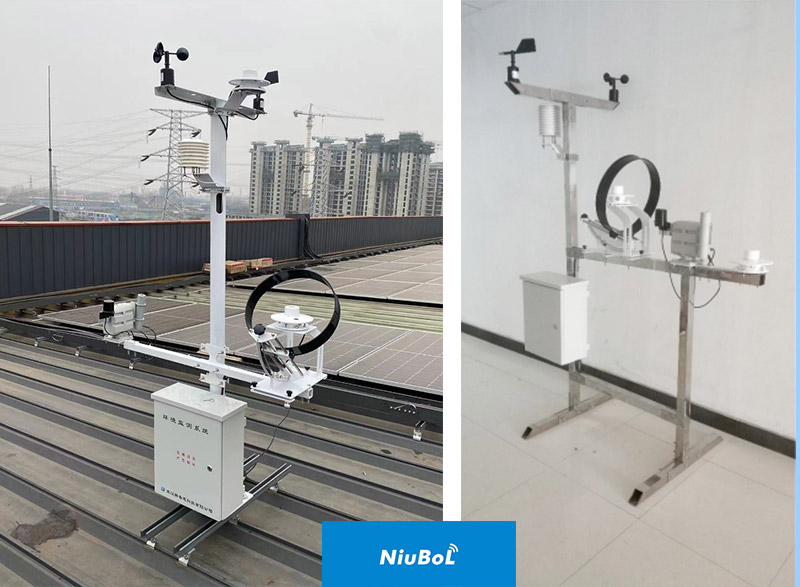
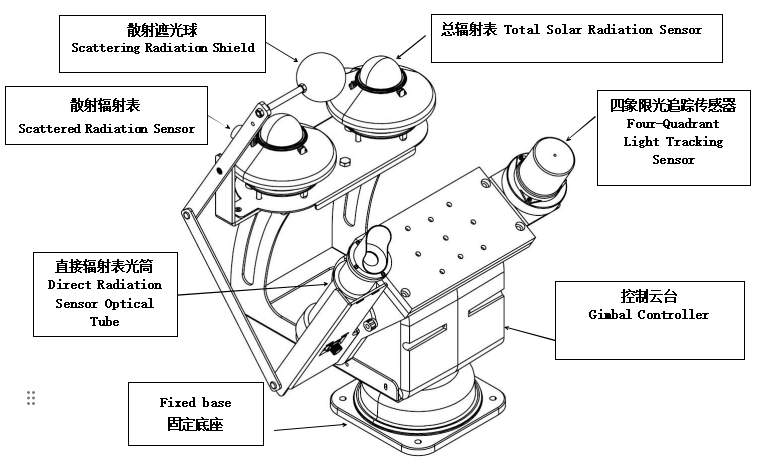
Separate global, diffuse and direct-radiation instruments can support resource characterization and more detailed modeling. The tracking assembly shown below illustrates that arrangement. A sun-pointing direct-radiation channel is not the same thing as a sensor following the PV module plane. Specify the required radiation quantity before choosing this more involved system; routine rooftop monitoring may not need all three components.
For RS485 / Modbus RTU channels, confirm the address, register map, signed values, scaling, serial settings and polling limits of each selected instrument. An inverter's RS485 port may have a specific protocol role and cannot automatically poll every environmental sensor. An intermediate data logger can perform acquisition where its actual software supports the required devices.
Agree the interval represented by each record. A one-minute mean irradiance cannot be compared fairly with an unrelated instantaneous power reading during fast cloud changes. Store valid sample counts or another coverage measure and keep missing measurements distinct from zero. Communication polling speed also does not remove the sensor's physical response time.
Convert irradiance to irradiation using the time interval and consistent units before making energy-normalized comparisons. As an illustrative daily calculation, 4000 kWh of AC energy from 1000 kWp of rated DC capacity gives a final yield of 4 hours. With 5 kWh/m2 of POA irradiation and a 1 kW/m2 reference irradiance, the reference yield is 5 hours and the performance ratio is 0.80. This is arithmetic, not a NiuBoL plant result or a universal acceptance value.
That ratio alone does not identify a failed inverter, degradation or soiling. Metering boundary, curtailment, availability, temperature and irradiance quality can all affect interpretation. Keep alarm and operating records beside the environmental trend rather than labeling every ratio reduction a module fault.
| Pattern | Possible explanation | Useful next check |
|---|---|---|
| Irradiance rises but one inverter's power stays low | Availability, clipping, control limits or an electrical issue | Inspect inverter status and comparable electrical channels before blaming weather. |
| One irradiance channel changes after service | Cleaning, changed tilt, altered scaling or instrument replacement | Compare service records, geometry and reference checks. |
| Module temperature loses its normal daytime response | Detached contact, shade, wiring or a mapping fault | Inspect the contact point and compare local and SCADA values. |
| Rain occurs but production does not recover as expected | Incomplete cleaning or a different loss mechanism | Inspect surfaces and soiling observations; rainfall alone does not quantify cleaning. |
For cleaning decisions, use a dedicated soiling measurement with a clear operating basis. NBL-W-PSS uses an optical measurement of contamination effects on its sensing surface. It is not a particle mass measurement, a backsheet temperature-difference algorithm or proof that every module has the same contamination. Keep its exposure and cleaning history representative of the assessed array.
For utility-scale solar monitoring, a pilot should demonstrate observation quality and a realistic service routine before adding more stations. Check irradiance geometry, temperature attachment, channel units, outages and the local-to-SCADA path. Network options must be selected and tested individually; an RS485 sensor does not inherently provide 4G, 5G or LoRaWAN connectivity.
A NiuBoL inquiry is most useful when it identifies the array arrangement, monitoring purpose, existing SCADA inputs, required channels, cable routes and service access. Include whether the station is an O&M reference or part of a separately specified protection system. That distinction determines the appropriate equipment and acceptance work.
Only if its measurements cover the defined task. Integrated air and wind channels do not replace separate POA irradiance, module temperature or soiling measurements. Check the actual channel list and whether one observation point represents the relevant arrays.
Not as a direct substitute. The planes differ. Use a suitably oriented measurement or a defined transposition method with the required inputs. Label the result as measured or modeled and retain the array geometry.
No. It helps separate environmental conditions from some operating explanations. Diagnosis still needs electrical measurements, availability, control states and inspection. A low performance ratio is a starting point for investigation, not a unique fault code.
No. Cleaning depends on the contamination, rain characteristics and surfaces involved. Inspect the array and review the soiling channel before postponing cleaning solely because a rain gauge recorded precipitation.
Use the tracker manufacturer's approved input and control requirements. A general weather channel is not automatically suitable for a protective function. Confirm exposure, timing, fault handling and the approved controller separately from performance monitoring.
Demonstrate the actual channel geometry and attachment, correct local and SCADA values, synchronized intervals, missing-data behavior and recovery after a controlled interruption. Agree calibration evidence and service access for the selected instruments rather than accepting a generic complete-station claim.
Compact PV weather stations add O&M value when their measurements answer a defined plant question. Match irradiance to the array plane, secure module temperature contacts, keep soiling as a separate measurement and compare synchronized records. Select NiuBoL channels around those tasks instead of treating a compact enclosure or a large parameter count as evidence of a complete diagnosis system.
 NBL-W-SRS-Solar-radiation-sensor-instruction-manual-V4.0.pdf
NBL-W-HPRS-Solar-Radiation-Sensor-Instruction-Manual-V3.0.pdf
NBL-W-PSS Soiling Sensor Photovoltaic Dust Monitoring Instrument Data Sheet.pdf
Prev:Dust Monitor Averaging Period: Peaks, Gaps and Site Alarms
Next:Agricultural Weather Station Model Inputs: Units and Exposure
Related recommendations
Sensors & Weather Stations Catalog
Agriculture Sensors and Weather Stations Catalog-NiuBoL.pdf
Weather Stations Catalog-NiuBoL.pdf
Agriculture Sensors Catalog-NiuBoL.pdf
Water Quality Sensor Catalog-NiuBoL.pdf
Related products
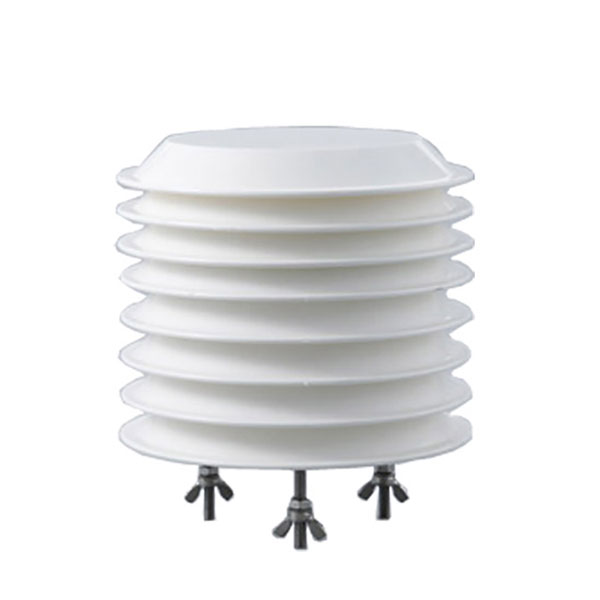 Combined air temperature and relative humidity sensor
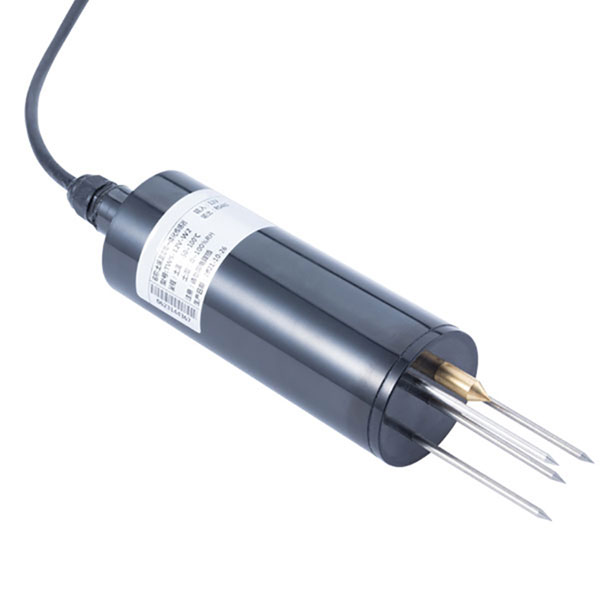 TDR Soil Moisture & Temperature Sensor for irrigation| RS485 |4-20mA| NBL-S-THR
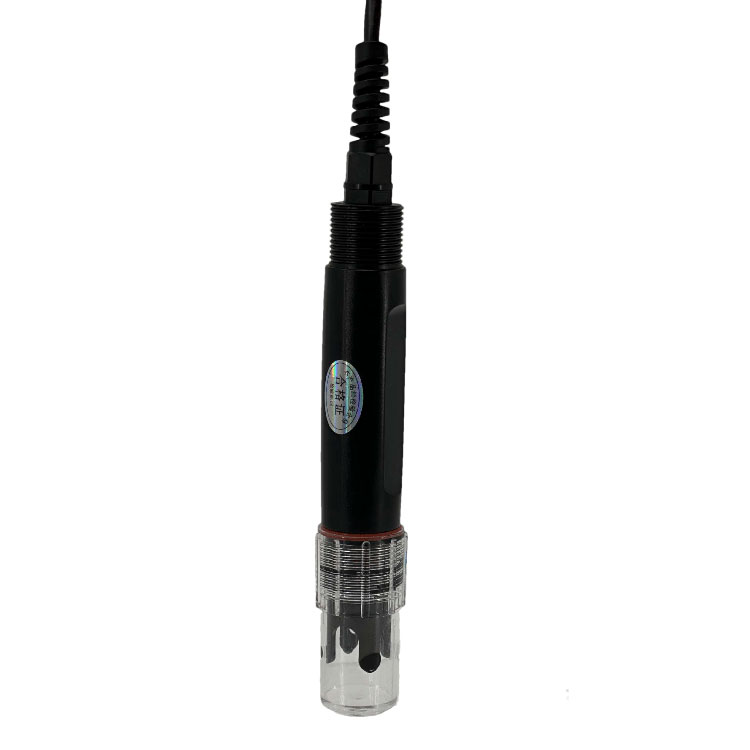 Soil pH sensor RS485 soil Testing instrument soil ph meter for agriculture |NBL-S-PH
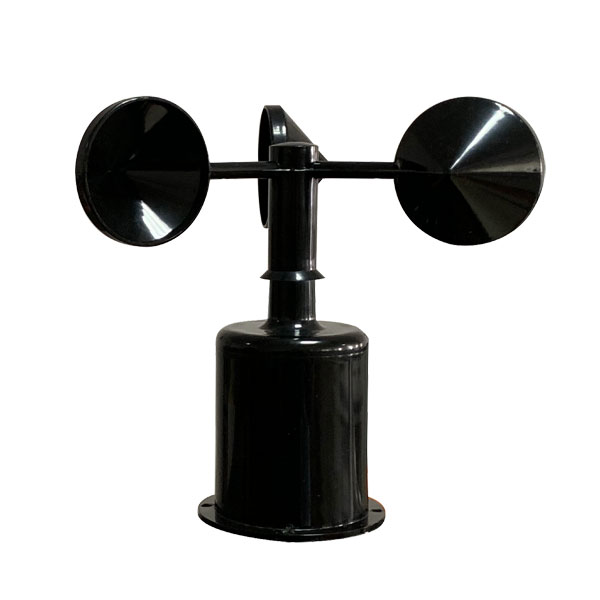 Wind Speed sensor Output Modbus/RS485/Analog/0-5V/4-20mA
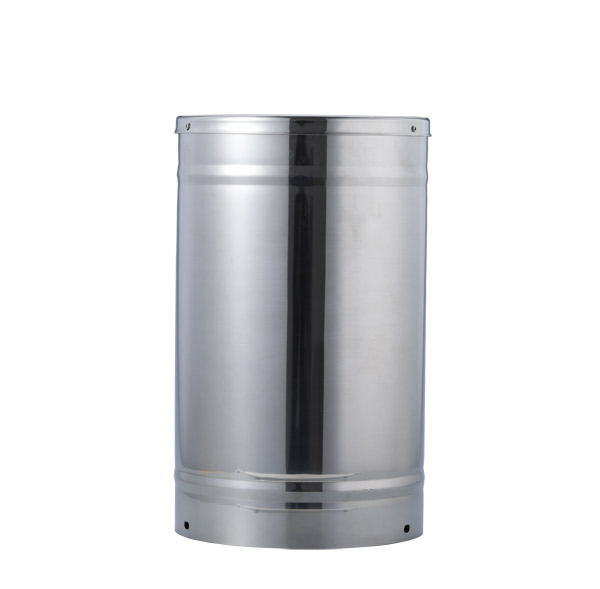 Tipping bucket rain gauge for weather monitoring auto rainfall sensor RS485/Outdoor/stainless steel
 Pyranometer Solar Radiation Sensor 4-20mA/RS485


Screenshot, WhatsApp to identify the QR code
WhatsApp number:+8615367865107
(Click on WhatsApp to copy and add friends)