





— Blogs —
—Products—
 Consumer hotline +8618073152920
WhatsApp:+8615367865107
Address:Room 102, District D, Houhu Industrial Park, Yuelu District, Changsha City, Hunan Province, China
Product knowledge
Time:2025-10-13 17:22:31 Popularity:1069
Quick Answer: Climate change affects agricultural sensor demand by changing which local conditions farms need to observe and how equipment must survive them. Heat exposure, irregular water availability and damaging rainfall create different measurement tasks. A useful monitoring specification connects each risk to an observation and a management response. It should not promise that installing sensors prevents crop losses or that one farm's recent weather establishes a climate trend.
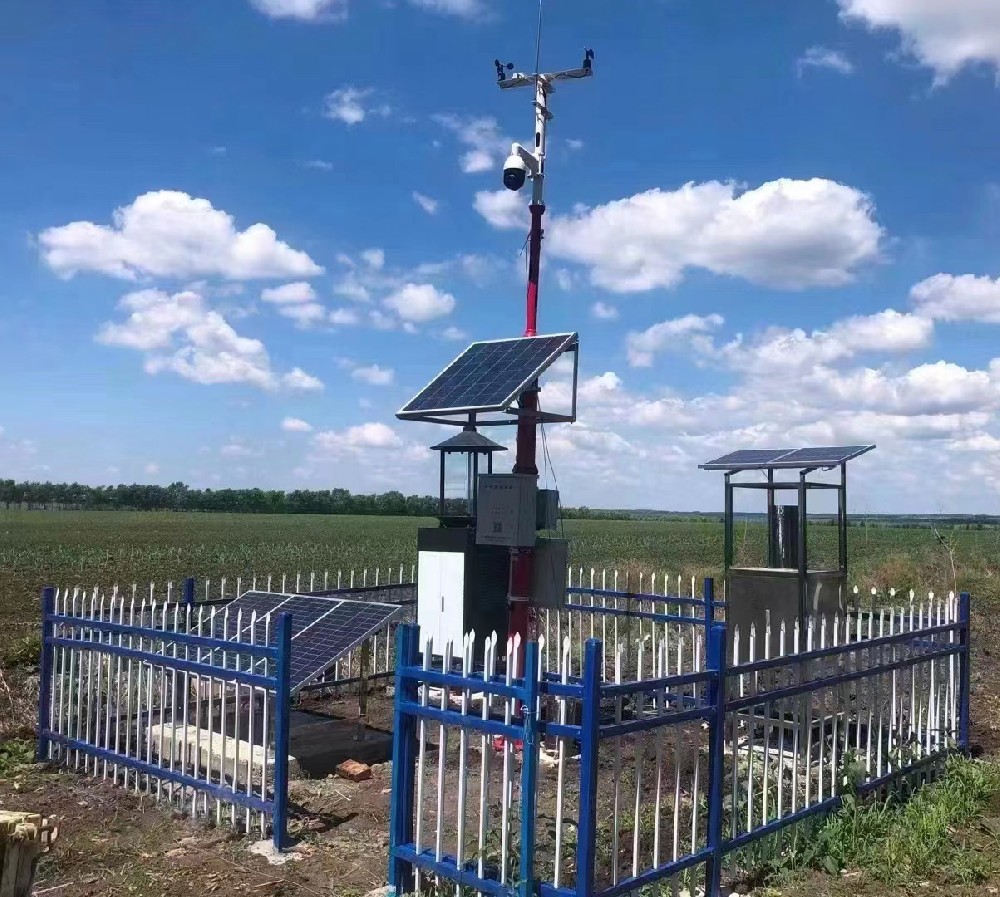
A farm facing repeated hot, dry periods may need better information about root-zone water and evaporative demand. A low-lying site may instead need rainfall and water-level records to identify drainage problems. The equipment lists overlap, but the decisions are different. Start with the event that causes an operational problem and the information missing when it happens.
Climate information and field observations have different time scales. Regional assessments help examine future exposure; a station records conditions at its location. Local measurements can support adaptation planning, but a few seasons of observations do not independently attribute an event to climate change. Changing crops, irrigation, buildings and instrument exposure can also change a farm record.
Sensor demand therefore concerns more than adding channels. Buyers need measurement continuity during adverse weather, accessible maintenance and a way to distinguish a real event from an instrument fault. A larger dashboard does not solve those issues unless the installed points represent the conditions that matter.
Air temperature describes the surrounding environment when it is measured with suitable shielding and ventilation. A sensor exposed directly to sunlight can read the heating of its housing instead. Compare positions and shields before interpreting a hotter reading as a crop problem.
Canopy temperature adds a different observation. It depends on the viewed leaves, viewing angle, radiation and water status. A fixed canopy-to-air difference is not a universal heat-stress threshold. An index such as CWSI requires an appropriate baseline and method; subtracting two temperatures alone does not establish it.
Link the observation to an action the site can actually perform. A greenhouse with controllable vents has different options from an open orchard with limited water. Test the response and its constraints, including whether misting is suitable for the crop and humidity conditions. A temperature alert cannot guarantee that cooling equipment operated or that damage was avoided.
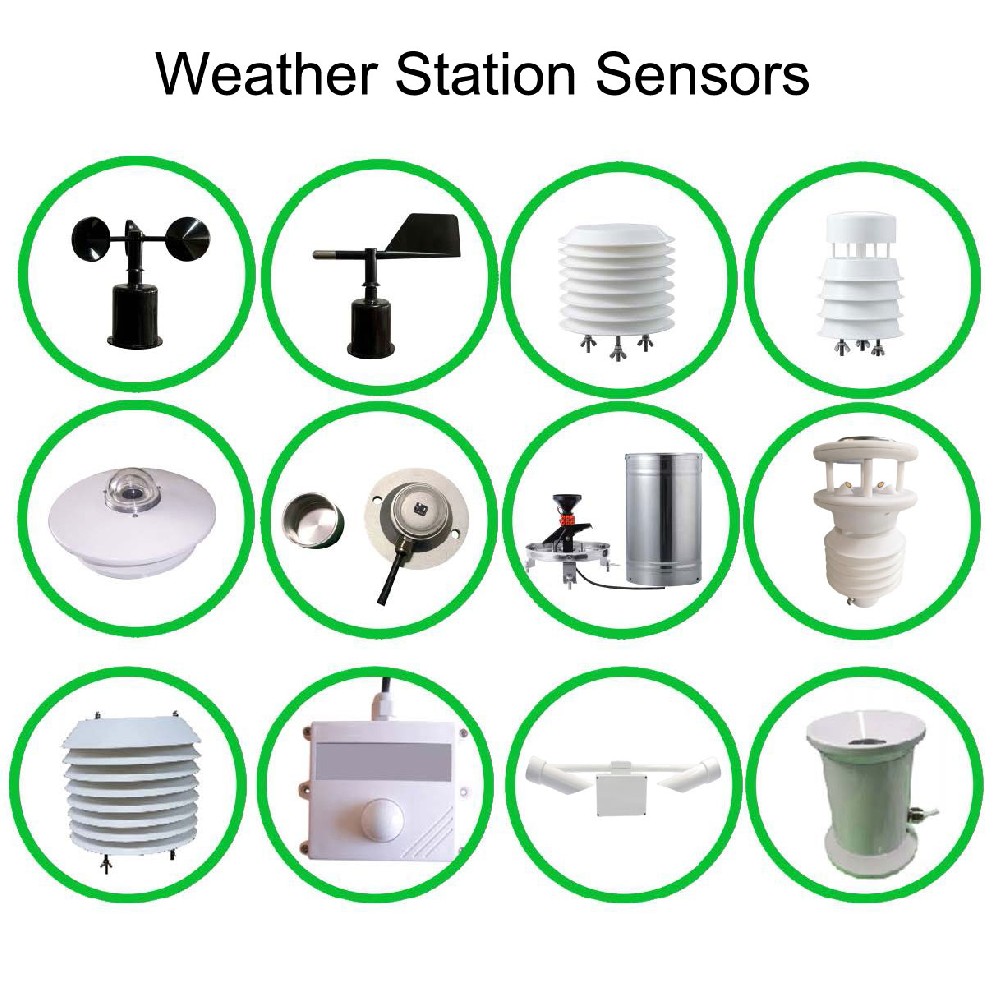
Rainfall and soil moisture answer different questions. Rain at a collector does not show how much water entered the active root zone, while one wet probe does not describe the whole field. Select depths and locations from the crop, soil profile and irrigation pattern rather than prescribing the same 60-100 cm arrangement everywhere.
A profile can show whether wetting reaches a deeper layer and whether that layer dries between irrigations. It cannot turn a single moisture percentage into a universal drought classification. Texture, salinity, installation contact and the relation between water content and plant availability affect interpretation.
| Measurement option | Relevant technical detail | Application limit |
|---|---|---|
| NBL-S-THR soil moisture | 0-100%; stated accuracy +/-3%; resolution 0.1%. | Relate the result to the local soil and installation; it is not an automatic irrigation threshold. |
| NBL-S-THR soil temperature | -50 to +100 degrees C measurement span; +/-0.5 degrees C. | The complete instrument operating environment is -40 to +80 degrees C. |
| Power and outputs | 12-24 V DC; approximately 0.3 W; RS485 Modbus RTU, 4-20 mA or 0-5 V versions. | Match the ordered version to the logger input and power budget. |
| Field protection | IP68 for the probe; specify cable length, jacket and termination. | A protected probe does not make an exposed connector or logger suitable for flooding. |
For scale, an illustrative uniform 0.04 m3/m3 water-content change through a 300 mm layer represents 12 mm of stored water. This is a storage calculation, not an irrigation dose or a recommended target. Nonuniform wetting, root distribution and application losses need separate treatment before using it for scheduling.
Reference evapotranspiration, ETo, describes a defined reference surface. Crop water use requires further interpretation, including crop and stage. The FAO Penman-Monteith method uses meteorological inputs and a defined reference surface. Radiation, temperature, humidity and appropriately referenced wind are important inputs; quantities such as net radiation and soil heat flux must be measured or estimated as the calculation requires.
Do not assume a purchased weather station calculates ETo merely because it has several sensors. Confirm the implemented method, units, measurement heights and handling of missing observations. A radiation signal in W/m2 also needs the correct time integration if the calculation expects energy over a period.
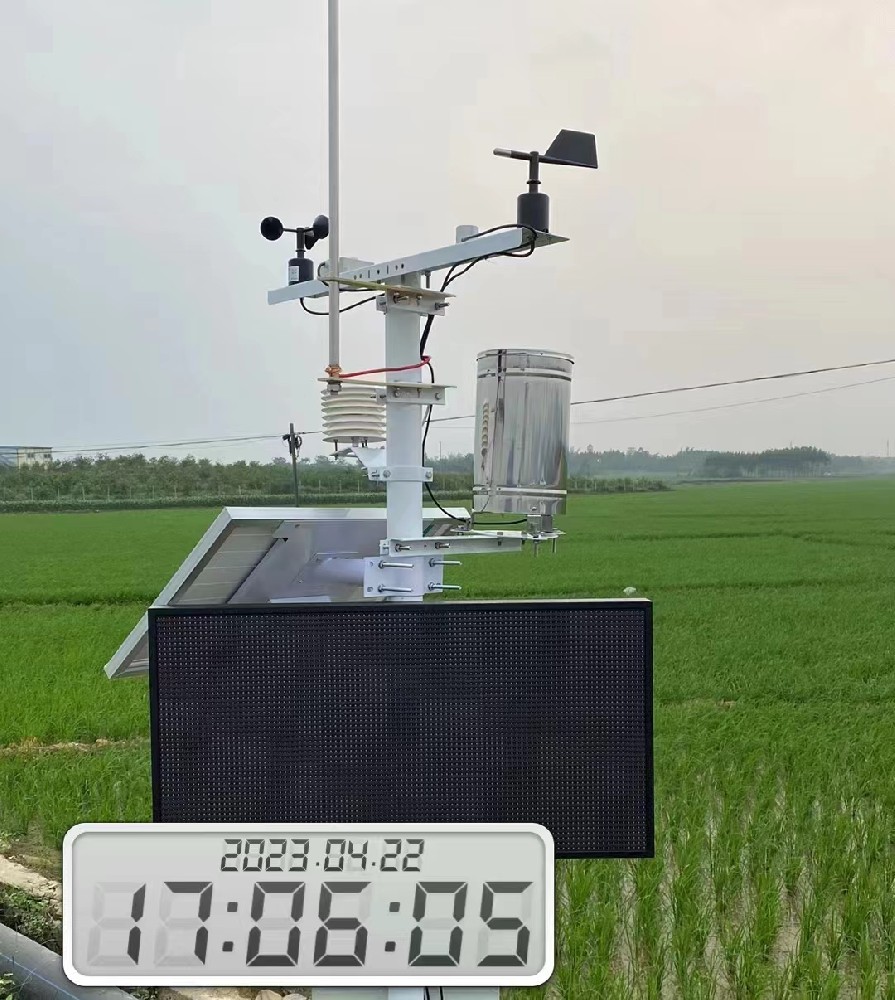
A tipping-bucket collector records accumulated precipitation in increments. Deriving intensity requires an appropriate counting interval or tip timing; a daily total cannot reconstruct a short burst. Confirm which statistic the logger retains if drainage or erosion assessment needs event detail.
Runoff and flooding also depend on infiltration, slope, surface cover, drainage and upstream contributions. Rainfall plus one soil probe is not a complete flood forecast. Add suitable water-level observations where an actual rising-water condition must be detected, and use a validated warning method where advance warning is required.
Inspect exposure after storms. A tilted collector, blocked funnel or damaged cable can create a measurement change at the same time as a real weather event. Keep the interruption visible in the record. Missing rainfall data must not be replaced with a measured zero simply to keep a report continuous.
An environmental range is a limit for a particular instrument, not a guarantee shared by the whole station. Check expected air temperature, solar heating inside enclosures, condensation and the exposure of cable joints. A shaded ambient maximum can be lower than the temperature of an enclosure in direct sun.
For NBL-W-SS wind speed and NBL-W-DS wind direction instruments, specify IP65. That rating does not establish resistance to every chemical, salt deposit or ultraviolet exposure, and it is not a permission for immersion. Check mounting, fasteners and electrical entries for the actual site.
A heat or storm adaptation project also needs power continuity. Include the logger, radio and any heating or active ventilation in the load assessment. A long-range radio claim does not establish energy autonomy, and a large battery does not establish that the solar array can recharge it in the limiting season.
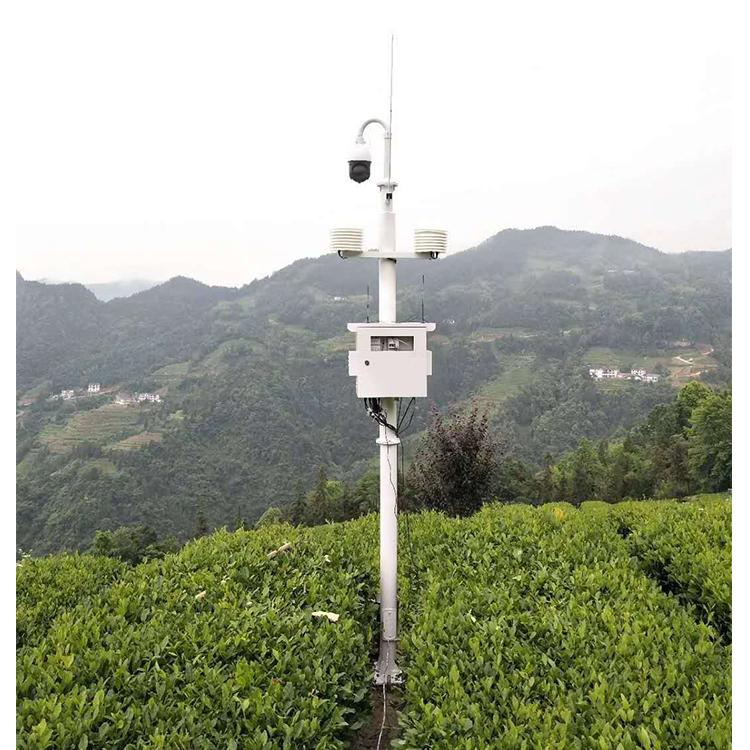
Weather observations can help interpret changes in insect catches or disease-conducive conditions. They do not identify the cause of damaged leaves by themselves. Pair a pest monitoring record with appropriate field scouting and a suitable interpretation method.
For multi-site comparisons, retain instrument height, soil depth and any relocation date. An apparent regional difference may instead reflect a collector beside a building or a soil probe beside an emitter. Establish comparable observations before attributing differences to climate or using them to change a planting recommendation.
When discussing a monitoring project with NiuBoL, describe the risk, decisions, exposure and existing equipment. A channel list should explain what each point contributes. Avoid requesting a universal climate-adaptation package: some sites need a reference weather record, others a soil profile, drainage observation or a combination.
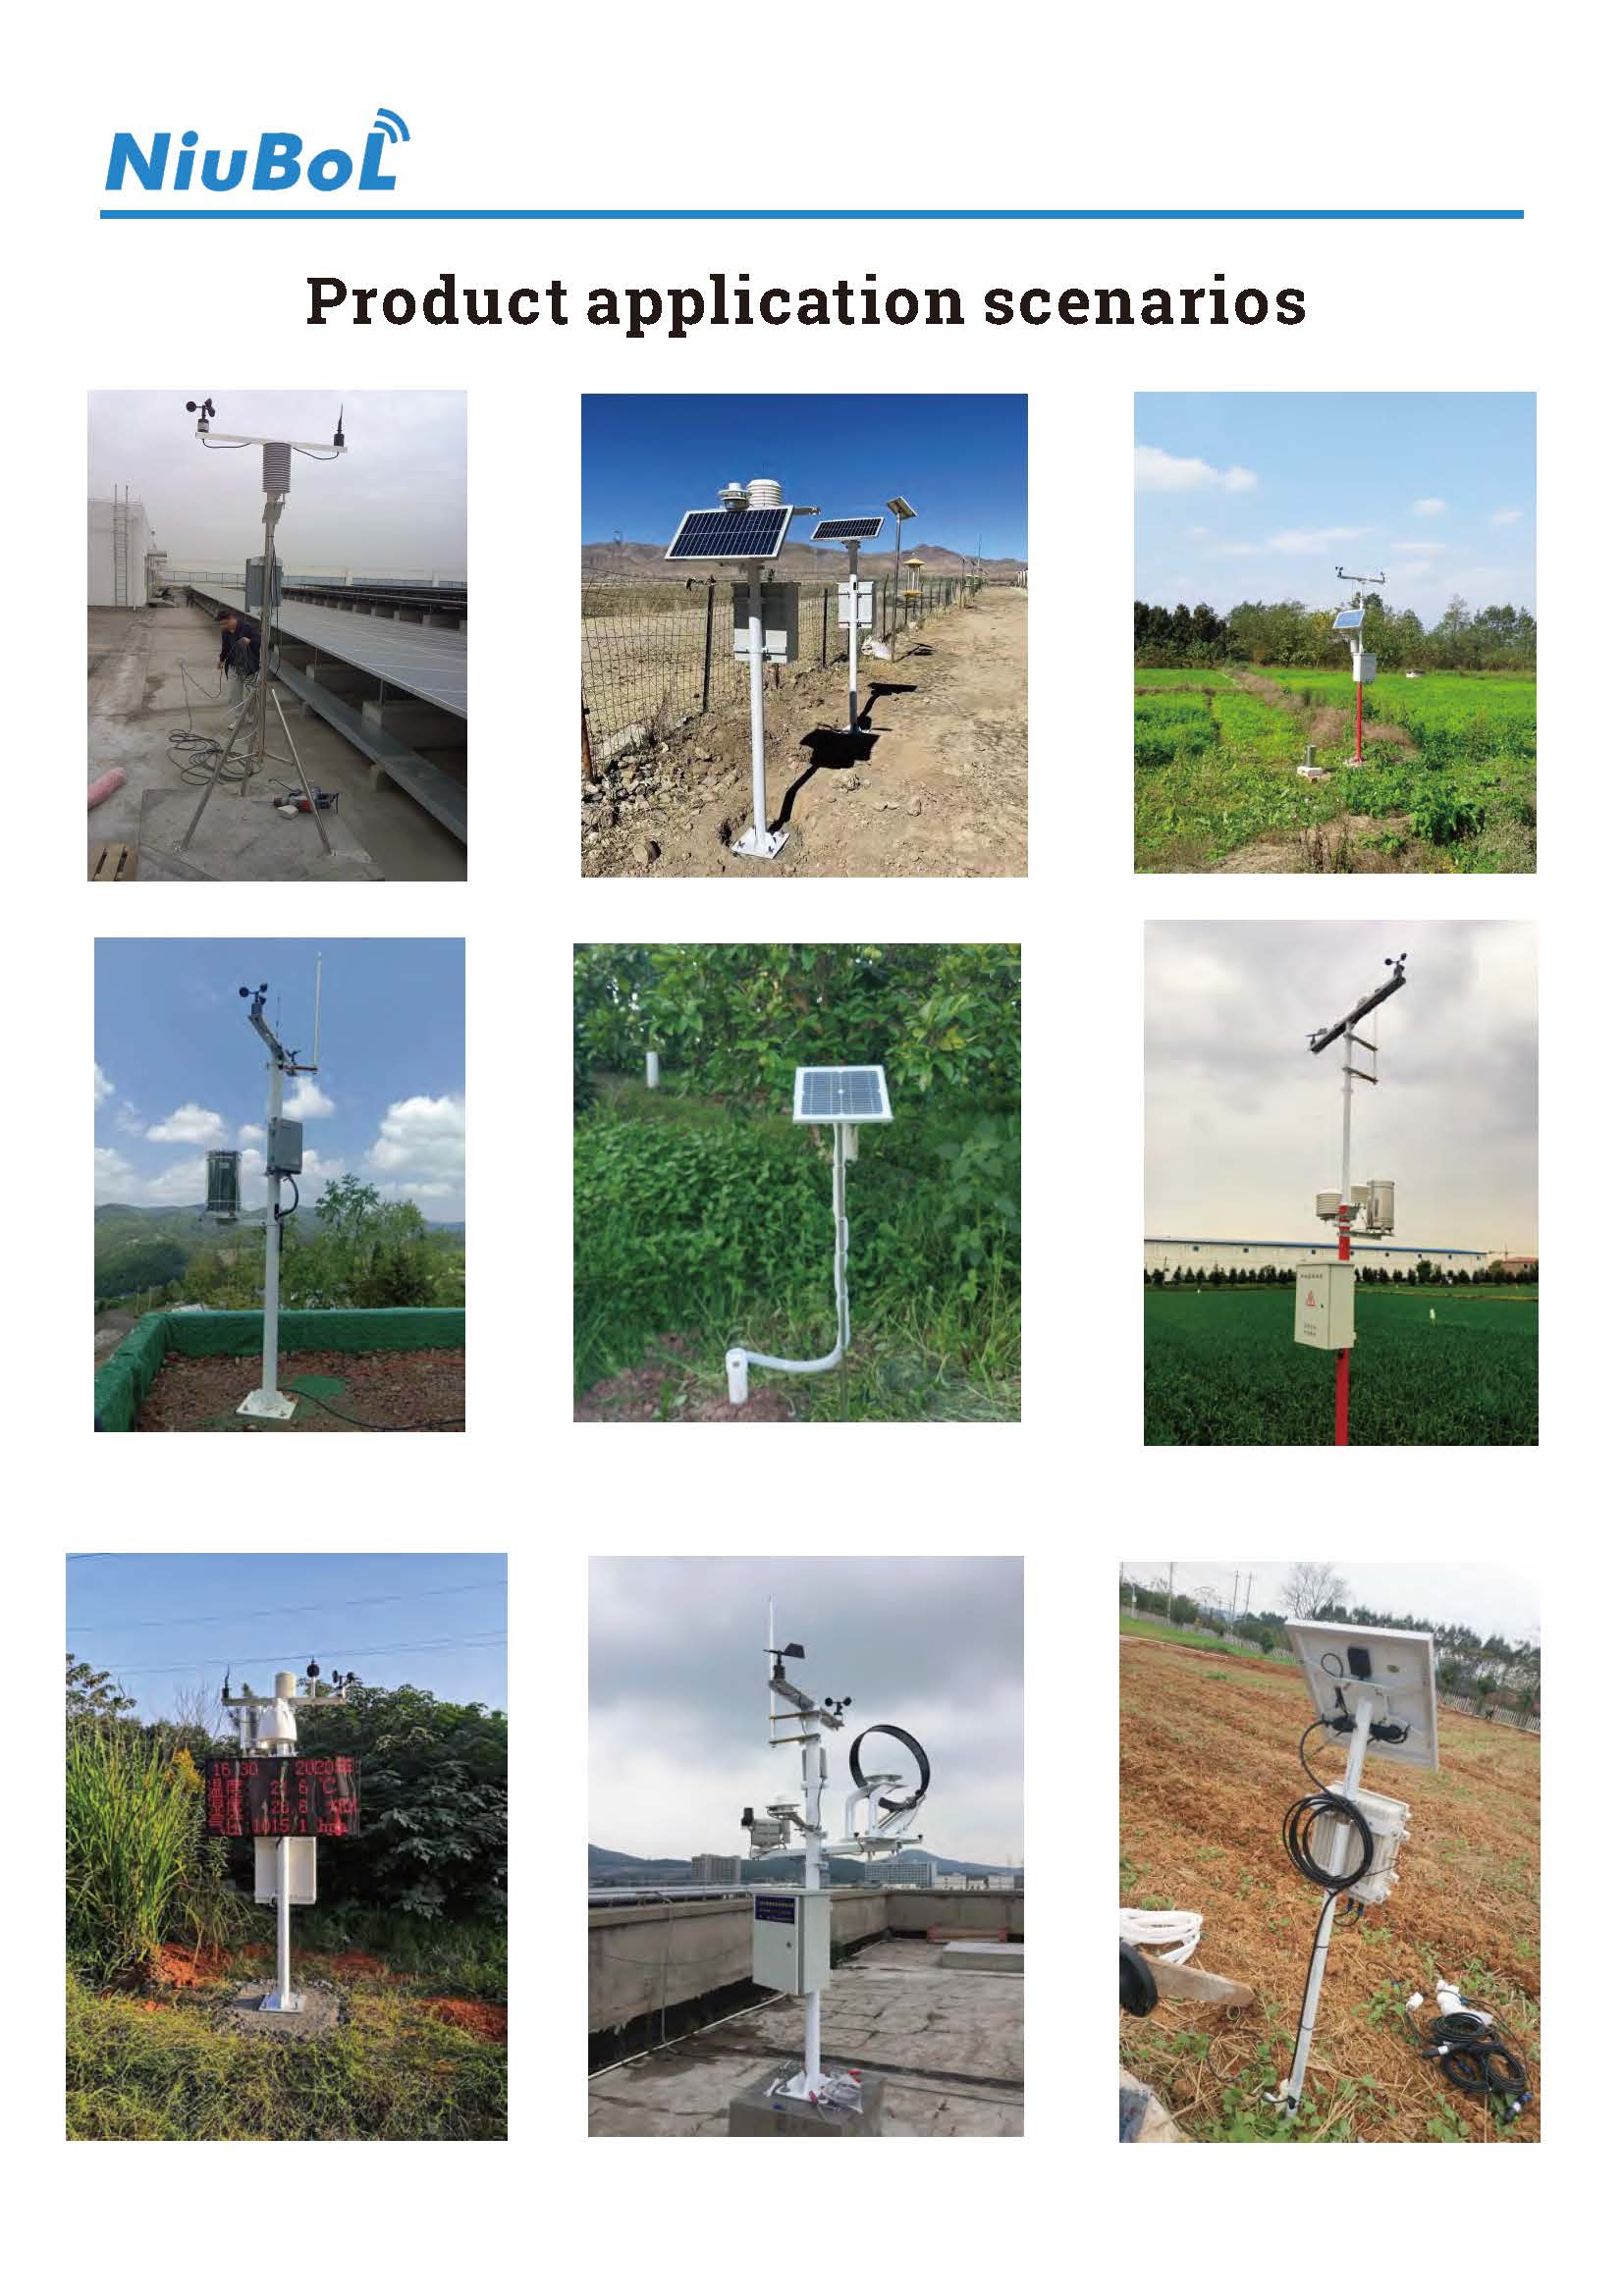
A station contributes observations, but a short or changing record is not sufficient by itself. Examine record length, exposure, instrument changes and an appropriate regional context before drawing a climate conclusion.
Not universally. Water-content interpretation depends on soil, measurement basis, depth and crop conditions. Establish appropriate site references rather than transferring a percentage from another farm.
Not without a validated decision method. Radiation, air conditions, viewing geometry and crop stage affect the observation. Compare it with root-zone and irrigation information before using it for automatic action.
Not simply by recording current weather. Forecasting requires an appropriate forecast service or validated model and its required inputs. Separate a measured-condition alert from a forecast and from an operational response.
No. Check each sensor, acquisition enclosure and connection against its own exposure. An IP or temperature rating for one component cannot be assigned to the whole installation.
Use documented operating decisions and a suitable comparison period. Measure outcomes such as water delivered, response time or inspected faults. Do not assume a fixed yield increase or avoided-loss percentage from installing sensors.
Climate-related agricultural monitoring is useful when it reduces uncertainty in a specific management decision. Choose observations that represent the field, keep their limitations visible and design the installation for adverse conditions. NiuBoL instruments can provide those observations; the adaptation plan and its results still need site-specific assessment.
Prev:What Is an AWS Weather Station?
Next:Climate Adaptation Sensors for Agriculture: Heat and Water Stress
Related recommendations
Sensors & Weather Stations Catalog
 Agriculture Sensors and Weather Stations Catalog-NiuBoL.pdf
Weather Stations Catalog-NiuBoL.pdf
Agriculture Sensors Catalog-NiuBoL.pdf
Water Quality Sensor Catalog-NiuBoL.pdf
Related products
 Combined air temperature and relative humidity sensor
 TDR Soil Moisture & Temperature Sensor for irrigation| RS485 |4-20mA| NBL-S-THR
 Soil pH sensor RS485 soil Testing instrument soil ph meter for agriculture |NBL-S-PH
 Wind Speed sensor Output Modbus/RS485/Analog/0-5V/4-20mA
 Tipping bucket rain gauge for weather monitoring auto rainfall sensor RS485/Outdoor/stainless steel
 Pyranometer Solar Radiation Sensor 4-20mA/RS485


Screenshot, WhatsApp to identify the QR code
WhatsApp number:+8615367865107
(Click on WhatsApp to copy and add friends)

