

— Blogs —
—Products—
 Consumer hotline +8618073152920
WhatsApp:+8615367865107
Address:Room 102, District D, Houhu Industrial Park, Yuelu District, Changsha City, Hunan Province, China
Product knowledge
Time:2022-06-11 18:42:27 Popularity:2247
Quick answer: Agricultural weather equipment measures local conditions that affect field operations. It does not forecast future weather by itself. Its value is a site-specific record that can be combined with forecasts, crop models and farm thresholds for irrigation, frost response, spraying and disease-risk management.
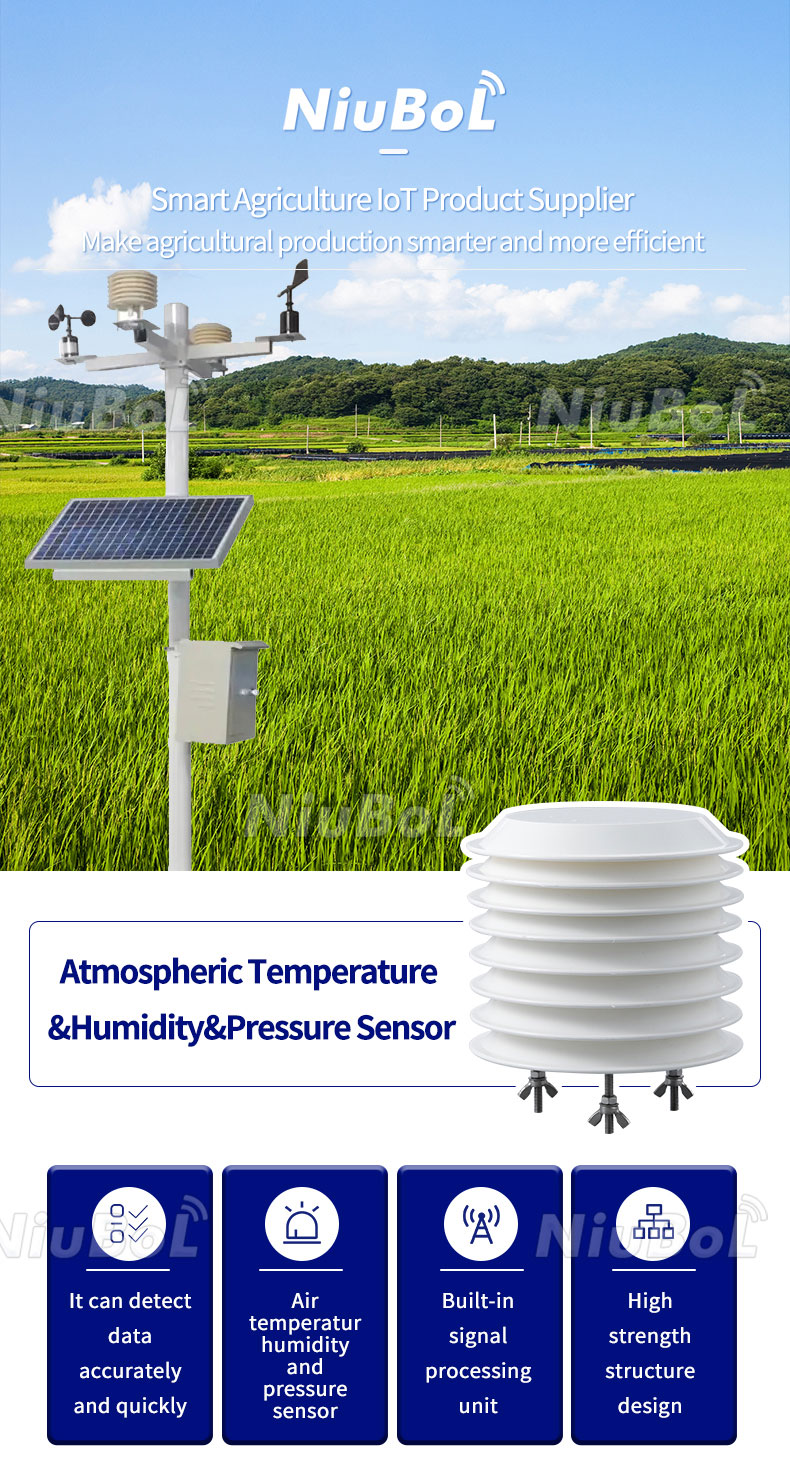
Agricultural weather monitoring equipment should be specified from the decisions a farm team intends to make. An irrigation manager needs a different record from a researcher studying crop energy balance. A contractor installing one convenient station at the farm office may provide a working data link without measuring the conditions of a distant crop block. Start by naming the operation, the relevant field area and the person who will act on the result.
| Measurement | Decision support | Common siting risk |
|---|---|---|
| Air temperature and humidity | Frost, heat and disease-model inputs | Direct radiation or nearby heat source |
| Wind speed and direction | Spray windows and local wind exposure | Trees, buildings or mast obstruction |
| Rainfall | Irrigation adjustment and event records | Unlevel gauge, splash or blocked funnel |
| Solar radiation | Evapotranspiration and crop-energy studies | Shading or an unlevel sensor |
Weather measurements help estimate atmospheric demand, while soil observations indicate conditions at selected root-zone points. They answer different questions. Reference evapotranspiration, ETo, can be calculated using an appropriate method and quality-checked weather inputs; the FAO reference evapotranspiration framework uses radiation, air temperature, humidity and wind data. A station that measures only temperature and rainfall does not directly provide all of those measured inputs.
ETo is not an instruction to apply the same depth of irrigation to every crop. Crop stage, soil storage, effective rainfall and irrigation-system performance still matter. If the software uses crop coefficients or estimates missing inputs, establish those settings and assumptions. Buying a pyranometer and a logger does not by itself provide a configured crop-water model. Ask which calculations are included, who configures them and how the output will be checked at the site.
Rainfall is also not identical to water retained in the root zone. Runoff, infiltration and spatial variation affect the result. After a rain event, compare the gauge total with soil response and the condition of the field before cancelling an irrigation cycle. Keep irrigation amounts separate from rainfall unless the measurement arrangement intentionally records both. A sprinkler wetting the rain collector can otherwise be misinterpreted as a natural storm.
A standard shielded air-temperature point gives a defined atmospheric observation, but crop tissues can behave differently during radiative cooling. A low-lying part of an orchard can also differ from the farm-office site. Where cold-weather response is important, evaluate whether additional temperature points are required in the vulnerable blocks and whether the selected measurement height matches the operating objective.
Agree the warning method and escalation with the farm team. Define who receives the alert, how its delivery will be checked and what happens if no current reading is available. Set the trigger from the crop, stage and locally approved management plan rather than a universal temperature copied into every station. An alert can support a response, but the station does not guarantee protection from frost or confirm that protective equipment has operated.
For field operations affected by drift, use wind observations relevant to the work area and measurement height. A sensor above a building may report a different wind from the crop edge. Examine gusts and direction changes as well as the average where the operating procedure requires them. Weather readings support planning; they do not replace the application conditions and restrictions governing the actual product and equipment being used.
Disease-risk work needs a defined crop-pathogen model, not simply a humidity alarm. Air relative humidity is not a direct measurement of water on a leaf surface. If a model needs leaf-wetness duration, select a suitable additional sensor and event calculation, and record where it represents the canopy. A weather station should not be advertised as diagnosing disease merely because it displays temperature and RH.
The same distinction applies to radiation measurements. A broad-band solar-radiation channel can support an energy or ETo calculation when appropriately configured. It is not interchangeable with photosynthetically active radiation merely because both respond to sunlight. State the required quantity and unit in the equipment list before selecting a sensor; adding a display label after installation cannot change the sensing band.
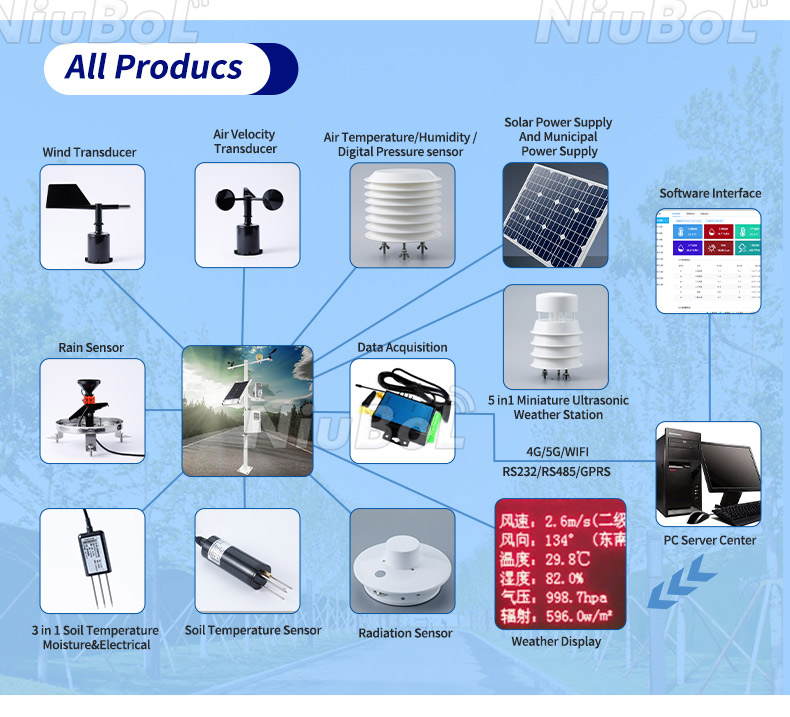
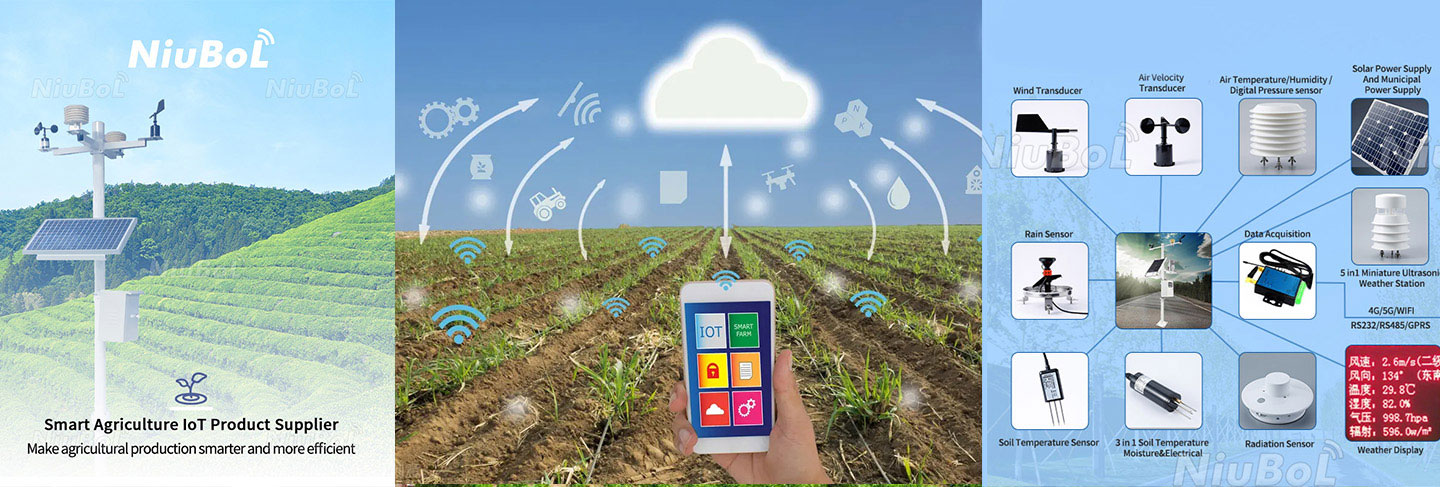
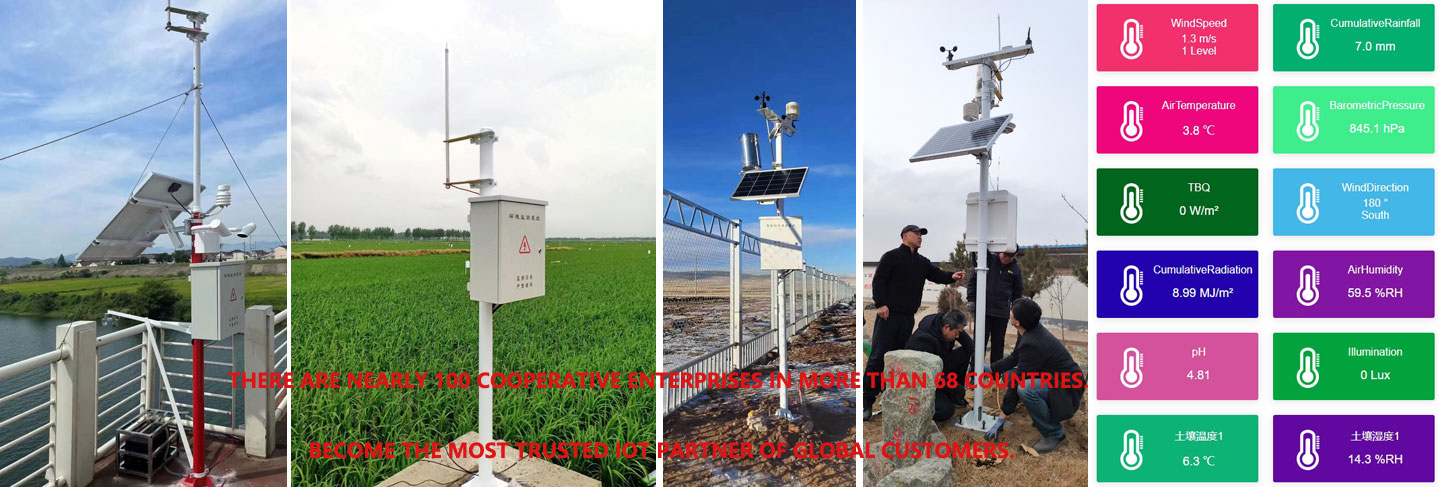
A modular NiuBoL agricultural station can combine separate wind, temperature and humidity, rainfall and radiation channels with an appropriate data logger. The following examples describe individual components, not a universal accuracy or environmental rating for the complete station. Check the ordered electrical versions and allow for any additional soil or canopy points. A combined ultrasonic head is another configuration choice, with its own channel list and exposure requirements.
| Component example | Technical detail | Use in the farm record |
|---|---|---|
| NBL-W-LBTH air temperature | -40 to +80 degrees C; accuracy +/-0.5 degrees C | Shielded air-temperature history for local conditions and configured calculations. |
| NBL-W-LBTH humidity / pressure | 0-100% RH, +/-5% RH; 10-1200 hPa, +/-1.5 hPa | Keep atmospheric RH separate from soil moisture and leaf-surface wetness. |
| NBL-W-LBTH supply / output | 12-24 V DC; selected RS485 or 4-20 mA version | Match acquisition channels and power distribution to the order. |
| NBL-W-RS, 0.2 mm configuration | 0-4 mm/min liquid-rain intensity range; 0.2 mm increment; +/-4% in an indoor static test at 2 mm/min | Retain the test conditions with the accuracy figure; a blocked collector is a separate field error. |
| NBL-W-RS operating conditions | 0-50 degrees C operating temperature; 5 m standard cable; output configuration selected for the logger | Do not assume an unheated configuration measures frozen precipitation. |
| NBL-W-SS / NBL-W-DS wind channels | Separate wind speed and direction sensors; IP65 | The cup assembly measures speed; the vane measures direction. Verify their channel names during commissioning. |
For pulse rainfall, a digital counter is required; for analog channels, allocate inputs with the correct current or voltage characteristics. RS485 / Modbus RTU instruments need individually assigned addresses and a compatible driver. Confirm the quantity represented by each register rather than treating every percentage as the same type of measurement. Cable lengths, connection protection and any field junction boxes belong in the installation scope, not only the sensor count.
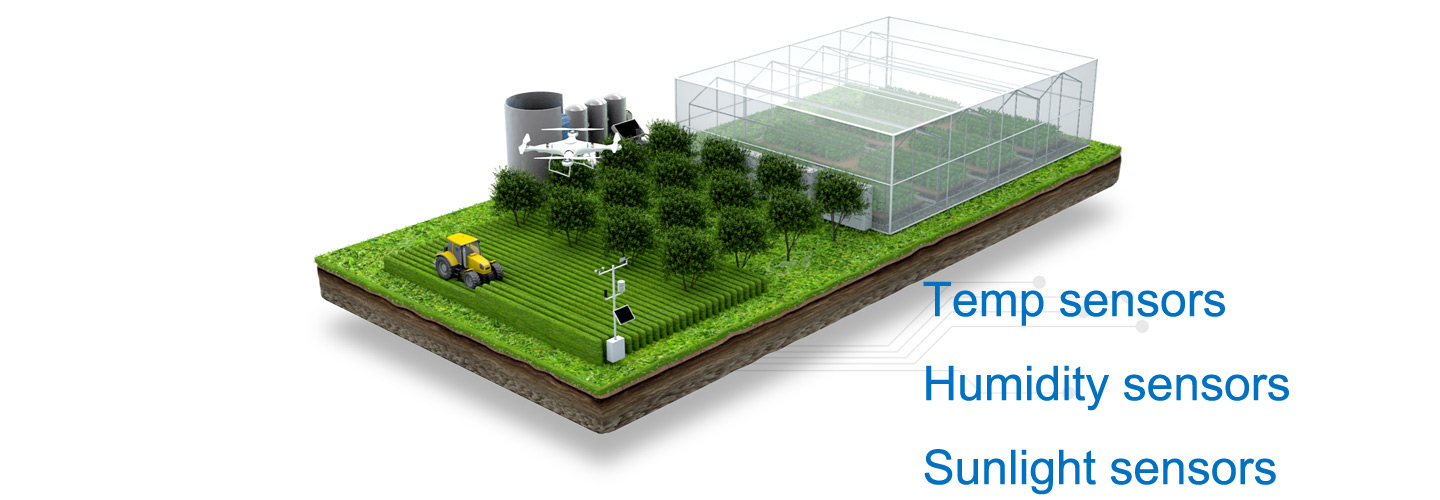
A convenient yard may not represent a crop block. Record elevation, surface cover, obstructions and distance from irrigation. Farms with major differences in terrain or management may need more than one station or additional rainfall and soil nodes.
Map the farm's important differences before adding equipment. A ridge, a sheltered orchard hollow and irrigated lowland can justify different observations, while several similar adjacent blocks may share some atmospheric measurements. Additional nodes should answer a specific uncertainty: local rain, cold exposure or root-zone water response. More identical stations are not automatically more useful if none represents the decision area or can be maintained regularly.
Keep the siting objective with the data record. A station positioned to describe open-field weather should not silently be compared with a sensor deliberately placed inside a dense canopy. When crops or nearby vegetation grow, exposure can change over a season. Record those changes when interpreting a trend, especially if the same equipment is used to compare one year with another.
A data logger timestamps, stores and transmits measurements. Define sampling, averaging and reporting intervals separately. The station should keep local records if the wide-area connection fails and preserve the same units and time basis after recovery.
Treat local storage and later recovery as functions to verify in the ordered logger and software, not as automatic consequences of having a cellular antenna. A communications outage during rain or a cold night is particularly important because the missing observations may coincide with the event the system was installed to capture. Confirm how stored records are recovered, how duplicates are handled and whether missing observations remain visibly missing rather than becoming zeros.
Align the record with the calculation. A daily rainfall total and an instantaneous wind sample cannot reconstruct every short-duration event. Disease and cold-weather methods may require finer intervals than a monthly report. Specify acquisition, averaging and upload intervals separately, then export a sample record for the agronomist or model operator to inspect before the station is accepted.
Inspect the rain gauge, radiation shield, rotating wind parts, solar-radiation surface, cables and enclosure. Compare questionable readings with a reference and document any sensor replacement. Vegetation growth around a station can change exposure even when the hardware remains intact.
Assign accessible checks to the person who can actually reach the station. After dusty work, inspect the radiation surface; after vegetation growth, inspect exposure; after a storm, inspect the collector and mounting. A damaged or disconnected point should be flagged in the record while it is being repaired. Preserve the measurement history when replacing a sensor, but record the model, date and any configuration change so a replacement is not mistaken for a weather shift.
When requesting NiuBoL agricultural weather monitoring equipment, describe the crop operation, farm layout, required measurements and intended calculations. Include remote power and communications, any existing irrigation controller, and who will configure thresholds. Ask for the sensor models, mounting arrangement, logger functions and commissioning work as identifiable items. That is more useful for comparing offers than an unspecified package described only as a smart agricultural station.
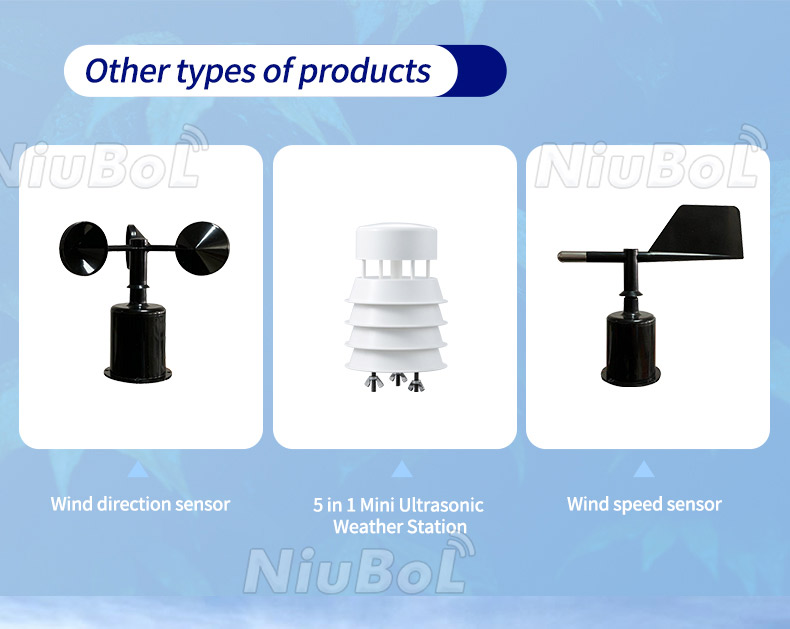
For wind channels, confirm physical function as well as the screen tag: the rotating cups provide wind speed, and the vane provides wind direction. Compact multi-parameter heads must be selected by their actual included measurements. This prevents an equipment overview or similar-looking housing from being used as a substitute for the ordered channel list.
Select them from the decisions and calculations. An ETo application needs appropriate weather inputs and software; a cold-exposure project may require extra temperature locations. Rainfall alone does not establish root-zone water status, and air RH alone does not measure leaf wetness.
The instruments provide observations. Prediction or risk scoring needs a defined method, suitable inputs and crop-specific interpretation. Agree the model and warning procedure separately; do not assume either is included with a sensor-and-logger package.
Area alone is not enough to decide. Terrain, crop structure, rainfall variability and management differences determine whether one site is representative. Add locations to resolve those differences rather than choosing a universal radius of coverage.
No. They describe different spectral quantities and commonly use different units. Choose the sensor for the calculation or crop study. A broad-band radiation output cannot simply be relabeled as PAR in the logger.
Only with a suitable controller, output stage and configured operating rules. Weather observations can inform those rules, but the measurement package alone does not verify valve flow or provide a complete irrigation-control function. Specify the integration explicitly.
Verify locations, channel identities, units, timestamps and the calculation settings actually used. Inspect sample exports, alarms and communication recovery. Include the agronomic user in the check so the recorded interval and variables are suitable for the intended decision.
Sensor types and locations, mounting, logger inputs, power, communication and application configuration determine scope. Separate hardware from recurring services and model work. Ask NiuBoL to quote the required measurements and functions rather than infer price from the number of dashboard tiles.
Agricultural weather equipment is useful when local measurements are representative and tied to a practical farm response.
Specify the observation and the calculation before choosing the package. Keep weather, canopy and soil quantities distinct, document the point each sensor represents, and test whether the resulting record can support the farm team's actual operating decision.
Related recommendations
Sensors & Weather Stations Catalog
 Agriculture Sensors and Weather Stations Catalog-NiuBoL.pdf
Weather Stations Catalog-NiuBoL.pdf
Agriculture Sensors Catalog-NiuBoL.pdf
Water Quality Sensor Catalog-NiuBoL.pdf
Related products
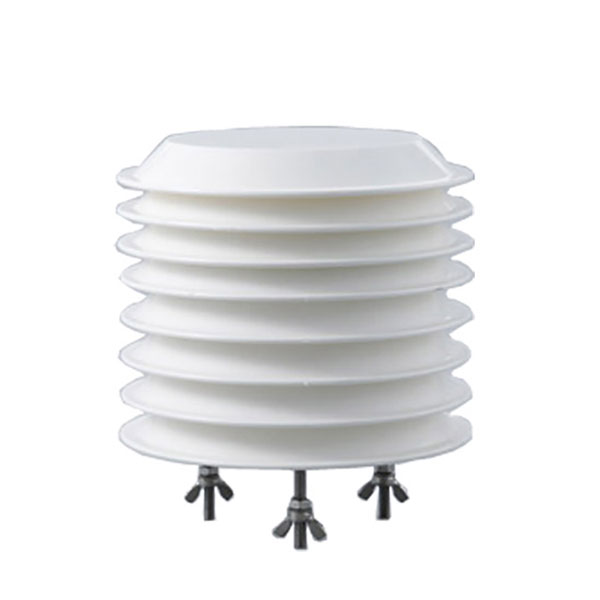 Combined air temperature and relative humidity sensor
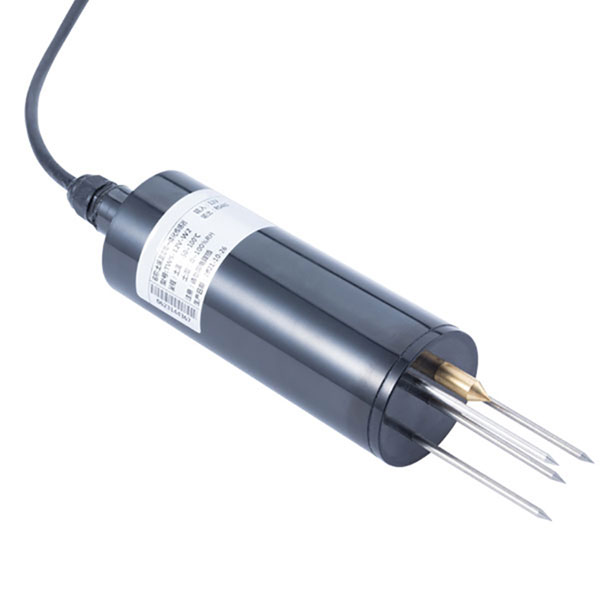 TDR Soil Moisture & Temperature Sensor for irrigation| RS485 |4-20mA| NBL-S-THR
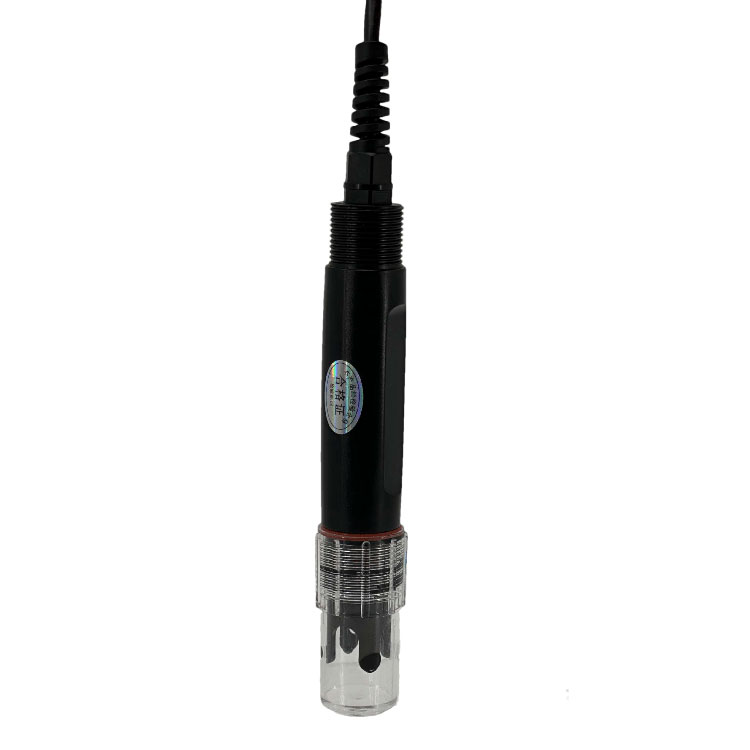 Soil pH sensor RS485 soil Testing instrument soil ph meter for agriculture |NBL-S-PH
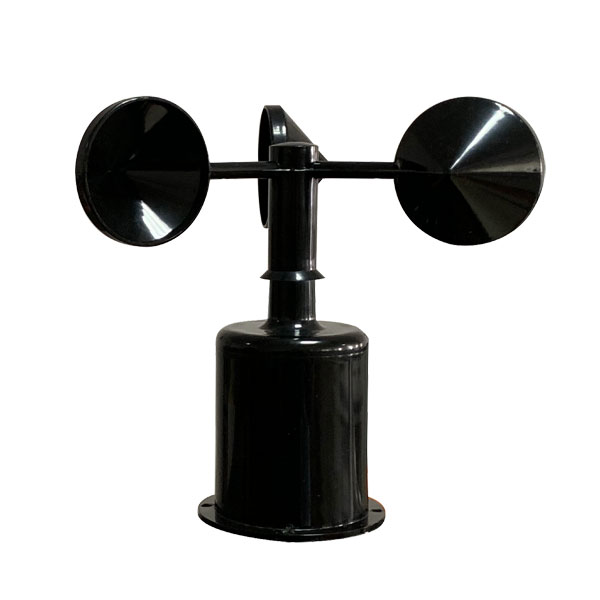 Wind Speed sensor Output Modbus/RS485/Analog/0-5V/4-20mA
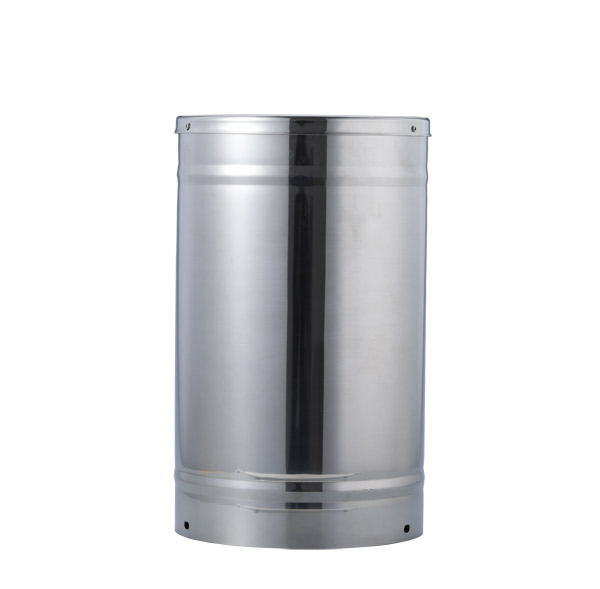 Tipping bucket rain gauge for weather monitoring auto rainfall sensor RS485/Outdoor/stainless steel
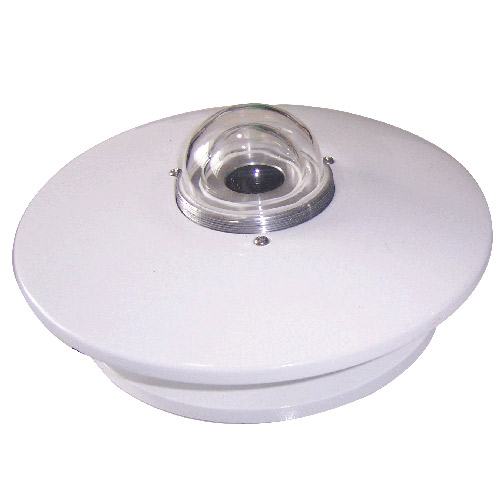 Pyranometer Solar Radiation Sensor 4-20mA/RS485

Screenshot, WhatsApp to identify the QR code
WhatsApp number:+8615367865107
(Click on WhatsApp to copy and add friends)