





— Blogs —
—Products—
 Consumer hotline +8618073152920
WhatsApp:+8615367865107
Address:Room 102, District D, Houhu Industrial Park, Yuelu District, Changsha City, Hunan Province, China
Product knowledge
Time:2024-11-10 18:27:35 Popularity:2683
PM2.5 and PM10 sensors provide related particulate-matter readings, not two independent quantities that should be added together. Compare the channels only after checking units, timestamps, averaging and data mapping. A difference between them can help describe a particle episode, but it does not by itself identify the dust source or chemical composition. For a NiuBoL integrated sensor, verify both values through the complete acquisition path before interpreting their relationship.
PM2.5 represents the fine-particle fraction, while PM10 covers a broader fraction that includes fine particles. The EPA explanation of particulate matter describes these as size-related categories. They are not chemical identifications or particle counts.
For measurements representing the same air and period, adding PM2.5 to PM10 double-counts the overlapping fraction. PM10 minus PM2.5 is sometimes used to examine a coarse-fraction estimate, but the subtraction inherits the uncertainty and differences of both results. Two optical output channels do not automatically provide a separately validated coarse-particle measurement.
Do not assign a universal PM2.5-to-PM10 ratio to all locations. Different particles and sampling conditions can produce different relationships. A ratio may help flag a change in conditions, but it cannot establish the origin of the particles.

A display may show the latest PM2.5 value beside a longer average for PM10. Another system may update one channel before the other. These values can appear simultaneous while referring to different observations. Confirm the timestamp and averaging definition for each field.
Check units as well. An illustrative 20 ug/m3 equals 0.020 mg/m3. If one receiving field applies a conversion and the other does not, the apparent difference is a data-handling problem rather than a change in the air. Neither ppm nor a raw particle count should be relabelled as particulate mass concentration.
For a building perimeter or construction project, retain the instrument location and activity period alongside the paired records. Comparing a roadside instrument with another inside a sheltered enclosure does not isolate instrument performance from differences in sampled air.
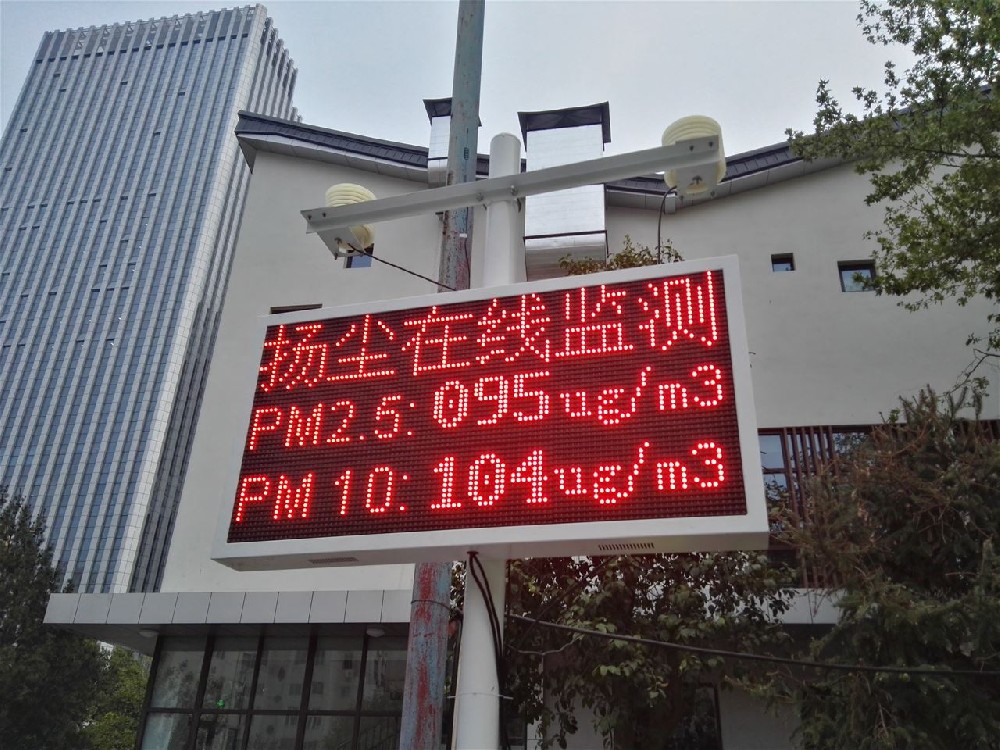
The NBL-W-PM integrated sensor uses laser scattering and a built-in fan. Its reported concentrations depend on the optical response and processing; it is not an electrochemical gas sensor. The minimum-particle figure is also different from the named PM fractions.
| Parameter | NBL-W-PM configuration | Interpretation |
|---|---|---|
| PM2.5 range | 0-1000 ug/m3 | Keep this channel distinct from PM10. |
| PM10 range | 0-2000 ug/m3 | A wider range does not establish greater field accuracy. |
| Minimum detectable particle | 0.3 um diameter | Does not cover every smaller particle. |
| Supply and power | DC 12-24 V; 350 mW | Include the logger and modem separately in the power design. |
| Interface | RS485; Modbus RTU for the corresponding standalone version | Use the delivered version's communication settings. |
| Operating temperature | -20 to +60 C | Check conditions inside the installed assembly. |
| Standard cable | 2.5 m | Confirm any changed cable arrangement before ordering. |

The fractions overlap, so a persistent inversion deserves investigation. Check that the channels have not been swapped, that both values use the same units and period, and that the latest valid observations are being compared. Do not automatically force one value to equal the other in the database.
For the corresponding NBL-W-PM RS485 version, the two returned data words are ordered PM2.5 then PM10, with the high byte first within each value. The specified serial format is 9600 baud, 8 data bits, no parity and 1 stop bit, with at least 1000 ms between communications. Confirm the installed version before applying those settings.
If local decoded values are plausible but the server pair is not, inspect the gateway mapping, retained timestamps and display processing. If the discrepancy is already present locally, examine operating conditions and instrument condition before deciding whether service is required.
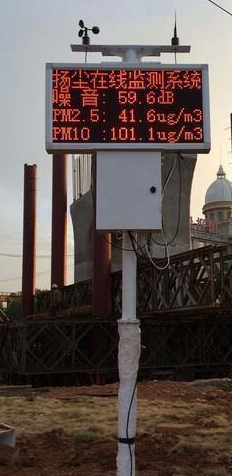
A change in the two channels may be consistent with a changed particle mixture, but the pair does not identify cement, soil, soot or a particular chemical. Wind, nearby activity and other observations can help frame an investigation; they do not make the optical sensor a chemical analyser.
On a managed site, compare periods with documented activity and similar observation conditions rather than assigning every change to one source. If the decision requires source attribution or a specific hazardous substance, use an appropriate investigation and analytical method.
Keep an optical sensor's concentration records separate from a declaration about stack emissions or worker exposure. A visible outdoor display and an RS485 connection do not establish suitability for every reporting or safety purpose.
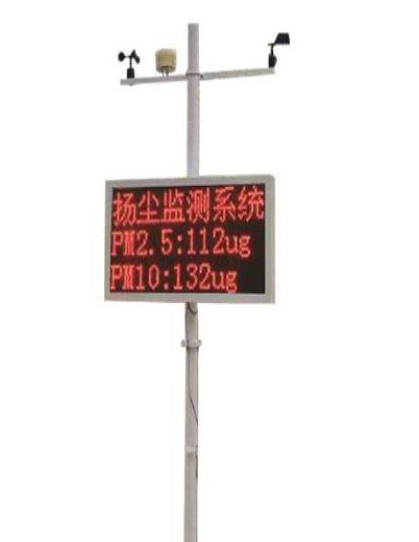
Maintain the intended vertical mounting, avoid direct artificial fan discharge and preserve air access. A sealed protective cabinet can protect electronics while preventing the sensor from observing the intended air. Conversely, exposed openings must not allow the sensing module to become wet.
Sticky contamination and changes in the air path can affect the optical arrangement. Inspect the installed condition and follow the applicable service procedure; do not spray the optical module with water or dismantle it to correct an unexplained ratio.
When requesting support, provide both time series, timestamps, environmental conditions, installation photographs and the device configuration. Two isolated maximum values give much less information than the paired records around the discrepancy.
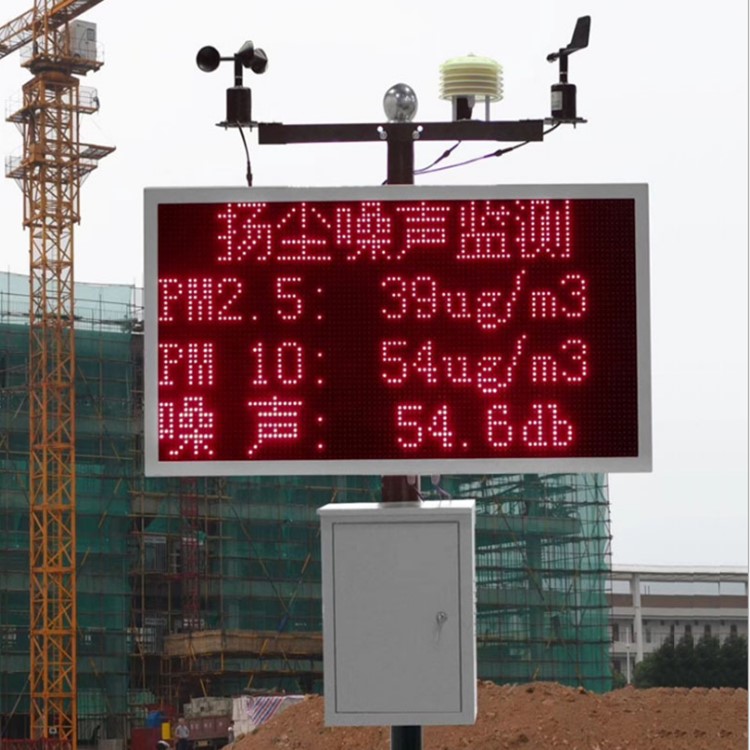
Check the local values, logger fields and final export over the same period. Confirm that PM2.5 and PM10 remain separate, missing readings remain identifiable, and any averaging or unit conversion is documented. A test should include a normal update and the system's handling of an unavailable value, using an appropriate non-hazardous test arrangement.
For a network enquiry, specify whether the customer needs current concentrations, interval averages or retained records. Include the receiving PLC, RTU or server interface. NiuBoL data acquisition equipment must be configured for those fields; merely receiving serial traffic does not verify the final paired dataset.
No. Their size fractions overlap. Adding them double-counts the fine fraction, and the result is not a total suspended particulate measurement.
No. First check matched times, units, averaging and channel mapping. Instrument uncertainty and operating conditions also matter. Do not interpret the subtraction before checking its inputs.
Not uniquely. The ratio does not provide chemical composition. Use activity records and an appropriate analytical investigation where source identification is required.
No. Retain the original values and flag the discrepancy. A silent replacement hides evidence needed to diagnose decoding, timing or measurement problems.
Provide the ordered model/version, serial settings, channel map, sample decoded values and matching server output. Include timestamps and units so support can trace both channels end to end.
NBL-W-PM PM2.5 and PM10 sensor datasheet (PDF)
 NBL-W-PM25-PM10-Integrated-sensors-Manual.pdf
Read PM2.5 and PM10 sensors as a related pair, with matched times and clearly identified units. Verify channel mapping before explaining an unexpected ratio, and keep particle concentration separate from source attribution. The NBL-W-PM can provide both channels for a configured monitoring system; useful interpretation depends on the sampling conditions and the complete record path.
Prev:Particle Sensors for Air Quality: What Is Actually Measured?
Next:How to Collect Hydrological Data: Records That Can Be Reused
Related recommendations
Sensors & Weather Stations Catalog
 Agriculture Sensors and Weather Stations Catalog-NiuBoL.pdf
Weather Stations Catalog-NiuBoL.pdf
Agriculture Sensors Catalog-NiuBoL.pdf
Water Quality Sensor Catalog-NiuBoL.pdf
Related products
 Combined air temperature and relative humidity sensor
 TDR Soil Moisture & Temperature Sensor for irrigation| RS485 |4-20mA| NBL-S-THR
 Soil pH sensor RS485 soil Testing instrument soil ph meter for agriculture |NBL-S-PH
 Wind Speed sensor Output Modbus/RS485/Analog/0-5V/4-20mA
 Tipping bucket rain gauge for weather monitoring auto rainfall sensor RS485/Outdoor/stainless steel
 Pyranometer Solar Radiation Sensor 4-20mA/RS485


Screenshot, WhatsApp to identify the QR code
WhatsApp number:+8615367865107
(Click on WhatsApp to copy and add friends)

