





— Blogs —
—Products—
 Consumer hotline +8618073152920
WhatsApp:+8615367865107
Address:Room 102, District D, Houhu Industrial Park, Yuelu District, Changsha City, Hunan Province, China
Product knowledge
Time:2024-11-24 15:33:21 Popularity:1588
Research meteorological stations should be specified around the differences the study needs to resolve, not a general research-grade label. Define the quantity, exposure, time basis and acceptable measurement uncertainty before choosing sensors. A higher display resolution or a longer archive cannot by itself establish that a small difference between locations is real. NiuBoL instruments can supply selected observations, while suitability depends on the complete measurement method and the study's requirements.

A researcher comparing shaded and open air, two crop treatments or different urban surfaces is not simply buying a list of weather channels. The project needs to distinguish an environmental difference from instrument response, location and timing effects. Describe the expected size and duration of that difference before choosing a standard station package.
Define the measured quantity precisely. Air temperature at a stated height is not leaf or pavement temperature. Irradiance on a horizontal plane is not the same observation as irradiance on an inclined surface. A point measurement beside a road does not automatically represent an entire urban district. These distinctions determine which comparisons are meaningful.
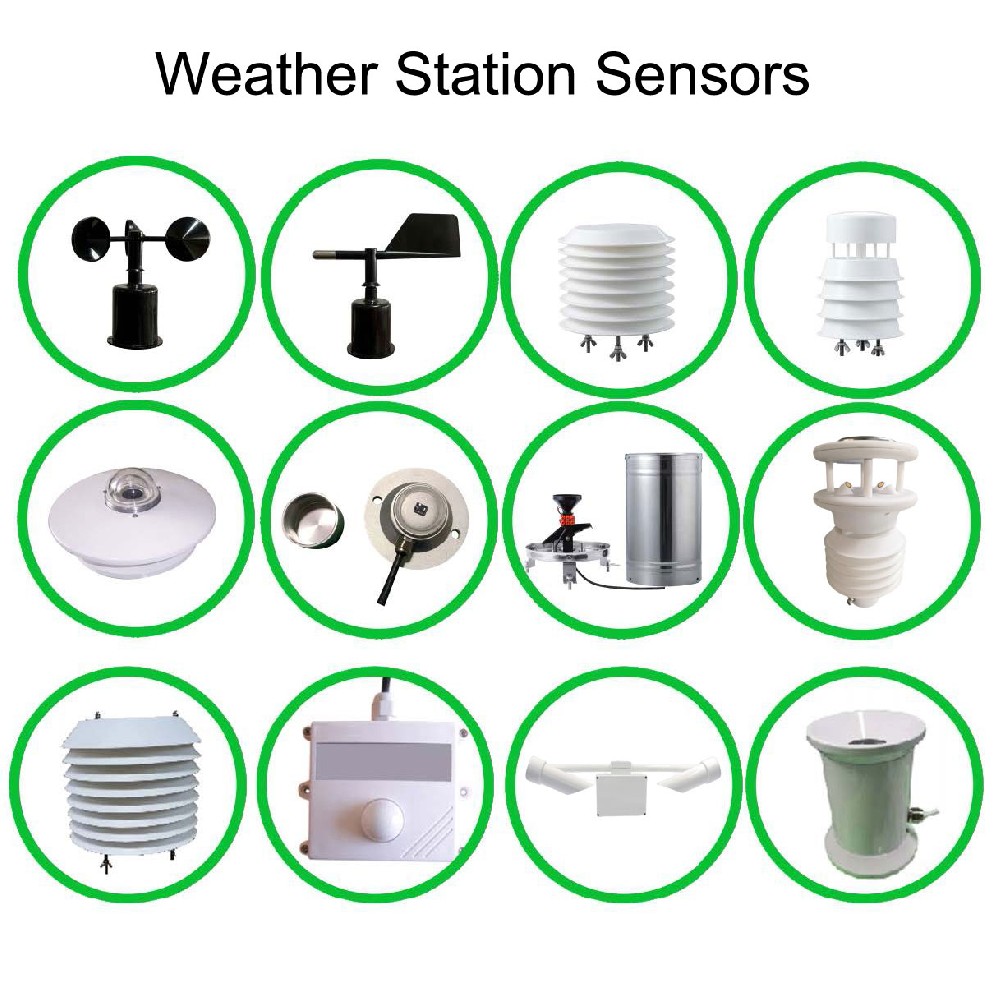
| Instrument example | Selected specification | Question for the research method |
|---|---|---|
| NBL-W-LBTH temperature | -40 to 80 C; accuracy +/-0.5 C; resolution 0.1 C | Is that performance sufficient for the expected difference under the proposed exposure? |
| NBL-W-LBTH humidity | 0-100% RH; accuracy +/-5% RH; resolution 0.1% RH | Does the analysis require a smaller difference than the selected instrument can substantiate? |
| NBL-W-SS wind speed | 0-45 or 0-70 m/s; accuracy +/-(0.3 + 0.03V) m/s, with V in m/s | What uncertainty and response are relevant in the study's wind range? |
| NBL-W-DS direction | 0-360 degrees; accuracy +/-3 degrees | How will the reference direction and light-wind observations be handled? |
| NBL-W-HPRS irradiance | 0-2000 W/m2; response time no more than 35 seconds to 99% | Can the selected response support the event duration being studied? |
The NBL-W-LBTH air sensor illustrates why extra decimal places do not establish extra accuracy. A 0.1 C display step and a +/-0.5 C accuracy statement describe different properties. Do not enter the display step into an uncertainty calculation as though it represented every contribution to the result.
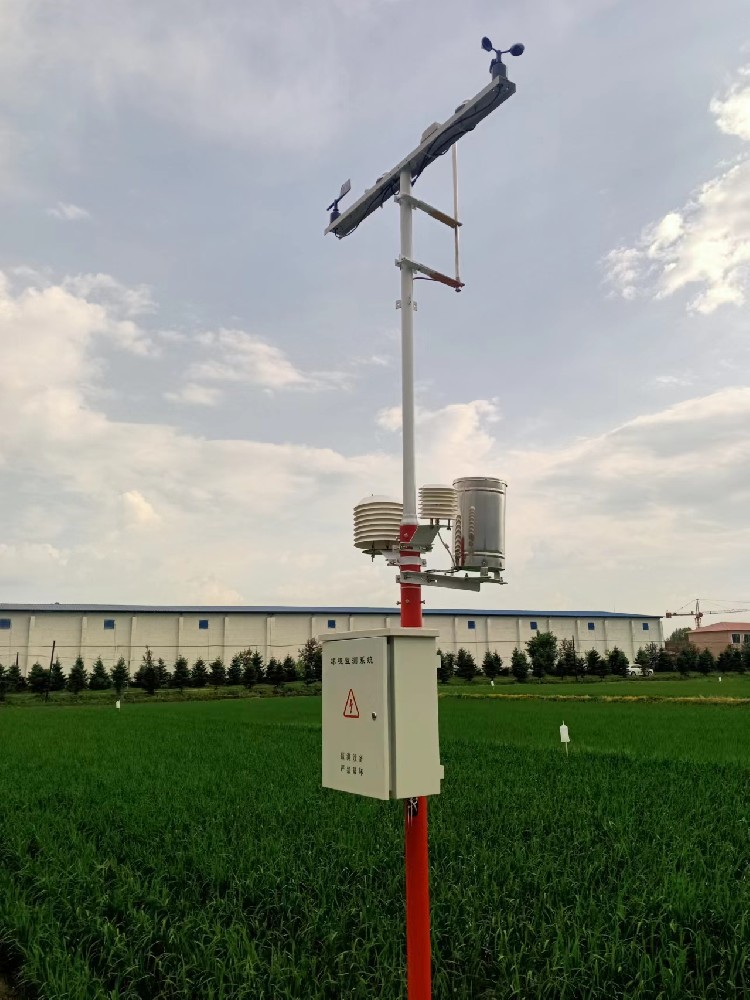
Suppose, as an illustrative screening example, two temperature sensors each have an applicable +/-0.5 C error limit. Opposite instrument errors could create a 1.0 C difference even when they measure the same temperature. A displayed difference of 0.3 C is therefore not enough, by itself, to substantiate an environmental effect. Exposure and timing can add further contributions.
This simple worst-case comparison is not a confidence interval or a complete uncertainty budget. A formal analysis needs the calibration information, applicable conditions, repeatability and other relevant contributions. Shared references or common influences can also correlate results. The JCGM discussion of measurement-result compatibility explains why the uncertainty of a difference, including correlation, matters when comparing results.
If the study needs smaller differences than the proposed package can demonstrate, change the measurement method or select more suitable instruments. Longer averaging may help with some random variation but does not automatically remove a persistent offset, a recurring shadow or a mismatched measurement height.
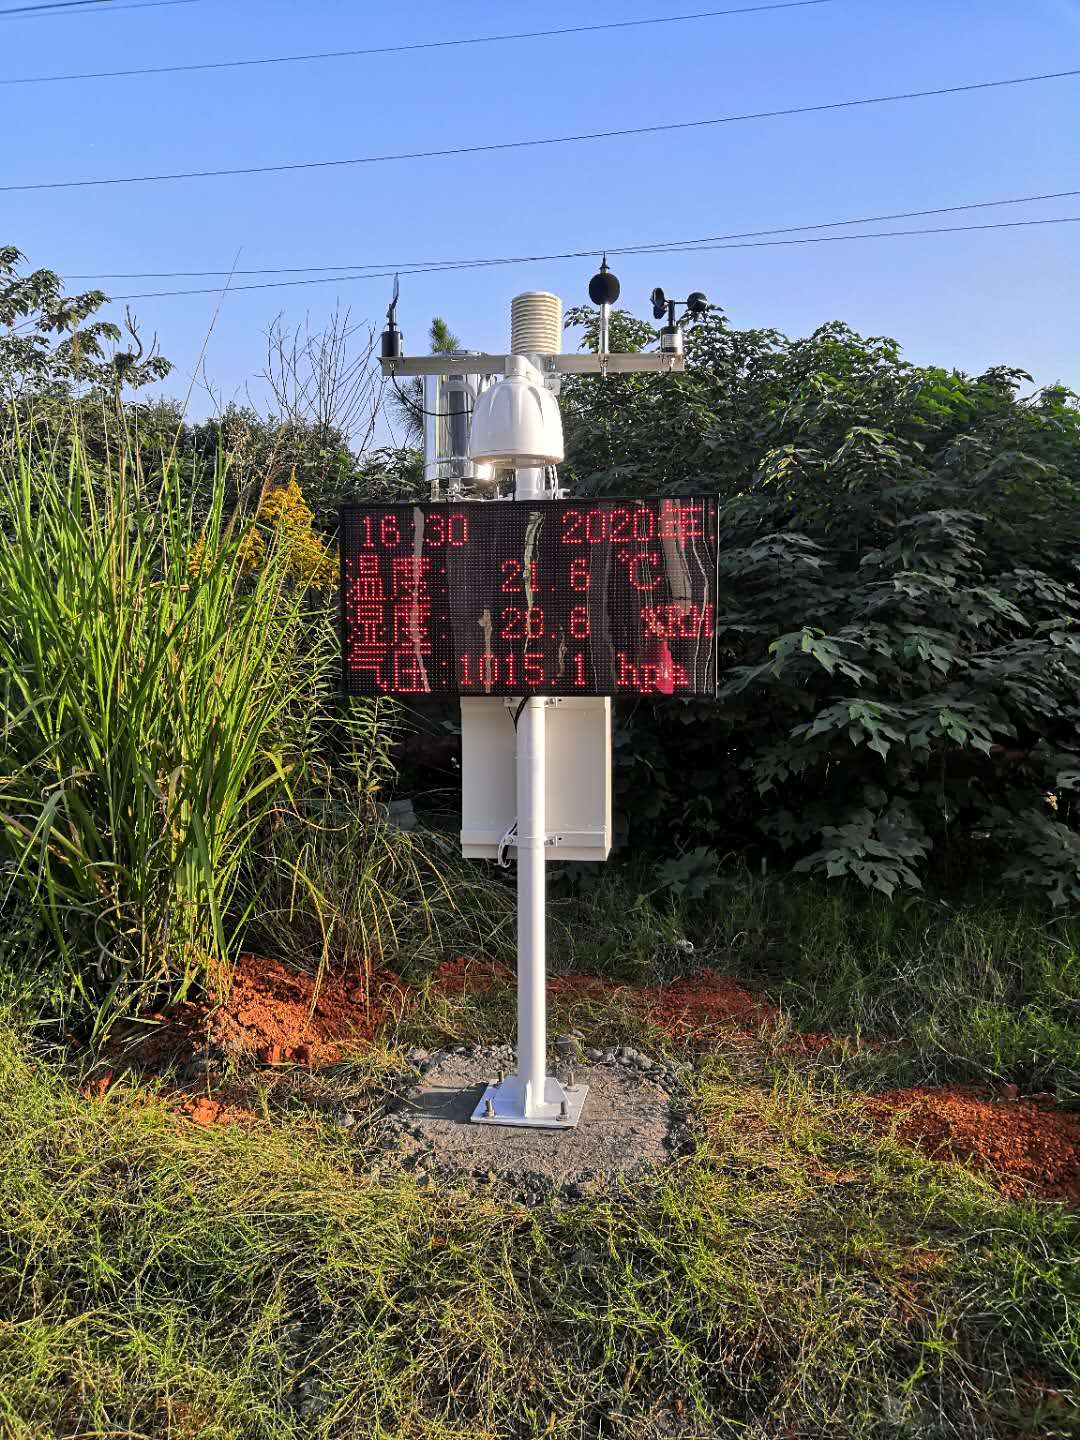
Where practical, observe the intended instruments together under comparable conditions before separating them. Compare concurrent readings across the conditions important to the study. Look for persistent differences and changing response during transitions. Retain the configuration and observations so a later site difference can be examined against the pre-deployment behavior.
Co-location is not automatically traceable calibration. It can expose relative behavior without establishing which instrument is closer to a suitable reference. If corrections are applied, preserve their basis, conditions and effective dates. Do not remove a real environmental difference merely because it disagrees with an expected result, or force two separated stations to agree through arbitrary offsets.
A slow-responding instrument cannot reproduce every short fluctuation merely because the logger polls rapidly. Conversely, averaging can discard a short event even when the sensor observed it. Specify the event duration, sensor response and recorded interval together. Keep the raw or least-processed record required for the analysis separate from a convenient dashboard summary.
For example, the NBL-W-HPRS pyranometer response specification needs consideration in a rapid irradiance study. It is not a guarantee that every cloud-edge fluctuation will appear without smoothing. The installed measurement plane, obstruction and cleaning history also remain relevant to a comparison, regardless of the logging frequency.
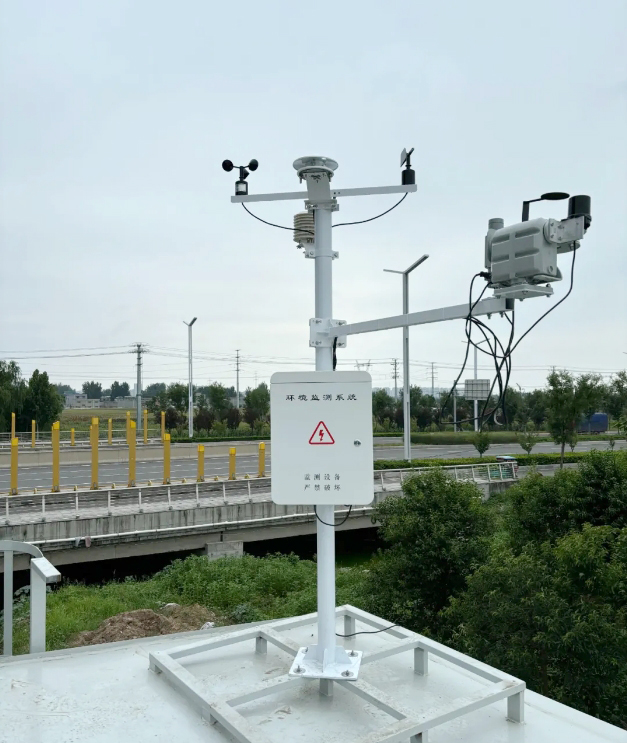
Ask for the instrument identity, calibration or test scope, applicable range, reference information and stated uncertainty where required by the project. A general company certificate does not replace the measurement documentation for an individual instrument. Nor does a sensor certificate establish the uncertainty of the entire installed system, including exposure and data processing.
For RS485 Modbus RTU instruments, verify the actual register map and scaling in the chosen acquisition configuration. RS485 alone does not establish protocol compatibility. For analog versions, include the receiving input and conversion in the assessment. Preserve units, acquisition times and channel identities in exports rather than relying on a screen image as the research record.
For a NiuBoL research enquiry, provide the quantity to compare, expected effect size, environmental range, observation interval, installation drawing and required documentation. These details allow a suitability review. If a particular uncertainty target cannot be supported by the proposed configuration, that limitation should be resolved before purchase.
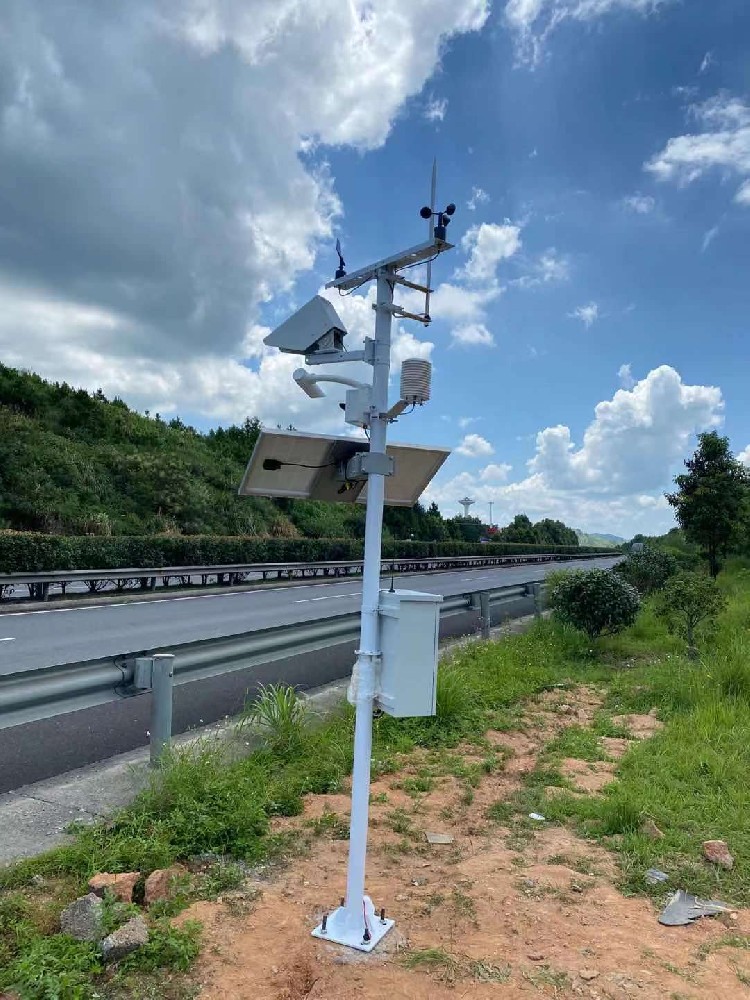
No. Ask for the actual model, performance conditions and documentation required by the study. A label alone does not establish uncertainty, traceability or suitability for a particular comparison.
No. Resolution is only one consideration. Calibration, repeatability, exposure, response and processing can matter more. Assess the uncertainty of the intended comparison instead of treating the displayed step as the whole error.
No. Averaging may reduce some random variation, but a persistent offset or environmental influence can remain. The analysis must identify which contributions averaging addresses and which it does not.
Not necessarily. It is a useful relative check. Calling it calibration requires an appropriate reference, method and documented relationship. State the purpose and limitations of the comparison period explicitly.
No. Choose performance that supports the research requirement under the installed conditions. A more expensive instrument at the wrong location may be less useful than a suitable instrument with controlled exposure and a clear comparison method.
No. Temperature, humidity, wind and irradiance do not constitute pollutant concentration measurements. Add the specific instruments and sampling arrangement required for any air- or water-quality component of the research.
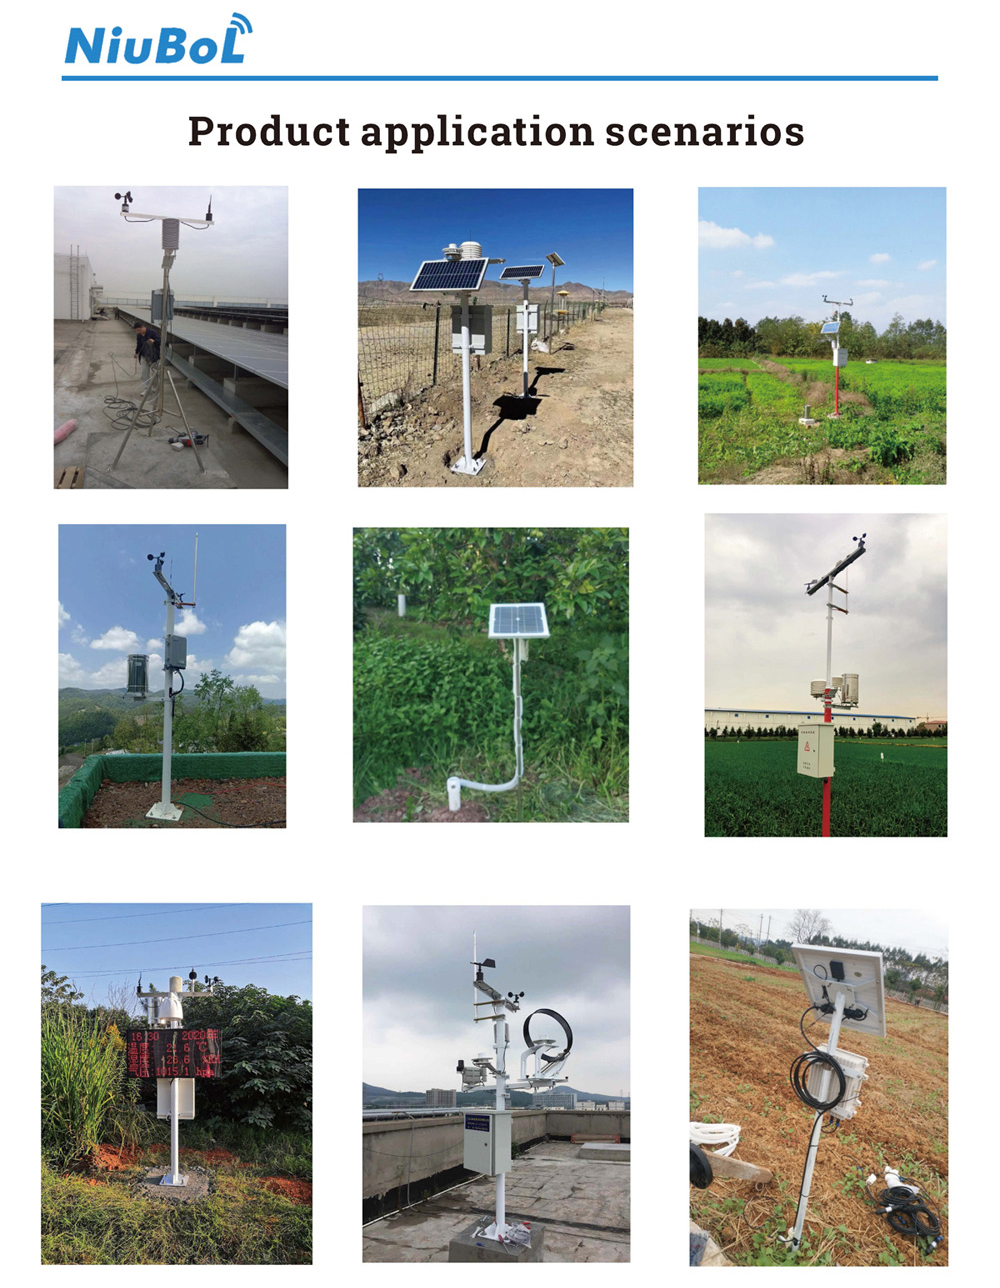
Research meteorological stations are useful when their performance can support the study's actual comparison. Specify the quantity and expected difference, examine uncertainty and response, and verify the acquisition method before deployment. Select a NiuBoL configuration only where the instruments and documentation match those requirements rather than relying on a general high-precision claim.
Prev:Commercial Weather Station Height: 2.5 m, 3.5 m or 10 m?
Next:Offline Weather Station Selection: Local Records Without Internet
Related recommendations
Sensors & Weather Stations Catalog
 Agriculture Sensors and Weather Stations Catalog-NiuBoL.pdf
Weather Stations Catalog-NiuBoL.pdf
Agriculture Sensors Catalog-NiuBoL.pdf
Water Quality Sensor Catalog-NiuBoL.pdf
Related products
 Combined air temperature and relative humidity sensor
 TDR Soil Moisture & Temperature Sensor for irrigation| RS485 |4-20mA| NBL-S-THR
 Soil pH sensor RS485 soil Testing instrument soil ph meter for agriculture |NBL-S-PH
 Wind Speed sensor Output Modbus/RS485/Analog/0-5V/4-20mA
 Tipping bucket rain gauge for weather monitoring auto rainfall sensor RS485/Outdoor/stainless steel
 Pyranometer Solar Radiation Sensor 4-20mA/RS485


Screenshot, WhatsApp to identify the QR code
WhatsApp number:+8615367865107
(Click on WhatsApp to copy and add friends)

