







An accurate fertigation controller ratio requires measured stock delivery, measured water volume and a clearly defined denominator. A displayed dilution setting cannot establish nutrient dose by itself. Verify whether the ratio refers to carrier water or final mixture, then account for stock concentration, meter uncertainty and pulse resolution before accepting the calculated delivery.
Define the fertigation controller injection ratio first
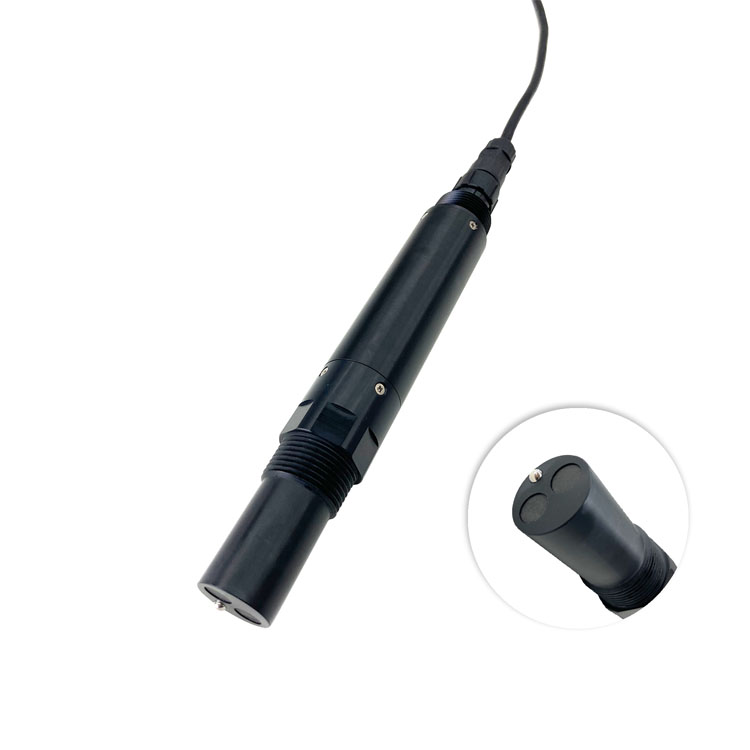
NBL-WQ-EC liquid conductivity measurement input; injection controller and pump are separate.
Write “litres of stock per litre of carrier water” or “litres of stock per litre of final mixture” on the commissioning sheet. Both conventions occur in dosing discussions, but they are not mathematically identical. A fertigation controller must use the same convention as the recipe calculation and the verification measurement. An unexplained ratio on a touchscreen leaves that comparison unresolved.
For one stock channel, call the stock volume S and the carrier-water volume W. The stock-to-carrier ratio is S/W; the stock fraction in the final mixture is S/(W + S). With several channels, add every injected volume to the final-mixture denominator. Include any other added liquid rather than silently treating it as carrier water or ignoring it.
Separate an injection-ratio target from a nutrient-concentration target. A stock containing a known amount of one nutrient per litre allows a mass balance for that nutrient. Total fertilizer product mass is not the same as nitrogen mass. Identify the nutrient basis on the stock-preparation record and obtain appropriate analysis where composition is uncertain; the controller cannot correct an unidentified stock formulation.
Calculate one complete dosing window in litres
Here is an illustrative calculation based on assumed site values, not a measured field record. Assume one completely mixed stock channel, additive liquid volumes and no losses. Carrier water contains none of the example nutrient. These assumptions isolate the arithmetic; an actual nutrient budget must include any contribution from source water and other injected channels.
The assumed carrier flow is 12 m³/h, equivalent to 12,000 L/h. A stock-to-carrier setting of 1:160 requires 12,000 / 160 = 75 L/h of stock. Over an 18 min dosing window, carrier volume is 12,000 × 18 / 60 = 3,600 L. Stock delivery is 75 × 18 / 60 = 22.5 L, giving 3,622.5 L of final mixture.
| Quantity | Assumed input or calculated result | Basis and unit |
|---|---|---|
| Carrier flow | 12 | m³/h, upstream of injection |
| Dosing window | 18 | min, common start and end |
| Stock-to-carrier setting | 1:160 | L stock per L carrier |
| Required stock flow | 75 | L/h, calculated |
| Carrier volume | 3,600 | L, calculated |
| Stock volume | 22.5 | L, calculated |
| Final-mixture volume | 3,622.5 | L, additive-volume assumption |
| Stock nutrient concentration | 12 | g/L of the example nutrient |
| Nutrient delivered | 270 | g, excluding source contribution |
| Final nutrient concentration | 74.53 | mg/L, calculated |
The final stock fraction is 22.5 / 3,622.5 = 1/161, or approximately 0.6211%. Nutrient delivery is 22.5 L × 12 g/L = 270 g. Dividing 270,000 mg by 3,622.5 L gives 74.53 mg/L. Each calculation uses the same window and units; no EC-to-nutrient conversion is involved.
Using the carrier denominator alone gives 270,000 / 3,600 = 75 mg/L, which is 0.625% above the final-mixture result. That difference is small in this example, but it is systematic rather than random. Confirm which convention the fertigation controller applies before comparing its recipe estimate with a laboratory result or a downstream water totalizer.
What measurement uncertainty can the ratio actually support?
Assume bounded errors of ±2% for measured stock volume, ±1% for carrier volume and ±3% for stock nutrient concentration. These are example allowances, not specifications for NiuBoL equipment. Calculate limiting combinations rather than describing the controller as “precise” without an error basis. The stock-to-carrier ratio is smallest when stock is low and carrier water is high.
For the ratio alone, the low combination is 22.05 / 3,636 = 0.006064 L/L, or 2.97% below the nominal 0.00625 L/L. The high combination is 22.95 / 3,564 = 0.006439 L/L, or 3.03% above nominal. Opposing denominator errors make these bounds slightly asymmetric. They are not a confidence interval or an experimentally demonstrated performance result.
| Error-budget item | Lower value | Upper value | Assumed condition |
|---|---|---|---|
| Stock volume | 22.05 L | 22.95 L | ±2% of 22.5 L |
| Carrier volume | 3,564 L | 3,636 L | ±1% of 3,600 L |
| Stock nutrient concentration | 11.64 g/L | 12.36 g/L | ±3% of 12 g/L |
| Stock-to-carrier ratio | 0.006064 L/L | 0.006439 L/L | Opposing volume extremes |
| Final nutrient concentration | 70.16 mg/L | 79.08 mg/L | Combined limiting inputs |
The lower nutrient result is 11.64 × 22.05 × 1,000 / (3,636 + 22.05) = 70.16 mg/L. The upper result is 12.36 × 22.95 × 1,000 / (3,564 + 22.95) = 79.08 mg/L. These bounds include the stock formulation allowance and injected volume. They do not include precipitation, unmeasured leakage or unequal delivery between emitters.
A fertigation controller showing extra decimal places cannot narrow those input allowances. Before tightening a recipe tolerance, identify which contribution dominates and whether the test method can distinguish an unacceptable dose. A bound that already exceeds the permitted nutrient variation means the verification arrangement is insufficient; it does not justify silently widening the crop programme's acceptance limit.
Check stock delivery independently of the controller counter
A controlled stock-tank weighing test can provide a separate volume estimate when density is known at the test temperature. In the same assumed example, a net mass loss of 27 kg and density of 1.20 kg/L imply 27 / 1.20 = 22.5 L. Use net liquid mass, not gross tank weight, and account for any simultaneous refill or return flow.
Assuming water density of 1.00 kg/L would instead report 27 L, a 20% overstatement relative to 22.5 L. Density is therefore part of the conversion, not a negligible detail. Include scale resolution, density uncertainty and any movement of attached hoses in the test assessment. Do not present a tank weighing result as independent if it reuses the controller's own assumed density without verification.
Synchronize the weighing interval with the carrier totalizer and fertigation controller event. A stock measurement covering preparation or flushing cannot be divided by a water total covering only active injection. Record both counter endpoints and any reset. Keep the dosing-window balance separate from the whole irrigation event so clean-water prefill and flushing do not dilute the reported injection ratio unintentionally.
Pulse resolution can hide a short dosing error
Suppose the example carrier meter produces 1 pulse per 20 L. The 3,600 L window contains 180 pulses. Under a conservative assumed endpoint allowance of ±1 pulse, count resolution contributes ±20 / 3,600 × 100 = ±0.56% of window volume. This is a counting allowance only; it does not replace the meter's calibration error or include missed pulses.
For a stock meter with an assumed 0.05 L per pulse, the 22.5 L delivery gives 450 pulses and a corresponding ±0.22% allowance. On a shorter 0.5 L stock test, the same ±0.05 L allowance becomes ±10%. A very short test may therefore be unable to verify the required injection ratio even when the pump appears steady.
Check that pulse width, input filtering and counter capacity suit the actual instruments. A logged pump command is not a measured stock pulse, and a pulse train is not proof of calibration. For the fertigation controller, compare independent totals over a window long enough to expose the required difference while remaining within the approved test volume and operating conditions.
Use EC and pH as checks, not nutrient mass meters
The NiuBoL NBL-WQ-EC water conductivity sensor provides liquid conductivity measurements for a compatible control system. Its specified accuracy is ±1% FS. On its 0–5,000 μS/cm range, that term equals ±50 μS/cm, or ±0.05 mS/cm. It is a full-scale term, not 1% of whichever value happens to be displayed.
A fertigation controller comparing assumed readings of 1.50 and 1.53 mS/cm sees a difference of 0.03 mS/cm. That difference is smaller than the single-channel ±0.05 mS/cm specification term on the selected range; it cannot alone establish a real nutrient-dose change. A comparison involving separate instruments needs both uncertainty contributions and consistent temperature handling, not just matching display digits.
Conductivity responds to the combined ionic mixture rather than a named nutrient. Keep recipe identity and the volumetric balance separate from EC plausibility checks. The NBL-WQ-PH liquid pH sensor supplies another distinct measurement; pH does not establish fertilizer mass either. Match the sampling arrangement to each probe's pressure limit instead of assuming both tolerate the irrigation main.
These probes are measurement inputs, not evidence of a complete NiuBoL dosing machine or a specified injection accuracy. Check the receiving RTU for compatible acquisition and recording. Fouling, poor representative sampling and an unverified stock composition can invalidate a concentration comparison even when the controller's arithmetic is correct.
Fertigation ratio verification FAQ
Does 1:160 mean stock is exactly 0.625% of the final mixture?
Only if the ratio explicitly uses final-mixture volume as its denominator. In the carrier-water convention used here, one litre of stock joins 160 litres of water, giving 161 litres altogether. The resulting stock fraction is 1/161, about 0.6211%. Write the convention beside the controller setting and use that same basis for acceptance calculations.
How can I tell whether the injection ratio is accurate?
Compare independently measured stock delivery and carrier volume over matching start and end times. Include both measurement uncertainties and any stock-concentration allowance when evaluating nutrient concentration. A displayed ratio, pump run time or command percentage cannot establish delivered volume by itself. Agree the decision rule before testing, especially when the result lies close to an acceptance boundary.
Can matching EC readings prove the fertilizer recipe is correct?
No. Different ionic mixtures can have similar conductivity, and source-water salts contribute to the result. Matching EC readings support a limited consistency check under comparable temperature and sampling conditions; they do not identify individual nutrients. Verify stock preparation and delivered volumes independently, with appropriate chemical analysis when the required decision concerns nutrient identity or composition.
Why does a short calibration test give inconsistent ratios?
Pulse quantization, changing flow and mismatched measurement windows can dominate a short test. In the assumed stock-meter example, one 0.05 L pulse is 10% of a 0.5 L delivery. Extend the test appropriately and capture both counter endpoints. If disagreement persists, investigate meter calibration and actual injection behavior rather than averaging away an unexplained discrepancy.
Can I convert stock-tank mass loss directly into litres?
Use volume equals net mass loss divided by stock density, with density appropriate to the solution and temperature. Exclude refill, return flow and other withdrawals during the window. In this example, 27 kg at 1.20 kg/L corresponds to 22.5 L. Treating that concentrated solution as water would overstate volume and distort the calculated injection ratio.
Does controller accuracy describe the dose at every emitter?
No. A correct injection ratio at the headworks does not establish uniform nutrient delivery across the irrigation network. Mixing, branch distribution, blockage and unequal emitter flow remain separate limitations. Verify the controller's metering balance first, then assess representative delivery points under the irrigation design's acceptance procedure. Do not convert a headworks calculation into an unsupported claim about crop uptake.
Accept the dose only when the evidence can resolve it
A fertigation controller should be accepted against a defined ratio convention and a reproducible measurement balance. In the assumed 18 min window, 22.5 L of stock joins 3,600 L of carrier water, yielding 74.53 mg/L of the example nutrient. Check independent volumes, stock composition and uncertainty before approving a dosing tolerance; an accurate calculation still depends on trustworthy inputs.
Share the stock concentration basis, meter pulse factors and required dosing tolerance when discussing NiuBoL measurement integration. Include the liquid conditions and existing controller interfaces so the sensor scope can be assessed separately from pump performance and agronomic recipe approval.









