







Insect monitoring with a light trap measures insects attracted and captured under a particular lamp, location and operating schedule. A larger catch does not automatically mean a more infested crop. Compare the same target group under comparable sampling conditions, and record lamp spectrum, canopy position, competing lights and actual collection hours before interpreting a difference.
Which lamp wavelength belongs in an insect monitoring record?
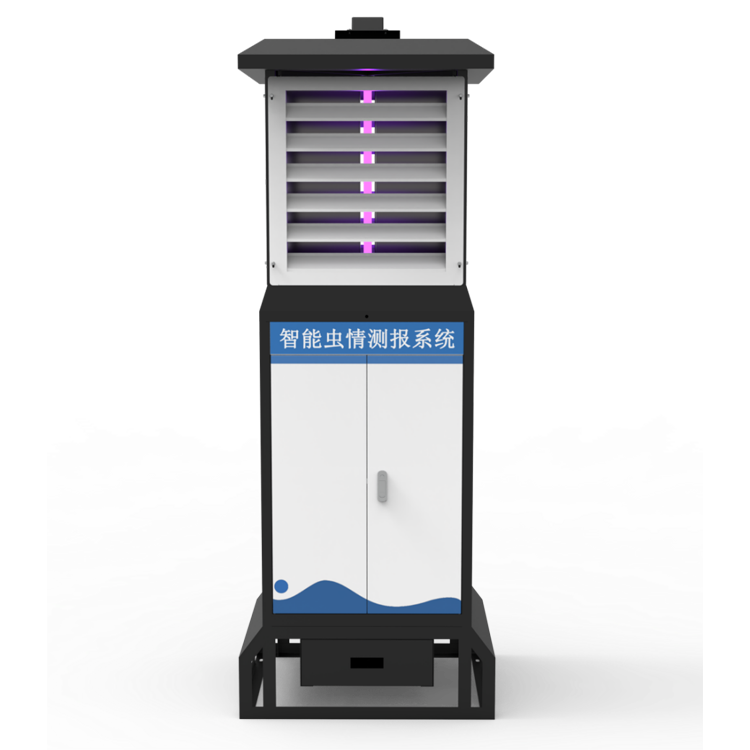
NBL-IoT-SRPMS insect monitoring equipment; lamp configuration and placement must be recorded for comparable catches.
Start with the installed light source, not the cabinet name. Two lamps can look equally bright to an observer while presenting different spectral signals to insects. Electrical wattage does not specify the emitted spectrum or the light reaching a flying insect. Request the replacement lamp identification and keep it with the station history so a later substitution is visible.
The NiuBoL NBL-IoT-SRPMS remote monitoring terminal uses an 18 W attraction tube with a specified wavelength band of 365–395 nm. The separate wind-suction product uses LED tubes at 365 nm and 395 nm. Those descriptions do not establish identical emission distributions. A pair of nominal wavelengths is not evidence that every wavelength between them has equal intensity.
| NiuBoL equipment | Light specification | Capture arrangement | Comparison boundary |
|---|---|---|---|
| NBL-IoT-SRPMS | 18 W; 365–395 nm | Collection, processing and specimen imaging | Keep the installed tube configuration identified |
| Wind-suction solar insect trap | 365 nm and 395 nm LED tubes | Fan-assisted collection | Do not equate its catch with cabinet catch |
| Frequency-vibration solar insect trap | 320–680 nm; main wavelength 365 nm | High-voltage grid | Different light and specimen handling method |
These are different equipment classes, not interchangeable sampling heads. Use the remote insect monitoring terminal when the requirement includes its configured specimen imaging and reporting workflow. The wind-suction solar trap and frequency-vibration solar trap use different collection mechanisms. Do not assume that purchasing a control lamp also supplies reviewable image records.
Avoid choosing a universal wavelength for all target insects. Confirm that the proposed attraction method is appropriate for the locally relevant group, and retain non-target observations separately where the programme requires them. A broad catch is not automatically a better monitoring sample. A lamp that attracts more unrelated material can change the meaning of a pooled nightly total.
Record trap location as part of the measurement method
A trap beside an illuminated building does not encounter the same attraction environment as a trap beside an unlit crop block. Photograph nearby lighting after dark as well as during installation. Record whether those lights operate continuously, on a timer or only during vehicle movements. A daytime location photograph cannot reveal a lighting change that occurs midway through collection.
Use an installation sketch that identifies crop boundaries, canopy, access lanes and obstructions. A farm coordinate without this context is insufficient for comparison. Record both the lamp elevation and the canopy reference. The question is not simply how high the pole stands, but how the attraction opening is exposed to the insects and habitat being investigated.
For an illustrative calculation based on assumed site values, not a measured field record, place an opening at 160 cm above ground. With an 80 cm canopy, the opening is 80 cm above the crop. If canopy height later reaches 140 cm, clearance becomes 20 cm. The 60 cm reduction changes exposure even though nobody moved the pole.
Those heights are a bookkeeping example, not an installation recommendation. Use the supplied equipment's mounting limits and a target-appropriate field method. Never raise a heavy cabinet or change electrical supports simply to match another station. Record crop growth and pruning as changes in the sampling environment, and inspect whether vegetation has blocked the approach to the collection opening.
Insect monitoring locations also need a stated biological purpose. A boundary station can indicate activity near a particular edge; it should not silently become the reference for the whole crop interior. Keep the purpose with its identifier. If a station is relocated after harvesting or construction, start a documented location segment instead of treating the series as unchanged.
Can catch per hour make two lamps comparable?
Actual collection time is a useful denominator, but it cannot remove every source of difference. This is an illustrative calculation based on assumed site values, not a measured field record. The table follows one consistently identified target group; the assumed catches illustrate arithmetic, not a biological threshold or measured trial.
| Assumed sample | Target catch | Active collection time | Catch divided by active time | Collection window |
|---|---|---|---|---|
| A1 | 96 insects | 8 h | 12 insects/h | 19:00–03:00 |
| B1 | 72 insects | 6 h | 12 insects/h | 19:00–01:00 |
| A2 | 117 insects | 9 h | 13 insects/h | 19:00–04:00 |
| B2 | 78 insects | 6 h | 13 insects/h | 19:00–01:00 |
| A3 | 140 insects | 10 h | 14 insects/h | 19:00–05:00 |
| B3 | 98 insects | 7 h | 14 insects/h | 19:00–02:00 |
| A4 | 165 insects | 11 h | 15 insects/h | 19:00–06:00 |
| B4 | 120 insects | 8 h | 15 insects/h | 19:00–03:00 |
For sample A1, 96 insects divided by 8 h equals 12 insects/h; B1 gives the same rate from 72 / 6. The absolute catch differs by 24 insects. Relative to B1, that is 33.3% more captured insects, not evidence of 33.3% greater pest density. Report the denominator beside the count instead of interpreting the larger total alone.
The second assumed pair gives 117 / 9 = 13 insects/h and 78 / 6 = 13 insects/h. For the third pair, 140 / 10 and 98 / 7 both give 14 insects/h. The fourth pair yields 15 insects/h from either 165 / 11 or 120 / 8. These equal averages do not show that activity was constant within any collection window.
Pooling the four A samples gives 518 insects over 38 h, or approximately 13.63 insects/h. The B samples total 368 insects over 27 h, or approximately 13.63 insects/h when rounded. The denominators must be summed along with the catches. Averaging the four displayed hourly rates equally would give 13.5 insects/h, a different quantity because it gives every sample equal weight.
A missing 2 h segment from an intended 8 h night leaves 6 h of active collection, equivalent to 75% of scheduled time. Mark the absent interval explicitly. A rate from the remaining hours cannot reconstruct what happened during the missing period, particularly if the target insects concentrate their flight activity near dusk or another short window.
For comparable insect monitoring, align the biological time window where possible and show interruptions. An early-evening sample and an overnight sample may have identical hourly averages while representing different activity periods. Do not scale a short-window catch to a full night unless a separately justified temporal model supports that inference. The arithmetic alone supplies no such model.
Test a proposed relocation without confusing it with population change
Before moving a long-running station, write down why its current location is unsuitable. Possible reasons include new lighting, changed vegetation, obstructed access or a different crop question. Preserve photographs and the final collection records from the old position. A relocation undertaken without a record can look like an abrupt biological event months later when staff inspect the trend.
Where practical, use matched equipment and overlapping collection dates to compare the proposed positions. Keep lamp type and operating windows aligned, and log departures. Side-by-side equipment can itself alter attraction, so do not assume placing lamps close together makes the test independent. Choose a layout suitable for the target and sampling method with the responsible field specialist.
A position-switch exercise can help distinguish an equipment difference from a persistent location effect, but it is not automatic proof. Weather and insect activity may change between periods, while neighbouring traps may interact. Retain the individual sample records rather than collapsing the exercise into one correction factor. A repeatable difference under tested conditions may not persist after canopy growth or a lighting change.
For a proposed 4-night overlap, keep 4 paired date records rather than one combined weekly bar. If rain interrupts one lamp on 1 of those nights, identify that pair as limited. Three comparable pairs and one interrupted pair are not four equivalent observations. Decide beforehand whether the purpose is diagnosing installation or establishing a new long-term station baseline.
When a catch comparison becomes misleading
Insect monitoring results cannot support a location ranking when the lamps use undocumented replacements, different collection methods or unknown operating windows. Sorting the dashboard by total catch does not repair those differences. Separate method groups first. A large sample from one arrangement and a small sample from another may reflect attraction and collection rather than different crop conditions.
Rain control and power protection deserve particular attention. A lamp can remain represented in the platform while collection is inactive. Check operating state and collection records rather than assuming an online symbol means a complete night. Do not disable protective functions merely to make the data table look complete. An interrupted sample should remain identifiable as interrupted.
Neither catches per hour nor matching lamp labels provide insects per hectare. The sampled attraction area is not established by a marketing coverage figure, and overlapping attraction cannot be resolved with a simple land-area division. Use field scouting for crop injury and life stages not represented by the trap. A change in adult captures is a reason to investigate, not a standalone pesticide instruction.
Specify the comparison records before buying replacement equipment
Ask a supplier to identify the exact lamp, collection head and allowed operating schedules for the delivered version. Include replacement-part identification in the handover. For an existing insect monitoring programme, an undocumented substitute can be more disruptive than a clearly recorded temporary outage because it leaves a plausible series with an unexplained change in sampling method.
Require an export that joins station identity, location version, target group, collection window, active duration and operating interruptions. Confirm which records are actually available from the proposed controller and which require an operator's log. A receiving platform should preserve the original count and time information rather than retaining only a rounded hourly rate that cannot be checked later.
Have the operator demonstrate a routine collection and a deliberately recorded service interruption without defeating equipment protection. Then retrieve both records and check their meaning. Confirm responsibility for lamp replacement, vegetation inspection and location photography. A procurement decision should cover the continuity of the sampling method, not just delivery of a cabinet and an attractive chart.
Practical questions about light spectrum and trap placement
Are 365 nm and 395 nm lamps equivalent for comparison?
No. Nominal wavelengths describe different attraction configurations, and they do not specify a complete emission distribution. Even lamps sharing a wavelength label may differ in optics and output. Keep the installed source identified and compare the relevant target group under matched conditions. Do not apply a universal conversion between catches from different spectra.
Does a higher catch prove the location has more pests?
Not by itself. Position changes exposure to insects, competing lights and crop boundaries. Different active hours also change the opportunity to collect a sample. Compare the same target group with method details attached, then inspect the crop where appropriate. A trap catch is evidence from its collection setting, not an independent census of field infestation.
Why report both total catch and insects per hour?
The total preserves the observed sample, while the hourly figure makes the time denominator explicit. In the assumed example, 96 insects over 8 h and 72 over 6 h both yield 12 insects/h. Equal averages still may cover different flight periods. Keep the collection window and interruptions alongside both numbers.
Can a monitoring lamp be installed beside a building light?
Only after assessing whether that location serves the intended sampling purpose. Another light can change the attraction environment or operating conditions. Record its direction and schedule, inspect the site after dark, and retain photographs. There is no universal separation distance supplied by these calculations; establish an appropriate position for the specific target and equipment.
Should I adjust mounting height as the crop grows?
First follow the equipment's permitted installation arrangement and the chosen field method. Record canopy clearance as well as elevation above ground. A height adjustment changes the sampling configuration and should be dated. Do not move or elevate a heavy powered assembly without suitable installation support merely to keep a graph apparently consistent.
Can I combine catches from imaging and solar control lamps?
Keep them as separate method groups unless a suitable comparison establishes how they may be used together. Fan collection, grid treatment and a cabinet's specimen workflow handle material differently. Similar nominal wavelengths do not remove those differences. Specify whether the project needs captured specimens, reviewable images or a control function before treating equipment as interchangeable.
Preserve the sampling conditions before interpreting a catch change
Insect monitoring trends require consistent lamp configuration, location identity and collection windows. The assumed 96-insect, 8 h sample equals 12 insects/h, but that rate cannot correct for a different spectrum or habitat. Check the installation record and active periods before calling a catch change biological, and use crop observations for decisions that require evidence of injury.
Describe the target insects, crop canopy and nearby night lighting when discussing a NiuBoL installation or replacement, so the sampling arrangement can be reviewed before equipment is selected.









