





— Blogs —
—Products—
 Consumer hotline +8618073152920
WhatsApp:+8615367865107
Address:Room 102, District D, Houhu Industrial Park, Yuelu District, Changsha City, Hunan Province, China
Product knowledge
Time:2025-09-09 16:39:30 Popularity:1499
Soil moisture sensor accuracy depends on the measured quantity, sensor principle, calibration and contact with the surrounding soil. Dielectric probes estimate volumetric water content; tension sensors measure how tightly water is held. Their outputs are not interchangeable. For irrigation or research, evaluate the offered model in representative soil and distinguish instrument error from spatial differences between monitoring points.

Volumetric water content, or VWC, is the volume of liquid water divided by the total soil volume. A reading of 0.25 m3/m3 corresponds to 25% by volume. It is not 25% relative humidity, 25% of saturation or 25% of the water available to a crop.
Matric potential describes how strongly water is retained by the soil matrix and is commonly expressed in kPa. The relationship between VWC and matric potential depends on the soil's water-retention characteristics. Two soils at the same VWC can present different conditions for plant extraction; a universal conversion from percent moisture to kPa is unsuitable.
| Quantity | Typical method | Decision it supports |
|---|---|---|
| Volumetric water content | Dielectric probe: TDR or FDR | Water storage, wetting and drying at the measured depth |
| Matric potential | Tensiometer or suitable porous matrix sensor | Water retention and tension-based irrigation thresholds |
| Gravimetric water content | Wet and dry sample mass | Reference comparison, with density information for conversion to VWC |
The Oregon State University soil-moisture guide distinguishes these quantities and their interpretation. Choose the quantity needed by the project before comparing instrument prices or accuracy claims.
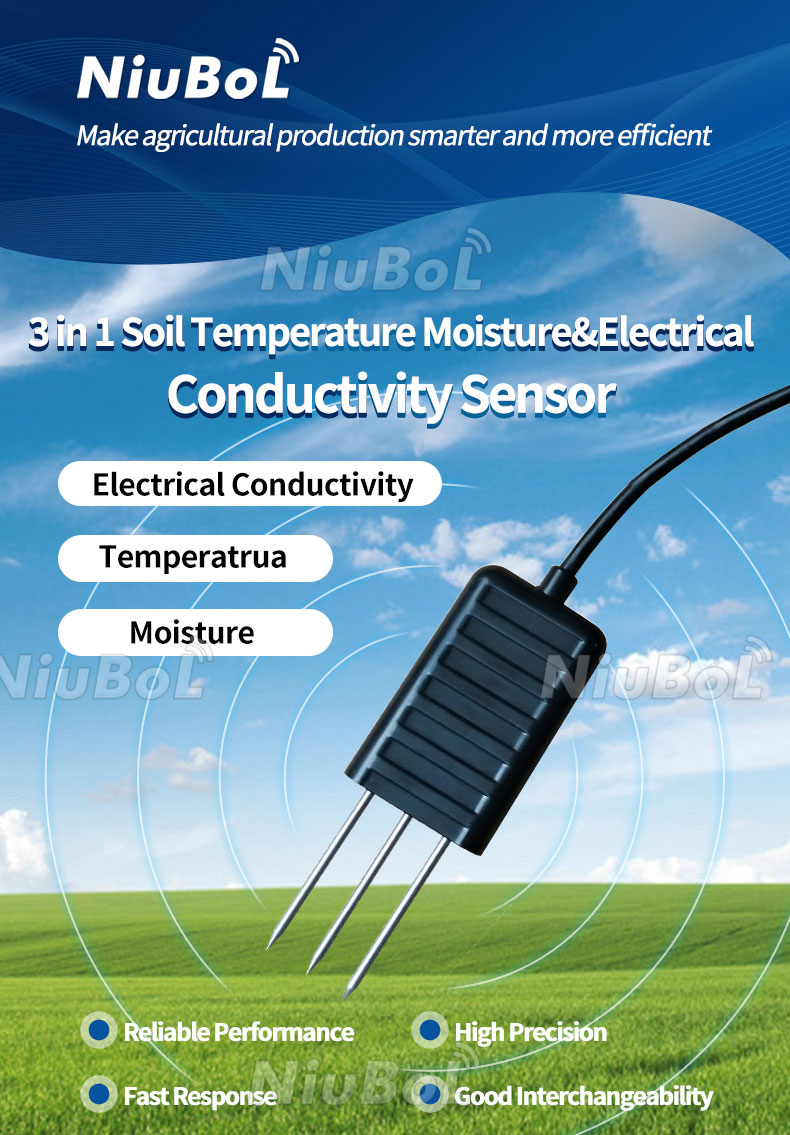
Water changes the dielectric properties of the soil around a probe. A TDR instrument analyzes the propagation response of an electromagnetic pulse. FDR or capacitance instruments analyze a frequency-domain electrical response. Both use a calibration relationship to convert their measured response into water content; neither directly counts the water molecules in an entire field.
Electrode geometry, electronics and signal processing affect the result. The labels TDR and FDR do not by themselves establish which finished instrument will meet a given acceptance requirement. Test the complete model, rather than assigning every TDR probe a research role and every capacitance probe a low-cost irrigation role.
Resistance-based instruments also need careful identification. A porous resistance block can estimate matric potential through its own calibration. Exposed conductive pins used as a simple wet/dry indicator are not equivalent to that instrument. Comparing both under a generic "resistive sensor" accuracy label hides a major difference in measurement meaning.
Resolution is the smallest reported increment. Accuracy describes agreement with a reference under stated conditions. Repeatability describes how closely repeated observations agree under similar conditions. A probe can report 0.1% increments and repeat consistently while retaining a substantial bias in a soil outside its calibration conditions.
Ask what a percentage accuracy means. If an acceptance criterion explicitly states +/-3 VWC percentage points, a 30% VWC reference permits 27-33% under that criterion. A relative error of +/-3% of the 30% reading would instead be +/-0.9 percentage point. These are explanatory calculations, not an interpretation of every product's unspecified percentage notation.
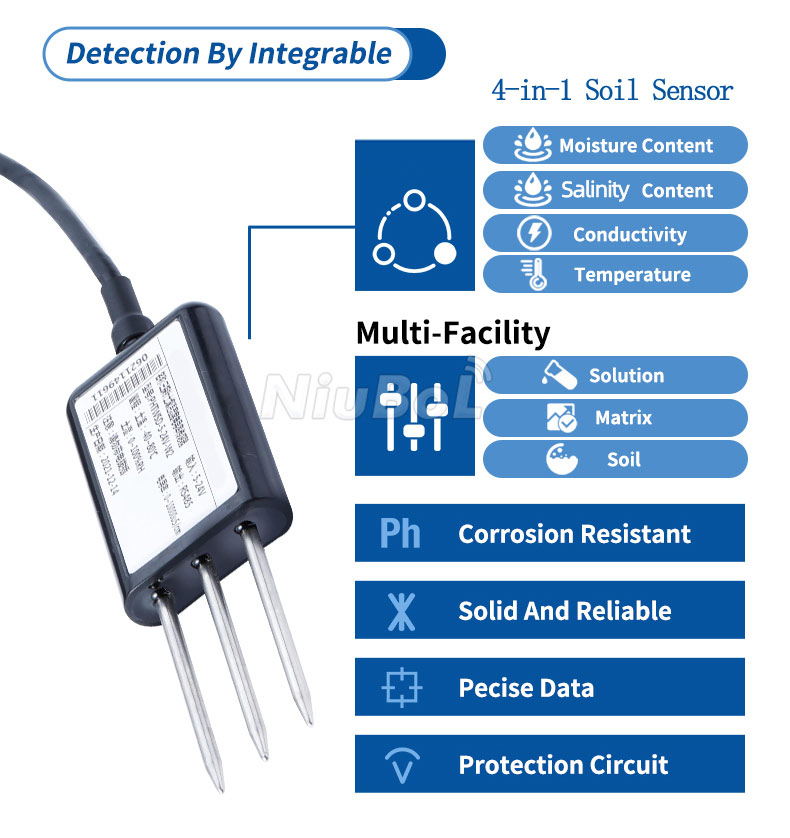
The NBL-S-THR measures soil moisture and temperature. The NBL-S-TMC adds EC, while the NBL-S-TMCS provides temperature, moisture, EC and salinity channels. Additional channels offer context; they do not automatically improve the moisture channel's accuracy.
| Item | NBL-S-THR | NBL-S-TMC / NBL-S-TMCS |
|---|---|---|
| Moisture principle | TDR | FDR |
| Moisture output range | 0-100% | 0-100% |
| Moisture resolution | 0.1% | 0.1% |
| Listed moisture accuracy | +/-3% | +/-5% |
| Supply | DC 12-24 V | DC 5-24 V or 12-24 V, configuration-dependent |
| Output | RS485 Modbus RTU, 4-20 mA or voltage version | RS485 Modbus RTU |
| Protection | IP68 | IP68 |
| Operating environment | -40 to 80 degrees C | -40 to 85 degrees C |
The listed accuracy notation must be tied to the offered test conditions and acceptance basis before it becomes a contractual tolerance. A 0-100% output scale does not mean mineral soil can contain 100% water by total volume. Saturated VWC depends on pore volume. An operating-temperature limit also does not establish accurate liquid-water interpretation in frozen soil.
Air gaps around the sensing rods alter the dielectric environment. Loose backfill, stones, cracks and repeated movement can produce a reading that does not represent the undisturbed layer. Install into representative soil with close contact, without forcing rods through hard material or pulling the instrument into place by its cable.
Choose depth from the root profile and monitoring objective. Under drip irrigation, position relative to the emitter can be as important as depth. A probe in the wetting center and one outside it can disagree correctly. Record each probe's location and depth rather than averaging away a real spatial pattern.
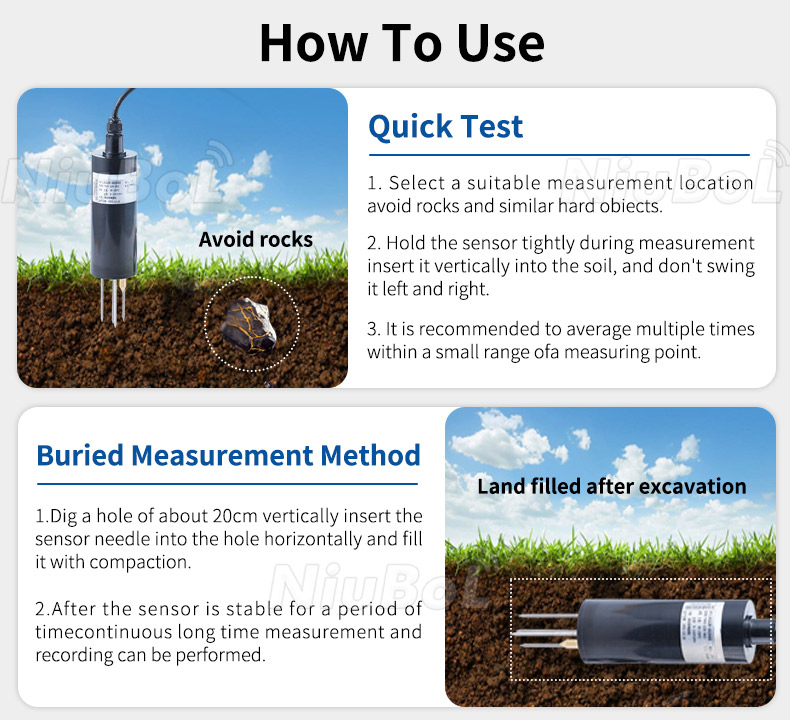
For a defensible field comparison, collect representative samples close to the sensing depth and time without destroying contact around the installed probe. Compare over several moisture states, not just one wet sample. Keep a subset of checks separate from any samples used to fit a correction.
Gravimetric water content is water mass divided by dry soil mass. Converting it to VWC requires dry bulk density and water density: VWC = gravimetric water content x dry bulk density / water density. Use consistent units and a representative density measurement; a guessed density can introduce its own bias.
For illustration, 130 g of wet soil and 100 g after drying gives 0.30 g/g gravimetric water content. With a representative dry bulk density of 1.30 g/cm3 and water density approximated as 1.00 g/cm3, VWC is 0.39 m3/m3, or 39%. Comparing the sensor directly against 30% would confuse mass and volume bases.
Repeated paired comparisons can identify an offset, a changing slope or poor installation repeatability. A correction fitted to one soil layer should not be applied automatically to another layer with different density, texture or salinity. Investigate contact and decoding before changing calibration coefficients.
If a representative 300 mm soil layer changes by 0.03 m3/m3, the corresponding water-storage change is 9 mm: 0.03 x 300 mm. This calculation shows why an uncertainty of several VWC percentage points matters when a project tries to distinguish a small irrigation deficit. It assumes the measurement represents that layer; one point cannot establish that condition across a heterogeneous field.
For control, establish site-specific wet and dry operating limits with crop, soil and irrigation context. Verify that the probe responds to irrigation at the intended depth. Water saving and yield effects depend on the complete management system, not the sensor alone. Different soil zones may also require different moisture thresholds.
An RS485 Modbus RTU output requires the correct register, unit and scaling in the PLC or data logger. A factor-of-ten decoding error can resemble a calibration problem. With analog versions, check the ordered range, current or voltage input and engineering conversion.
For quotation and acceptance, provide soil type, salinity conditions, intended depths, expected water range, required tolerance and receiving equipment. Include the number of management zones and whether the objective is relative irrigation response or absolute research-grade water storage. These requirements determine the evaluation plan more usefully than a generic demand for a "high-accuracy" probe.
 NBL-S-THR-Soil-temperature-and-moisture-sensors-Instruction-Manual-V4.0.pdf
NBL-S-TMC-Soil-temperature-and-moisture-conductivity-sensor.pdf
NBL-S-TM-Soil-temperature-and-moisture-sensor-Instruction-Manual-4.0.pdf
NBL-S-TMCS-Soil-Temperature-Humidity-Conductivity-and-Salinity-Sensor.pdf
No universal ranking applies to every model and soil. Compare the offered specifications and representative paired measurements. Installation, calibration and water chemistry can outweigh a difference inferred from the principle label.
No. VWC is water volume per total soil volume. Available water depends on the soil's retention characteristics and the crop management basis. Establish the relevant limits for the soil and depth being monitored.
Check installation contact, depth, soil variation, position relative to irrigation and output decoding. Nearby points can contain genuinely different water contents. Swap-test or reference-check systematically before assigning the difference to sensor error.
Only use that procedure if it is explicitly supported for the delivered model. Air and water checks do not reproduce the dielectric structure of field soil or establish soil-specific VWC accuracy. Use representative reference samples for the required field claim.
No. EC provides useful salt-related context, but a separate EC channel does not establish a validated correction for air gaps, density changes or every saline soil. Check the model's implemented compensation and test the actual soil conditions.
Choose locations by management zones, variability and rooting depth, not acreage alone. Multiple depths can show whether irrigation reaches or passes the active root zone. The number needed for a research water balance can differ from a basic irrigation trend installation.
Soil moisture sensor accuracy is meaningful only when the quantity, units, reference method and field conditions are defined. Select a probe for the required decision, establish good soil contact and verify its output on the same water-content basis. Extra decimal places and additional channels cannot replace that evaluation.
Related recommendations
Sensors & Weather Stations Catalog
Agriculture Sensors and Weather Stations Catalog-NiuBoL.pdf
Weather Stations Catalog-NiuBoL.pdf
Agriculture Sensors Catalog-NiuBoL.pdf
Water Quality Sensor Catalog-NiuBoL.pdf
Related products
 Combined air temperature and relative humidity sensor
 TDR Soil Moisture & Temperature Sensor for irrigation| RS485 |4-20mA| NBL-S-THR
 Soil pH sensor RS485 soil Testing instrument soil ph meter for agriculture |NBL-S-PH
 Wind Speed sensor Output Modbus/RS485/Analog/0-5V/4-20mA
 Tipping bucket rain gauge for weather monitoring auto rainfall sensor RS485/Outdoor/stainless steel
 Pyranometer Solar Radiation Sensor 4-20mA/RS485


Screenshot, WhatsApp to identify the QR code
WhatsApp number:+8615367865107
(Click on WhatsApp to copy and add friends)

