





— Blogs —
—Products—
 Consumer hotline +8618073152920
WhatsApp:+8615367865107
Address:Room 102, District D, Houhu Industrial Park, Yuelu District, Changsha City, Hunan Province, China
Product knowledge
Time:2025-09-08 13:58:50 Popularity:1264
Agrometeorological stations combine local weather observations with the soil or crop measurements needed for an agricultural decision. A basic station may measure only atmospheric conditions; additional soil, leaf-wetness or canopy sensors depend on the task. The station supplies observations, not a guaranteed irrigation saving, disease diagnosis or yield forecast. Select the measurements and interpretation method together.
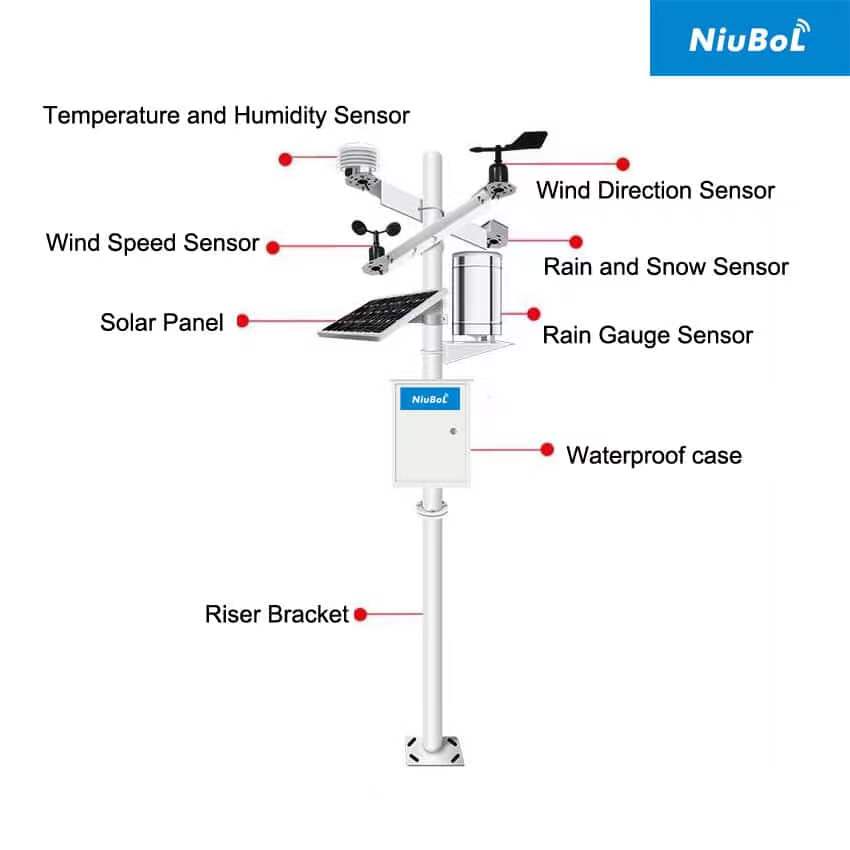
The distinction is its purpose and configuration, not a mandatory sensor count. Air temperature, humidity, wind, rainfall and solar radiation can support field management. Soil probes add root-zone observations. Leaf wetness or canopy temperature may support a particular crop model or investigation, but they are not included automatically in every station.
A forecast describes expected conditions over an area and time period. A field station records conditions at its installed location. They can be used together: the forecast helps plan work while local observations show what occurred. One does not make the other unnecessary, and one station cannot map every microclimate across a heterogeneous farm.
| Agricultural task | Relevant observations | Interpretation boundary |
|---|---|---|
| Irrigation planning | Weather inputs for evapotranspiration, rainfall and representative soil moisture | Crop stage, soil water storage and irrigation delivery remain necessary |
| Frost observation | Representative temperature points and local conditions | Air temperature alone may not describe leaf temperature or every low area |
| Disease-risk assessment | Temperature, wetness duration or other inputs required by a suitable model | Environmental risk is not confirmation that a pathogen or disease is present |
| Field operations | Wind, rain and relevant local conditions | Follow the operation's rules and product requirements; a station is not permission to proceed |
| Crop research | Documented weather and soil observations at defined locations | Experimental design and reference checks determine what conclusions are supported |
Reference evapotranspiration, ETo, describes water demand for a defined reference surface. The FAO Penman-Monteith method uses climatic observations including air temperature, humidity, radiation and wind with defined units and exposure assumptions. It does not turn an air-temperature reading alone into crop water use.
Crop coefficients and management information relate a reference estimate to a particular crop and stage. Rainfall and soil observations add information about water reaching and remaining in the root zone. The irrigation volume also depends on the actual distribution system. A station cannot establish water applied merely by observing that a pump was scheduled to run.
For illustration, an ETo of 5 mm/day and an appropriate crop coefficient of 0.8 give an estimated crop evapotranspiration of 4 mm/day. The numbers are examples, not a coefficient prescribed for a particular crop. The result is not automatically the irrigation dose: effective rainfall, soil water and application performance still affect the management decision.
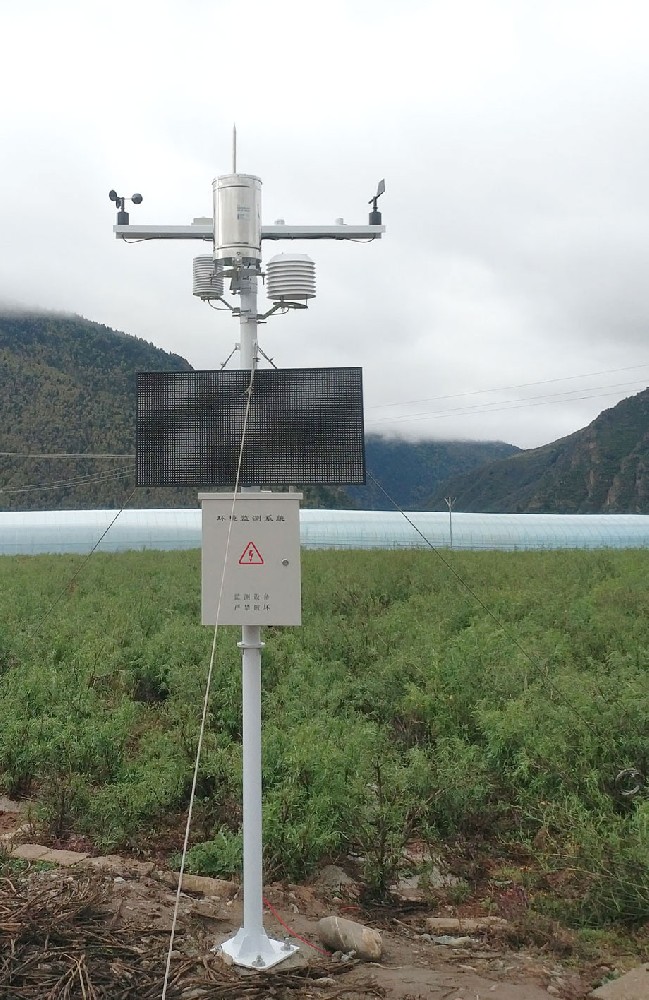
Frost conditions can vary with slope, canopy, soil moisture and local exposure. Choose temperature points for the crop location rather than placing every instrument beside the communications cabinet. Where leaf or canopy temperature is the decision variable, evaluate a suitable surface measurement separately from shielded air temperature.
Leaf-wetness duration can be an input to disease-risk models, but high relative humidity and actual surface wetness are not interchangeable. Sensor position, orientation and the model's assumptions matter. A risk output should support inspection and agronomic advice; it should not be presented as a direct disease measurement or a fixed reduction in chemical use.
Check whether a proposed model is appropriate to the crop, disease and region, and how missing data are handled. A generic platform's ability to display a risk index does not establish local validation. Keep measured channels distinct from estimates and management recommendations.
The NiuBoL weather-station range can be configured with separate atmospheric and soil instruments. If the task is rainfall documentation, the first requirement is a suitable gauge and usable time record. If the task is root-zone irrigation response, the first requirement may instead be representative soil depths and locations.
| Component example | Relevant specification or role | Selection implication |
|---|---|---|
| NBL-W-LBTH air sensor | Temperature -40 to 80 degrees C, +/-0.5 degree C; RH 0-100%, +/-5% RH | Check whether the required frost or model tolerance can be met |
| NBL-W-SS wind speed sensor | 0-45 or 0-70 m/s; IP65; output version selected for the logger | Choose range and observation height for the task |
| NBL-W-RS listed rain-gauge configuration | 0.2 mm resolution; 0-4 mm/min intensity range; operating temperature 0-50 degrees C | Check catch, tip conversion and suitability for local precipitation conditions |
| NBL-S-THR soil probe | Soil moisture and temperature; RS485 Modbus RTU version available | Define representative zones and rooting depths |
| Data acquisition and uplink | Reads sensors and transfers or stores observations according to configuration | Specify record interval, server and offline behavior separately |
These are separate components, not a universal station specification. The air sensor, rain gauge and soil probe serve different measurement tasks. Add a compatible solar-radiation instrument when the chosen method requires irradiance; an illumination reading in lux is not a direct replacement for solar irradiance in W/m2.
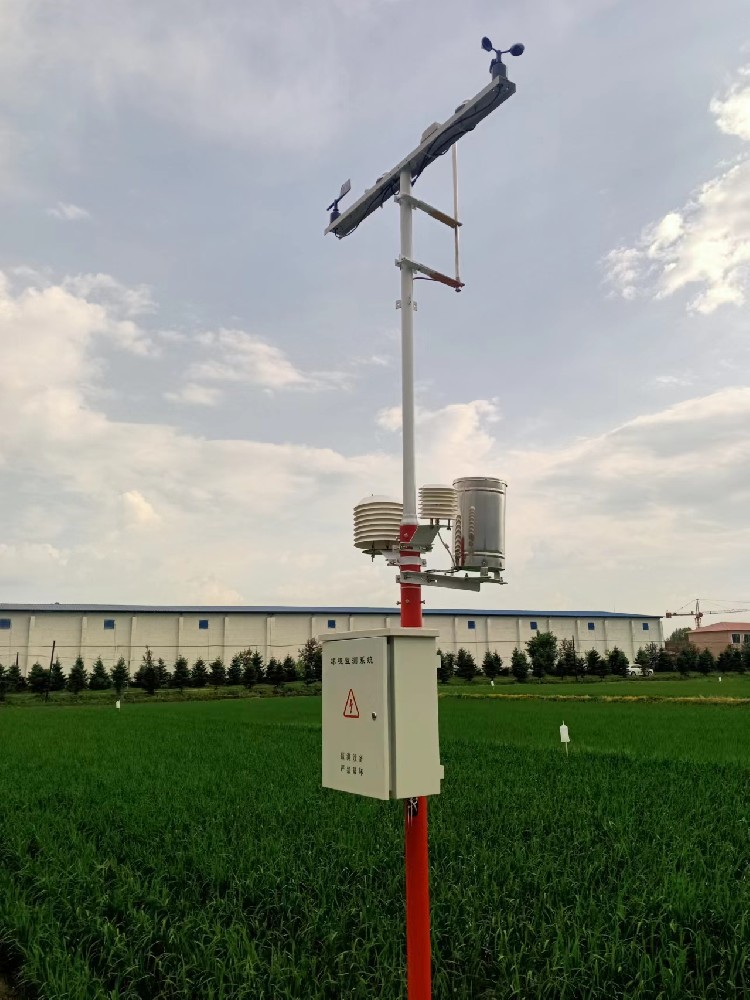
One well-maintained station can provide useful local weather history, but soil texture and topography can require additional soil points or temperature observations. Distinguish a central weather reference from distributed crop-zone measurements. More sensors at one mast do not resolve spatial variation elsewhere.
Record sensor positions, heights, soil depths and nearby obstructions. Set sampling and aggregation to suit the decision: daily totals may support one review while short wetness periods or temperature minima require another time basis. Keep missing records visible rather than treating them as dry or mild weather.
Check RS485 Modbus RTU compatibility, power and channel scaling at the logger. Remote access requires the corresponding communications equipment and service; neither wireless operation nor offline retransmission should be assumed for every station package.
Agree what will be compared before installation: irrigation timing against soil response, rainfall events against field records, or a risk model against local observations. Keep the baseline period and management changes visible. Without that basis, an improvement after installation cannot be assigned to the station alone.
For a NiuBoL project review, provide crop, location, field variability, intended decisions and existing irrigation or farm software. Include the measurements already available. The useful configuration fills a specific information gap rather than collecting every parameter without a plan for using it.
No. The required channels follow the task. Atmospheric observations can support weather history and some agricultural calculations; soil measurements add information for root-zone decisions. Specify them where they answer a defined question.
It can provide a local weather reference, but not necessarily every microclimate or soil zone. Review terrain, crop layout and soil variability before deciding how many additional points are needed.
Only an appropriately configured method can produce that estimate. Verify the required inputs, units, heights, crop information and handling of missing data. The result is not the same as delivered irrigation volume.
No. It describes surface wetness relevant to some models. Disease presence requires appropriate diagnosis, and risk interpretation depends on the crop, pathogen, model and representative sensor placement.
No fixed percentage can be assigned to the equipment alone. Effects depend on the starting management practice, crop, weather, irrigation system and how observations change decisions. Define a local evaluation instead of treating an unrelated case result as a guarantee.
Identify sensors and locations, mounting, power, data acquisition, communications and any calculation software. Define commissioning, maintenance access and the customer's interface. Those items determine whether the quoted system supports the intended agricultural use.
Agrometeorological stations are valuable when their observations resolve a particular farm-management question. Choose the measurement points and interpretation method together, distinguish estimates from measurements and assess results against a local baseline. This produces a clearer configuration and a more credible basis for investment than unsupported savings or yield claims.
Prev:How Agriculture Sensors Work: Measurement Principles and Field Limits
Next:Analog vs. Ultrasonic Anemometers: Technical Differences Explained
Related recommendations
Sensors & Weather Stations Catalog
 Agriculture Sensors and Weather Stations Catalog-NiuBoL.pdf
Weather Stations Catalog-NiuBoL.pdf
Agriculture Sensors Catalog-NiuBoL.pdf
Water Quality Sensor Catalog-NiuBoL.pdf
Related products
 Combined air temperature and relative humidity sensor
 TDR Soil Moisture & Temperature Sensor for irrigation| RS485 |4-20mA| NBL-S-THR
 Soil pH sensor RS485 soil Testing instrument soil ph meter for agriculture |NBL-S-PH
 Wind Speed sensor Output Modbus/RS485/Analog/0-5V/4-20mA
 Tipping bucket rain gauge for weather monitoring auto rainfall sensor RS485/Outdoor/stainless steel
 Pyranometer Solar Radiation Sensor 4-20mA/RS485


Screenshot, WhatsApp to identify the QR code
WhatsApp number:+8615367865107
(Click on WhatsApp to copy and add friends)

