





— Blogs —
—Products—
 Consumer hotline +8618073152920
WhatsApp:+8615367865107
Address:Room 102, District D, Houhu Industrial Park, Yuelu District, Changsha City, Hunan Province, China
Product knowledge
Time:2026-08-21 09:09:00 Popularity:253
Quick Answer: To evaluate IoT tools for pest monitoring, test the complete record from a locally relevant insect image to the exported count. Separate attraction, image quality, identification and reporting. A working camera or a high overall recognition percentage does not establish reliable counts for the pest that matters to the crop. Keep a manually checked image set and test what happens to missing, uncertain and repeated records.
A useful evaluation begins with the crop protection team's target list. Specify the species or identification level needed, the seasonal period and the decision supported by the report. A genus-level count may support a preliminary scouting visit but may be insufficient where treatment depends on distinguishing similar species. Agree who reviews uncertain identifications before the equipment trial starts.
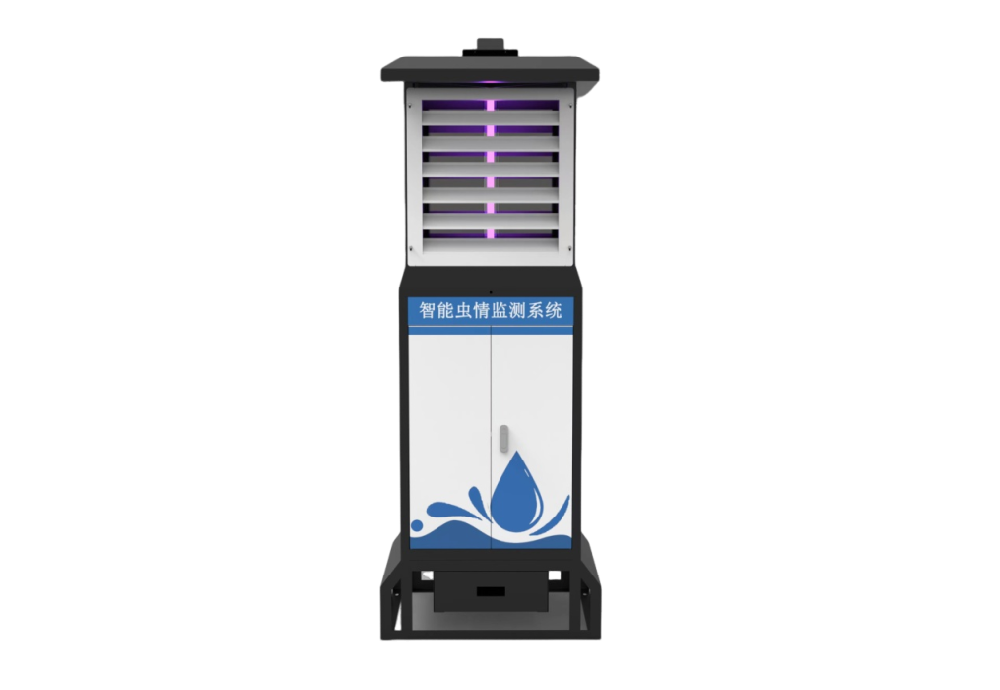
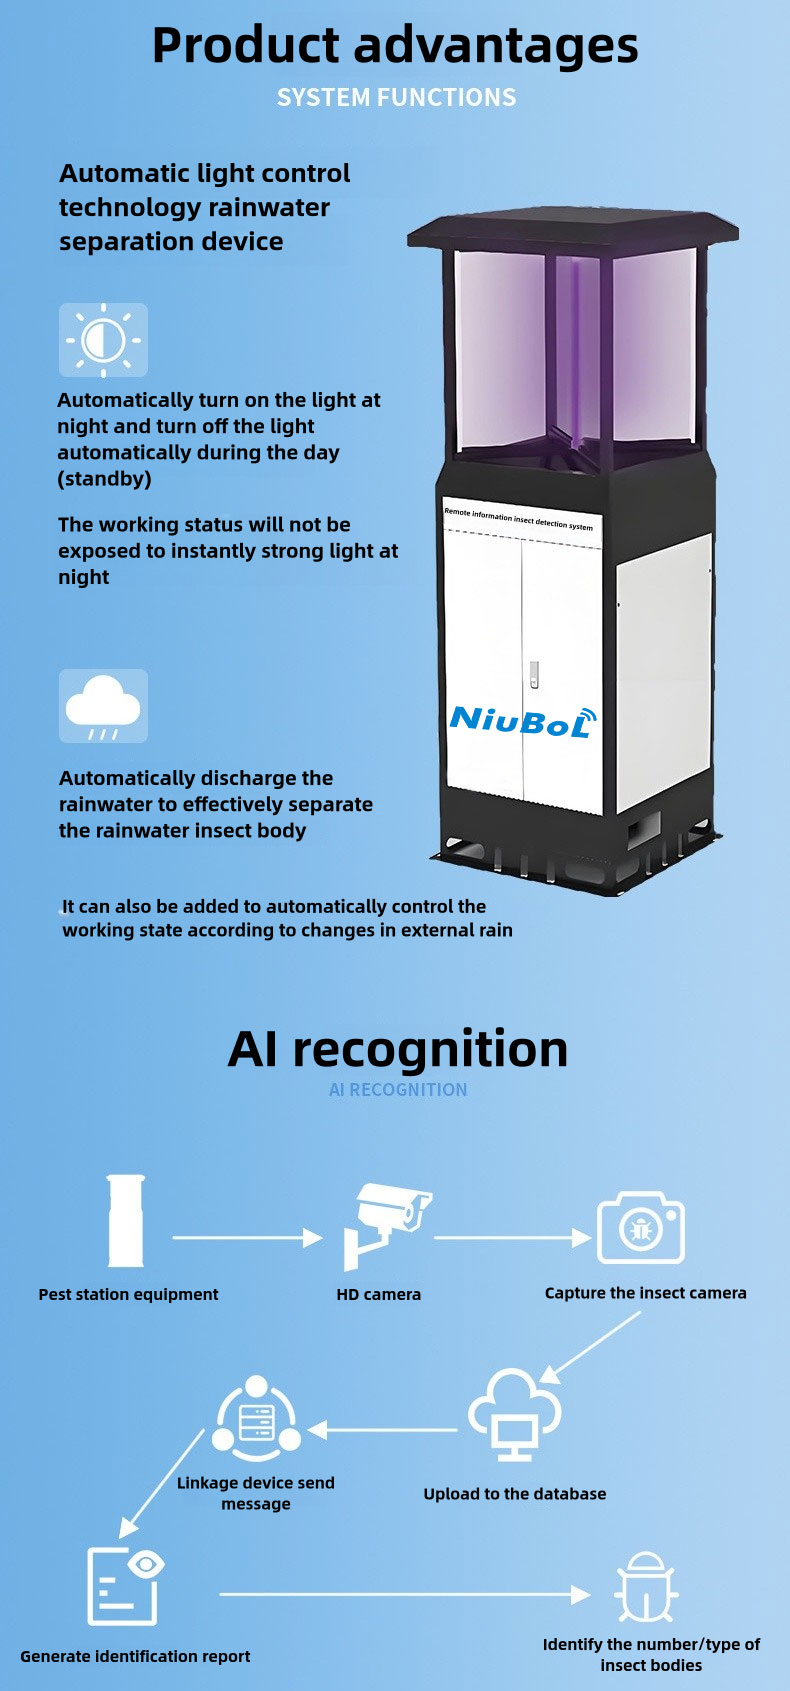
The NiuBoL remote insect monitoring system uses a light-attraction and insect-processing arrangement with image acquisition. It provides observations from insects that reach that sampling system. A count is not a census of every insect in the field, and a successful image-identification test does not establish how effectively the light attracts each target species.
Ask the agronomist to identify important targets that may be poorly represented by light trapping. They may require separate scouting or a different sampling method. Do not extend this evaluation to rodents, diseases or underground pest populations simply because the same management platform can display several types of farm data.
Use images collected through the intended device and processing path, including normal variation in specimen size, orientation, background and crowding. A demonstration containing only isolated, intact insects on a clean background misses conditions that can dominate field review. Include non-target insects and images where the correct result is uncertain or unusable.
Have a suitably qualified reviewer annotate the test set independently of the automatic labels. Record the image identifier, target class, number of visible specimens, uncertain objects and reason for exclusion. Keep uncertain annotations separate rather than forcing a convenient answer. Where reviewers disagree, resolve the label or retain the disagreement explicitly.
Separate images used for configuration or algorithm adjustment from those used for the final check. If the supplier tunes a classifier using the same images that determine acceptance, the resulting score does not show performance on unseen material. Retain the software version, species list and settings with the evaluation so a later update can be compared fairly.
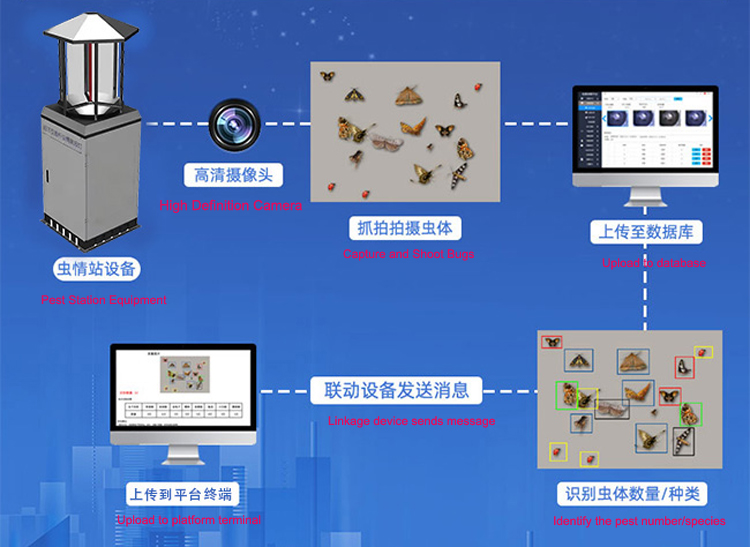
Precision asks how many objects labelled as the target are actually that target. Recall asks how many annotated target objects in the evaluated images were found correctly. Both are needed. A system can avoid false alarms by labelling very few objects, yet miss much of the target population visible in the images.
For an illustrative test, suppose reviewers annotate 100 target insects. The software produces 80 target labels, of which 70 are correct and 10 are non-target insects. Precision is 70/80 = 87.5%; recall is 70/100 = 70%. These are example calculations, not NiuBoL performance claims. They describe identification within that image set, not insects that never entered the trap.
Review results per target class and relevant condition. A combined score dominated by a common, easily identified insect can conceal poor results for a less frequent crop pest. Specify a minimum number of reviewed examples for each important class; if too few occur during the pilot, mark that class as insufficiently tested instead of claiming it passed.
| Evaluation item | What to record | What it does not establish |
|---|---|---|
| Target precision | Correct target labels / all target labels | How many targets were missed |
| Target recall | Correctly found targets / annotated targets in the images | Attraction efficiency across the field |
| Count agreement | Automatic and reviewed counts for the same image and interval | An equivalent population density per hectare |
| Usable image coverage | Expected images, received images and images suitable for review | Correct identification in every usable image |
| Reporting delay | Capture time, receipt time and report availability | That a late image was a fresh observation |
Inspect attraction, specimen transfer, processing, distribution on the collection surface, photography and clearing as separate operations. A sharp empty image may indicate low activity, but it can also follow a transfer fault. A crowded image can make counting difficult even when the camera and connection are functioning.
Test whether the collection surface is cleared before the next count. If a specimen remains and appears again, determine how the reporting logic prevents double counting or flags the uncertainty. Repeated photographs are not automatically independent catches. Likewise, a newly generated report must not count the same uploaded image twice after a retry.
Use operating states to explain interruptions. During rain-control operation, the device may stop normal insect monitoring while handling drainage. That interval is not equivalent to a valid zero catch. Verify the return to the intended automatic mode after an authorised service operation; a device left in manual debugging mode can appear connected while normal sampling is inactive.
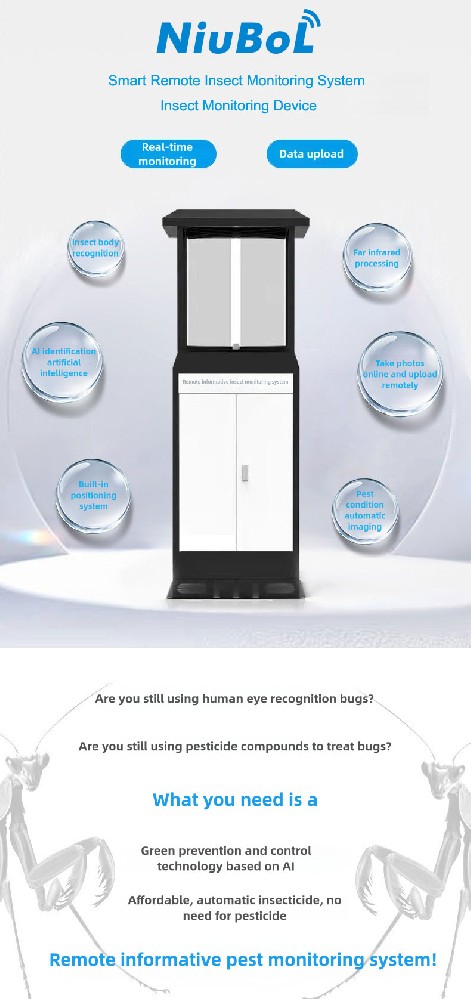
The following operating details apply to the described 2024 system configuration. Confirm them for the supplied version and software before setting the pilot schedule. Do not treat a faster dashboard refresh as a faster specimen-processing or image-acquisition cycle.
| System detail | Configuration detail | Evaluation consequence |
|---|---|---|
| Attraction light | 365-395 nm | Validate suitability for the intended target insects |
| Scheduled operation | Up to four working periods | Export the actual active periods, not just a daily total |
| Photo interval | Minimum 20 minutes in the described configuration | Allow for processing and avoid requesting an unsupported image frequency |
| Status upload | Every 5 minutes in the described configuration | Distinguish status messages from new photographs |
| Remote connection | 4G / Ethernet | Test image and event access through the intended network |
| Expansion interface | Reserved RS485 / RS232 | Obtain the implemented point map and supported protocol |
RS485 Modbus RTU is appropriate for compatible scalar data and equipment states where implemented. It does not by itself define a bulk image interface. A PLC status tag and a full-resolution image download can follow different paths. Request a sample register map, image access method and export format for the exact integration rather than assuming that one serial connection exposes everything.
For a third-party farm platform, test one complete record: device identity, field location, capture interval, image reference, automatic result, reviewer correction and service state. Check which fields are actually available and which require platform development. Include any storage, network or interface charges in the quotation comparison without inventing a fixed subscription price.
Temporarily interrupt the network using an approved procedure and observe the result at both ends. Establish whether images are retained locally, retried, overwritten or lost; do not assume store-and-forward support. A missing record should remain visibly missing until its status is resolved. Upload time must not replace capture time when a delayed image arrives.
Check how a reviewer corrects a species or count. The original automatic result, corrected value and review time should remain distinguishable if the project needs traceable analysis. Export the report and compare it with several source images. A useful on-screen chart is not sufficient if the downloaded file loses target names, intervals or correction history.
Finally, review practical operation: safe access to the drawer, cleaning of the light and collection path, rain-sensor condition and restoration after service. The trial should include a normal service visit by the team that will maintain the site. This often reveals access and responsibility gaps that a remote demonstration cannot show.
No. Ask for target-specific results on locally relevant, independently reviewed images, with false positives, missed targets and unusable images reported separately. An aggregate score can conceal failure on a commercially important species.
It can reveal site and service constraints, but a classifier test alone cannot establish spatial coverage. Point quantity also depends on crop blocks, target biology, terrain and the sampling strategy agreed with the crop protection team.
Not when rain control prevented normal sampling. Report the inactive interval or operating coverage alongside the count. Otherwise a drainage event can be mistaken for reduced pest activity.
Do not assume it can. Confirm the serial point map for scalar values and use the implemented image transfer method for photographs. Verify both paths with your PLC, gateway and receiving platform before accepting integration.
List the target classes, site, power arrangement, network, image retention, review workflow and required exports. Ask which platform access and integration work are included, who reviews disputed labels, and how a failed target-specific test will be addressed.
A count can prompt a field investigation. Treatment decisions still require crop stage, scouting, target identification and the applicable local protection programme. Do not accept a generic count threshold as a validated treatment rule for every crop.

A defensible pest-monitoring trial connects a target insect, an independently reviewed image and a traceable report. Check the physical sampling cycle as carefully as the identification score. For a NiuBoL evaluation, provide the crop, target list, example specimens or images, proposed sites and receiving platform so the trial can test the decisions your team actually needs to make.
Prev:Instrument to Measure Dissolved Oxygen in Water: Test Response Lag
Next:Weather Alarm Station for Wind-Sensitive Sites: Design and Tests
Related recommendations
Sensors & Weather Stations Catalog
 Agriculture Sensors and Weather Stations Catalog-NiuBoL.pdf
Weather Stations Catalog-NiuBoL.pdf
Agriculture Sensors Catalog-NiuBoL.pdf
Water Quality Sensor Catalog-NiuBoL.pdf
Related products
 Combined air temperature and relative humidity sensor
 TDR Soil Moisture & Temperature Sensor for irrigation| RS485 |4-20mA| NBL-S-THR
 Soil pH sensor RS485 soil Testing instrument soil ph meter for agriculture |NBL-S-PH
 Wind Speed sensor Output Modbus/RS485/Analog/0-5V/4-20mA
 Tipping bucket rain gauge for weather monitoring auto rainfall sensor RS485/Outdoor/stainless steel
 Pyranometer Solar Radiation Sensor 4-20mA/RS485


Screenshot, WhatsApp to identify the QR code
WhatsApp number:+8615367865107
(Click on WhatsApp to copy and add friends)

