





— Blogs —
—Products—
 Consumer hotline +8618073152920
WhatsApp:+8615367865107
Address:Room 102, District D, Houhu Industrial Park, Yuelu District, Changsha City, Hunan Province, China
Product knowledge
Time:2025-09-24 15:47:49 Popularity:1325
Sensor precision vs. resolution is a distinction between consistency and discernible change. Precision describes agreement between repeated measurements under stated conditions; resolution concerns the smallest input change that produces a perceptible indication. Neither establishes accuracy by itself. For a monitoring project, compare the sensor's specified error limit at the operating point, repeatability, installation effects and the complete acquisition chain before paying for more displayed digits.
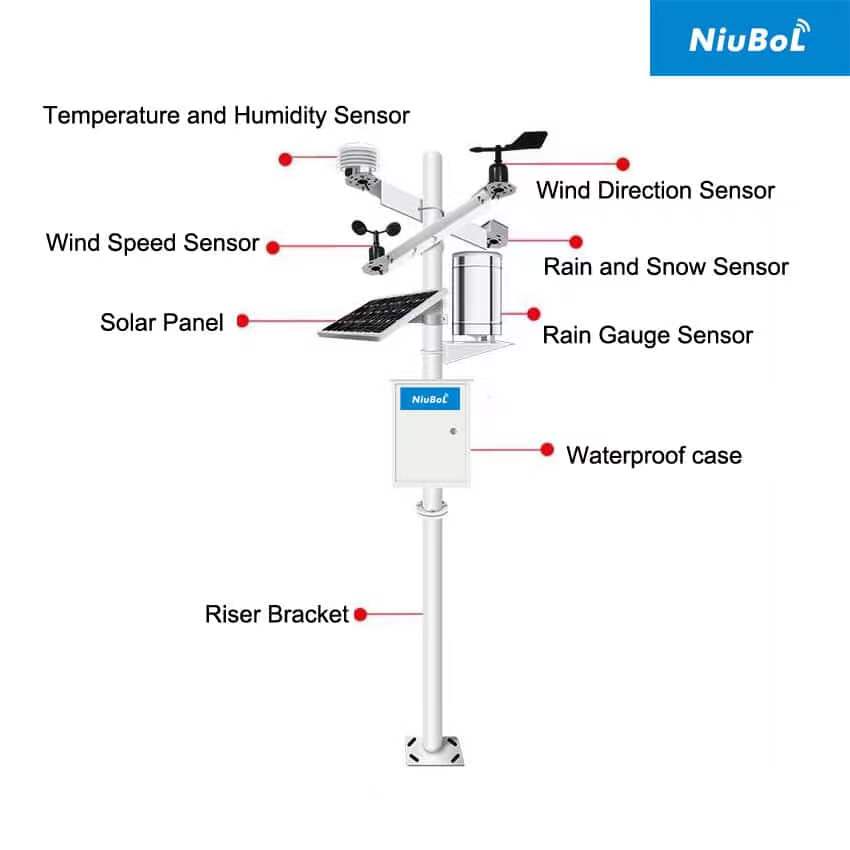
A temperature channel displaying 25.01 C is not necessarily more accurate than one displaying 25.0 C. The extra digit may describe formatting rather than useful measurement information. Equally, a stable reading can be consistently offset from a suitable reference. These distinctions matter when setting greenhouse control thresholds, comparing weather stations or accepting a batch of instruments.
| Term | What to examine | What it does not establish |
|---|---|---|
| Resolution | Smallest discernible change under the relevant operating conditions; distinguish this from the display increment | Closeness to a reference value |
| Precision / repeatability | Spread of repeated results with the same procedure, equipment and controlled conditions | Absence of systematic offset |
| Specified accuracy or error limit | Manufacturer's numerical tolerance, including range, temperature and other conditions | Total uncertainty of the installed monitoring system |
| Measurement uncertainty | Evaluation of contributions affecting the reported result, including the reference and measurement procedure | A correction that automatically removes error |
The JCGM vocabulary for measurement precision separates precision from accuracy. Its resolution definition also recognizes that noise can affect what change is discernible. In product comparisons, ask what the supplier means by each numerical specification instead of assuming that every use of the word precision describes a repeatability test.
The NiuBoL NBL-W-CO2 illustrates why a resolution figure cannot replace an error calculation. Both listed range versions have 1 ppm resolution, but their accuracy expressions differ. F.S. means full scale; a percentage of reading changes with the indicated concentration. The following arithmetic uses the published expressions, not field test results.
| CO2 version | Specified accuracy expression | Worked interpretation |
|---|---|---|
| 0-2000 ppm | +/- (40 ppm + 2% F.S.) | 40 + 0.02 x 2000 = 80 ppm; the expression gives +/-80 ppm across this range |
| 0-5000 ppm | +/- (50 ppm + 3% of reading) | At 1000 ppm: +/-80 ppm. At 4000 ppm: +/-170 ppm |
| Both versions | 1 ppm resolution | A 1 ppm output step does not imply a +/-1 ppm measurement tolerance |
Choose a range that covers credible operating concentrations, then assess the tolerance where the process normally operates. A narrower range that saturates during enrichment is unsuitable even if its error expression looks attractive. A wider range does not automatically provide a smaller error. Confirm the selected output and range on the quotation and instrument configuration so the PLC uses the same scaling.
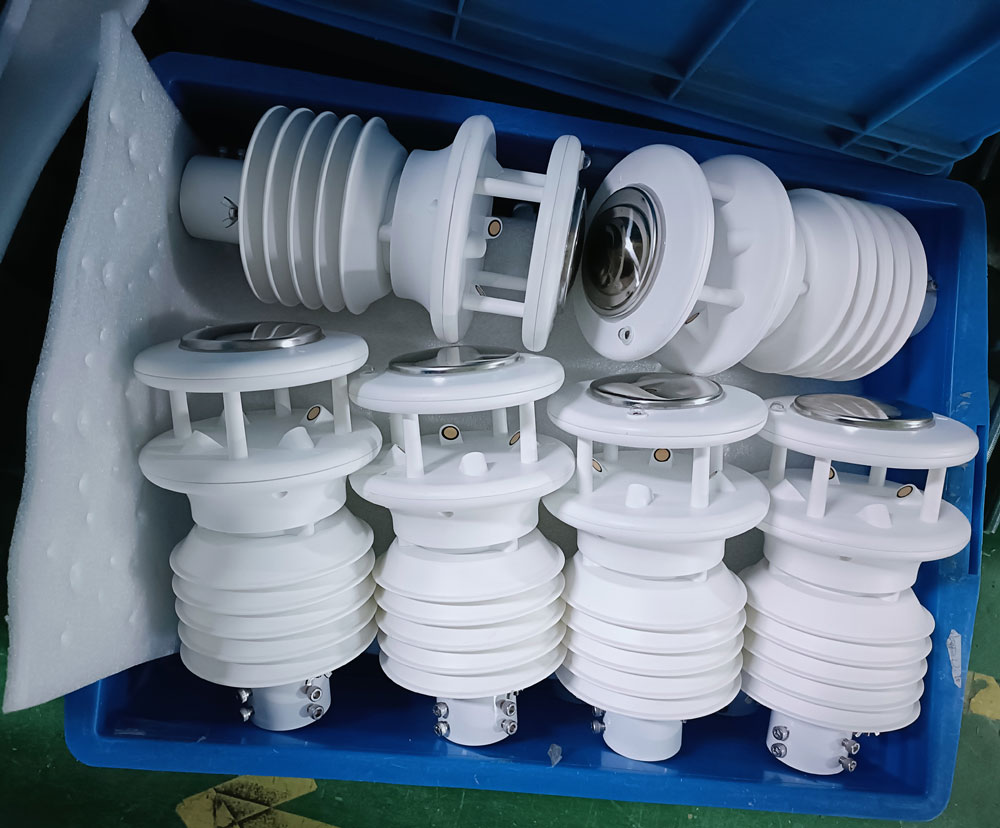
For the NBL-W-LBTH air temperature, humidity and pressure sensor, the listed temperature resolution is 0.1 C and temperature accuracy is +/-0.5 C. Those are different properties. A change from 25.0 to 25.1 C can be reported without establishing that the absolute temperature is within 0.1 C of a reference.
Consider an illustrative check: three stabilized readings are 25.0, 25.1 and 25.2 C while a colocated reference indicates 26.0 C. The instrument shows a small short-term spread, but the comparison also raises an offset question. Three readings alone are not a complete repeatability assessment. Check reference uncertainty, stabilization, airflow and whether both instruments actually sample comparable air before applying an adjustment.
Outdoor radiation exposure is particularly important. An inadequately shielded probe near a hot wall may produce repeatable readings of an unrepresentative local environment. More decimal places cannot correct that siting error. Establish the intended measurement location and keep comparison sensors clear of exhausts and reflected heat; do not treat a sensor on a shaded wall as an unquestioned reference for an exposed mast.
For analog instruments, sensor precision vs. resolution must be examined beyond the probe. The transmitter range, receiver input range, converter, reference stability and electrical noise all contribute. The NBL-PH-1 data logger documents 12-bit A/D conversion in its controller configuration. That bit depth is not an overall accuracy specification.
As a simplified calculation, an ideal 12-bit converter has 4096 codes. If a 0-100 C signal used the whole converter span, one code would correspond to about 100/4096 = 0.0244 C. This is a quantization example, not the NBL-PH-1 channel accuracy or guaranteed effective resolution. Actual input scaling, noise and converter performance must be checked for the selected hardware.
RS485 Modbus RTU avoids repeating an analog conversion at the receiving logger, but it does not improve the sensor's physical measurement. Check register type, signed values, scale factor and units. A register value of 253 with a 0.1 C scale should become 25.3 C, not 253 C or 25.30 C presented as a newly more accurate result. Retain appropriate numerical detail during calculation, then format the display consistently with its purpose.
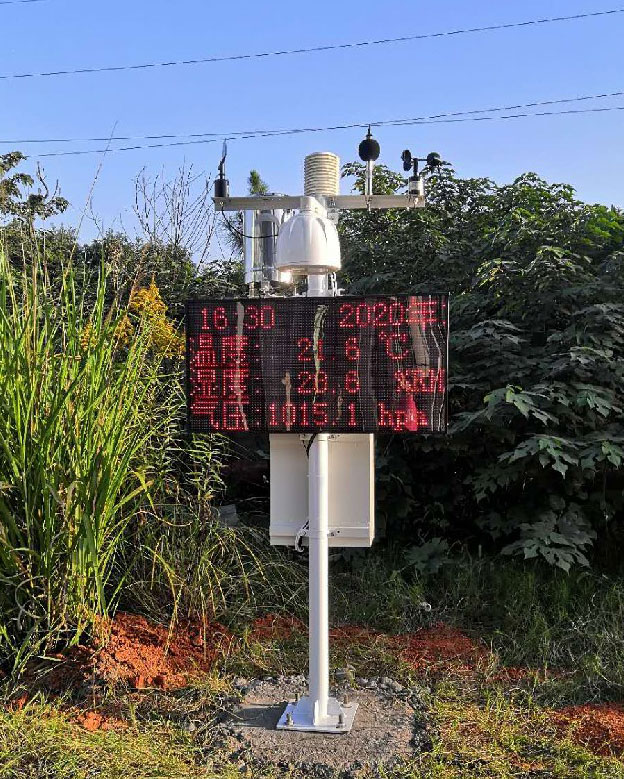
Start with the decision the measurement supports. Detecting a small trend and verifying an absolute limit are not identical tasks. If a controller switches within a narrow temperature band, evaluate uncertainty and short-term variability relative to that band. If an observation network compares seasonal averages, investigate siting consistency and drift as well as instantaneous display detail.
Calibration establishes a relationship between indications and reference values with associated uncertainty. Adjustment may change the instrument response; the two activities should not be confused. Neither automatically increases intrinsic resolution. Keep as-found results before adjustment so maintenance staff can judge whether earlier data may require qualification.
For a quotation, provide the measurement range, operating temperature, required error limit, output, receiving equipment and intended comparison procedure. Ask whether calibration documentation is included and what it covers. A lower-cost sensor that satisfies the actual tolerance can be appropriate; a finer display is not sufficient justification for a higher price.
No. Resolution concerns discernible change, while the numerical error limit describes another property under specified conditions. Confirm both values and the conditions attached to them. Displaying two decimal places is not evidence of a two-decimal measurement tolerance.
Yes. Repeated results may cluster closely while remaining offset from a suitable reference. Evaluate the spread and reference difference separately, accounting for reference uncertainty and whether the test conditions are comparable.
No. The range must include expected excursions without saturation. Calculate the specified error at important operating points and confirm overload behavior before comparing configurations. Do not extend a published tolerance outside its stated range.
Not inherently. Digital transmission can preserve the sensor's reported value without an extra transmitter-to-receiver analog conversion, but sensing error, exposure and drift remain. Incorrect register scaling can still make a digital result unusable.
Record model, range, output configuration, serial identification, reference details, test conditions, stabilized readings and the agreed pass criteria. Store as-found results separately from any adjustment. This makes later comparisons meaningful rather than simply recording that calibration was performed.
Use sensor precision vs. resolution to ask better specification questions, not to rank instruments by decimal places. Calculate range-dependent tolerance, examine repeatability under controlled conditions and verify the installed signal chain. NiuBoL can review the required range and interface when the application, receiver and measurement tolerance are specified.
Prev:Troubleshooting Common Issues with Anemometers
Next:How to Choose the Best Location for Installing Weather Sensors
Related recommendations
Sensors & Weather Stations Catalog
 Agriculture Sensors and Weather Stations Catalog-NiuBoL.pdf
Weather Stations Catalog-NiuBoL.pdf
Agriculture Sensors Catalog-NiuBoL.pdf
Water Quality Sensor Catalog-NiuBoL.pdf
Related products
 Combined air temperature and relative humidity sensor
 TDR Soil Moisture & Temperature Sensor for irrigation| RS485 |4-20mA| NBL-S-THR
 Soil pH sensor RS485 soil Testing instrument soil ph meter for agriculture |NBL-S-PH
 Wind Speed sensor Output Modbus/RS485/Analog/0-5V/4-20mA
 Tipping bucket rain gauge for weather monitoring auto rainfall sensor RS485/Outdoor/stainless steel
 Pyranometer Solar Radiation Sensor 4-20mA/RS485


Screenshot, WhatsApp to identify the QR code
WhatsApp number:+8615367865107
(Click on WhatsApp to copy and add friends)

