





— Blogs —
—Products—
 Consumer hotline +8618073152920
WhatsApp:+8615367865107
Address:Room 102, District D, Houhu Industrial Park, Yuelu District, Changsha City, Hunan Province, China
Product knowledge
Time:2023-10-17 15:19:26 Popularity:1757
Quick Answer: Weather station irrigation scheduling uses measured atmospheric conditions to estimate water demand, then combines that estimate with rainfall, soil storage and irrigation records. Reference evapotranspiration is not a valve runtime. Convert the selected net irrigation depth to a zone volume, account for application efficiency and verify actual delivery before using the result to operate pumps or valves.

A farm may receive daily rainfall, air temperature, humidity, wind and radiation readings while still lacking a usable irrigation instruction. The missing step is the water balance: how much water the crop has used, how much usable water entered the root zone and how much storage can be depleted before the next application.
Keep three quantities separate on the operating report. Reference evapotranspiration, ETo, describes demand for a defined reference surface. Crop evapotranspiration, ETc, applies an appropriate crop model. Irrigation depth is a management decision that also considers existing soil water and the application system. Labeling every one of these values "water requirement" makes it difficult to check the calculation.
For open field irrigation, one weather station may support several management zones that share representative atmospheric conditions. The zones can still need different crop coefficients, rooting depths and schedules. A weather sensor observes its exposure; it does not determine that every field around it has the same soil storage or irrigation capacity.
The FAO Penman-Monteith reference method uses defined temperature, humidity, radiation and wind information together with location data. Choose the calculation before ordering the channels. A station that measures only rain, temperature and humidity does not directly provide the full measured input set for that method.
Check sensor exposure and data preparation. Use shielded air measurements rather than a temperature probe heated by a cabinet or roof. Record wind height and the surrounding surface. Keep radiation in the energy units required by the calculation; illuminance in lux is not an interchangeable pyranometer measurement. Wind direction can help describe site exposure but does not replace wind speed.
The FAO procedure uses wind speed at 2 m and provides a height adjustment for suitable reference conditions. Its approximate factor at 10 m is 0.748. An illustrative 2.8 m/s observation at that height therefore becomes about 2.09 m/s for the reference calculation. This adjustment is not a correction for a sensor sheltered by buildings or embedded in a tall crop canopy. The FAO weather-input guidance explains the exposure and unit requirements.
For radiation, integrate a valid time series rather than multiplying a noon reading by a whole day. A constant illustrative 500 W/m2 for one hour represents 1.8 MJ/m2: 500 times 3600 divided by one million. Missing daylight intervals can bias the daily total. Retain data coverage and identify substituted inputs instead of silently accepting an incomplete day as a normal daily demand estimate.
For a simplified, non-stressed single-coefficient calculation, ETc = Kc times ETo. If illustrative ETo is 5.0 mm/day and the selected Kc is 0.80, the calculated crop demand is 4.0 mm/day. The coefficient must suit the crop, development stage and method; 0.80 is not a recommendation for every pepper field or every irrigation system.
Effective rainfall is the part of a rain event that contributes to the water balance being managed. Gauge rainfall can be reduced by interception, runoff and drainage beyond the relevant storage. A 12 mm gauge event is not automatically 12 mm of root-zone recharge. Compare the field response, especially on sloping ground, crusted soil or a partially wetted drip block.
| Simplified daily account | Illustrative value | How it enters the decision |
|---|---|---|
| Previous root-zone depletion | 18 mm | Starting storage deficit, established for the zone |
| Crop evapotranspiration | 4 mm | Adds to depletion |
| Effective rainfall | 5 mm | Reduces depletion |
| Net irrigation received that day | 0 mm | No irrigation contribution |
| Updated depletion | 18 + 4 - 5 = 17 mm | Compare with the zone's allowable depletion and operating plan |
This simplified account assumes other terms, such as capillary rise and deep drainage, are negligible during the example interval. Where they matter, include them. Soil measurements provide a check on the account, not automatic proof of uniform storage across the entire field. A persistent disagreement should trigger a review of rain, irrigation delivery, soil contact and the crop assumptions.
Once a suitable net irrigation depth has been selected, convert it to the amount the zone must receive. One millimeter over one hectare is 10 m3. For an illustrative 2 ha block requiring 12 mm net, the useful root-zone contribution is 240 m3. Applied to the preceding 17 mm depletion example, that leaves 5 mm of depletion rather than refilling to field capacity. The acceptable remaining depletion must be selected for the zone.
If the adopted application efficiency is 0.80, gross applied depth is 12/0.80 = 15 mm, corresponding to 300 m3 over that block. With a measured zone delivery of 30 m3/h, nominal runtime is 10 hours. Check that the efficiency definition and area match the project, including how localized irrigation is represented. Do not divide by a catalog pump capacity if the actual zone receives less flow.
Irrigation runtime calculation must also respect infiltration, distribution and operating windows. Ten hours of continuous delivery may not be suitable where runoff develops or a cycle-and-soak arrangement is required. Breaking the application into cycles changes the operating sequence, not the total amount automatically received. Verify the resulting volume and soil response.
A weather-based demand estimate can reveal a capacity limit. If two zones each require a ten-hour turn but share a supply available for only sixteen hours, the schedule does not fit. Sensor automation cannot remove that hydraulic constraint. Review priorities, storage, application timing and system capacity with the project designer before increasing the deficit or extending runtime without bounds.
Group areas by crop, soil, slope and irrigation method. A sensor next to one emitter should not control an entire unlike field. Use more than one depth where the project needs to confirm infiltration and avoid deep drainage.
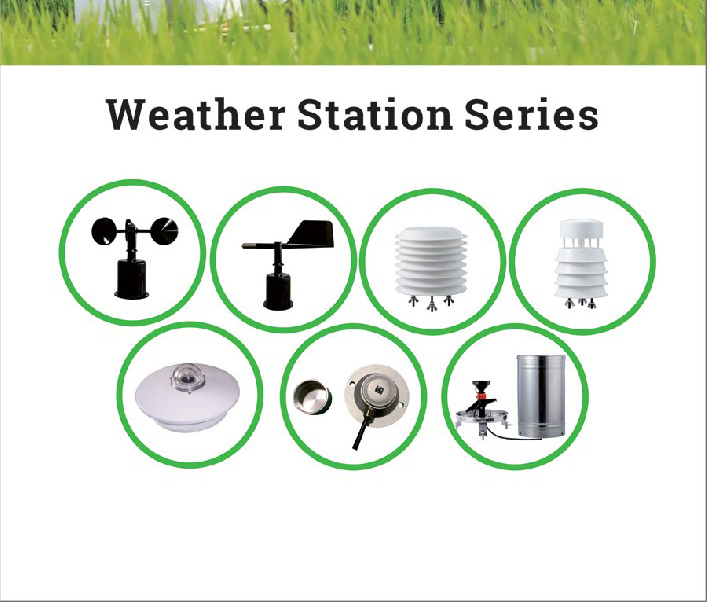
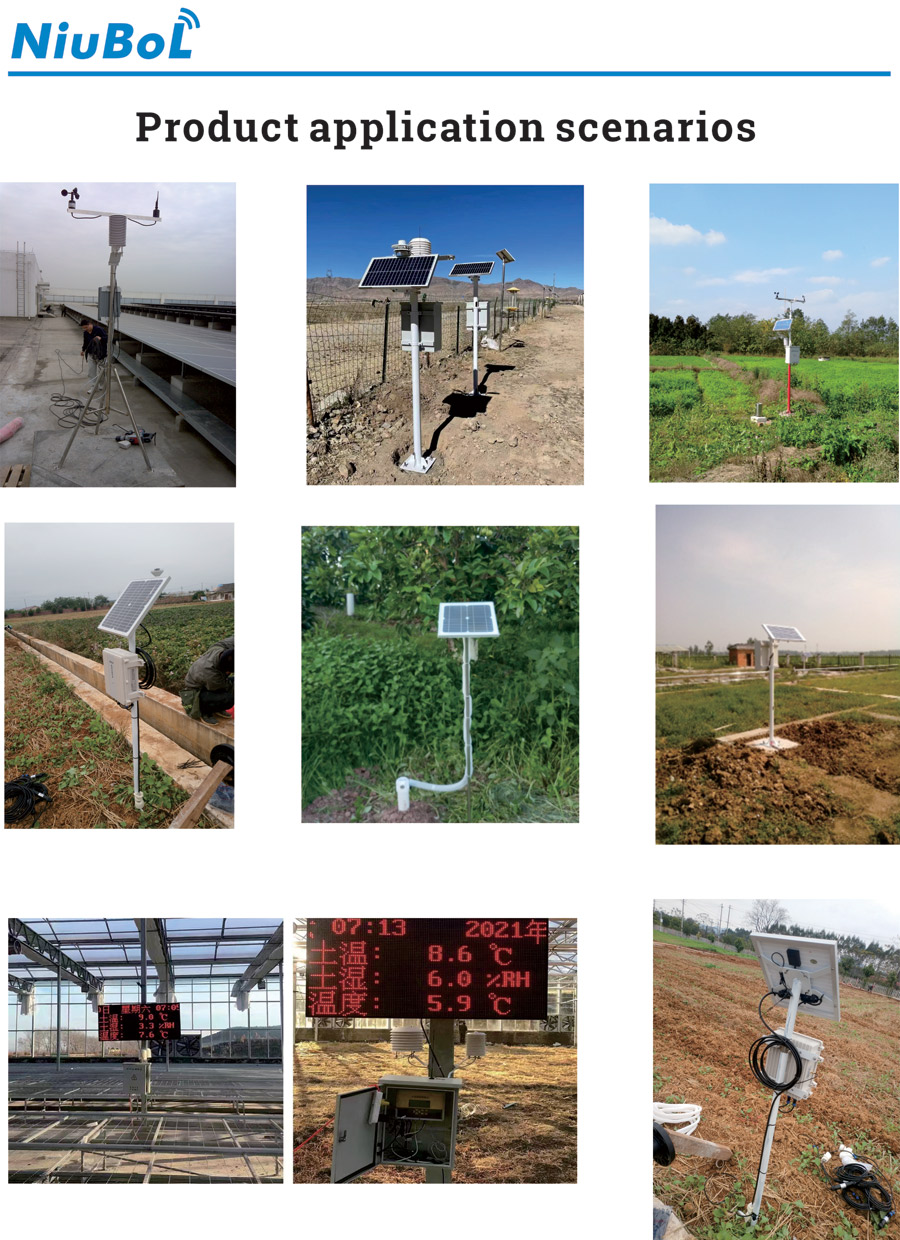
NiuBoL weather stations can combine separate wind, air, rainfall and radiation channels with soil observations and a compatible data logger. Specify the fitted instruments and output versions. The following component examples explain relevant limits; they are not one accuracy specification for an assembled irrigation system.
| Component | Selected specification | Scheduling consequence |
|---|---|---|
| NBL-W-SS wind speed | 0-45 or 0-70 m/s; +/-(0.3 + 0.03V) m/s; 0.1 m/s resolution; IP65 housing | Document height and exposure; select the matching pulse, analog or RS485 version |
| NBL-W-LBTH air channel | Temperature -40 to +80 degrees C, +/-0.5 degrees C; RH 0-100%, +/-5% RH | Air conditions need appropriate shielding and representative exposure |
| NBL-W-RS 0.2 mm rain version | 0-4 mm/min; +/-4% in an indoor static test at 2 mm/min; 0-50 degrees C operation | Confirm leveling, count handling and suitability for liquid rainfall |
| NBL-W-HPRS pyranometer | 0-2000 W/m2; 0.3-3 micrometer spectral range; -40 to +50 degrees C operation | Integrate the radiation record in time; do not substitute illuminance or photon flux |
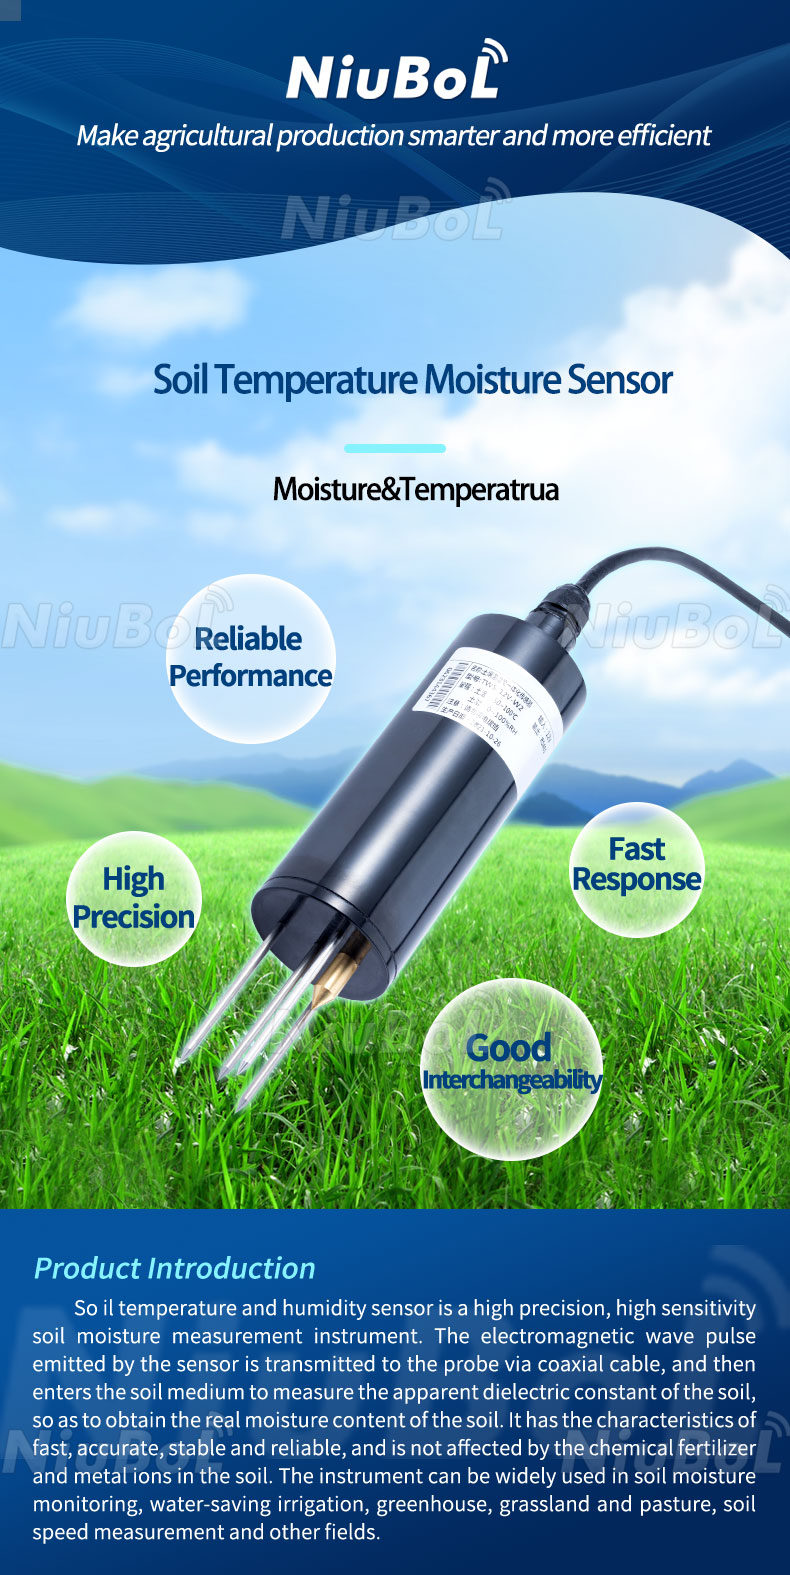
| NBL-S-THR soil channel | 0-100% moisture; 0.1% resolution; +/-3% moisture specification; IP68 probe | Use representative soil contact and agree the error basis for field checks |
| THR electrical configuration | 12-24 VDC; about 0.3 W; RS485, 4-20 mA or 0-5 V version | Match the ordered output to the controller; remote transmission requires separate acquisition and communications equipment |
The soil probe's temperature span is -50 to +100 degrees C, while its operating environment is -40 to +80 degrees C. Do not transfer either limit to the logger. Cable configurations also differ: examples include 2.5 m for SS and HPRS and 5 m for the rain gauge. Specify the soil-probe cable length and jacket for the intended routing instead of inferring them from an ingress rating.
Set minimum and maximum run times, flow or pressure checks and a manual override. When a sensor value is missing or implausible, the controller should enter a defined state rather than continue unlimited irrigation.
The data logger may acquire RS485 Modbus RTU channels, analog measurements and rain pulses, depending on the configuration. The irrigation controller needs the correctly scaled values and approved operating logic. A Modbus connection does not make the probe a valve driver. Check output ownership, interlocks and actual flow feedback at the controller.
Keep acquisition time, calculation interval and irrigation-event time consistent. Rain recorded after midnight should not be subtracted from the previous day's balance merely because an upload arrived late. Distinguish an interval rain total from a cumulative counter, and record resets. If weather inputs are missing, identify any fallback estimate and its limits before allowing automatic operation.
During commissioning, independently verify one day's input units and radiation integration, review the ETo calculation and confirm the zone's crop assumptions. Follow the selected net irrigation depth through gross volume, commanded runtime and measured delivery. Then compare the expected wetting with observations at the relevant soil positions and depths.
Inspect rain-gauge funnels, soil-probe cables, valve operation and logger power. Review thresholds after planting changes or when roots move deeper. A threshold copied from another soil type can produce frequent short cycles or delayed irrigation even when the electronics work correctly.
Record irrigation start, duration and measured flow alongside sensor data. This helps distinguish a dry reading caused by low application from one caused by poor probe contact.
When requesting a NiuBoL configuration, provide the weather calculation, zone areas, crops and growth stages, required soil points, measured delivery rates and existing controller interface. State whether the project needs monitoring only or automatic control. This defines a more useful scope than asking for a weather station that "automatically saves water" without specifying the operating method.
No. ETo is a reference demand estimate. Crop assumptions, existing depletion, effective rain, irrigation contribution and application efficiency are needed before determining gross depth and runtime.
Not automatically. Use effective rainfall appropriate to the root-zone balance, with checks for runoff, interception, drainage and field variation. Outdoor rain does not enter a covered greenhouse in the same way.
It represents 240 m3 of useful water contribution. At an assumed 80% application efficiency, gross delivery is 300 m3; a measured 30 m3/h zone flow implies ten hours nominal runtime.
No. Illuminance and solar radiant energy have different spectral weighting and units. Use the specified radiation measurement or an explicitly supported estimation method.
No. It supplies a measurement to compatible acquisition equipment. A controller with appropriate outputs, safeguards and validated rules operates the valve.
Review data coverage, crop assumptions, effective rainfall, delivered volume, soil depth and contact. Investigate the discrepancy before changing coefficients simply to make the records agree.
Weather station irrigation scheduling connects atmospheric measurements to a checked water balance and a deliverable zone volume. Use NiuBoL weather and soil measurements for their separate roles, verify the calculation chain, and confirm the field received the intended application before relying on an automated schedule.
Agriculture Sensors and Weather Stations Catalog

Related recommendations
Sensors & Weather Stations Catalog
 Agriculture Sensors and Weather Stations Catalog-NiuBoL.pdf
Weather Stations Catalog-NiuBoL.pdf
Agriculture Sensors Catalog-NiuBoL.pdf
Water Quality Sensor Catalog-NiuBoL.pdf
Related products
 Combined air temperature and relative humidity sensor
 TDR Soil Moisture & Temperature Sensor for irrigation| RS485 |4-20mA| NBL-S-THR
 Soil pH sensor RS485 soil Testing instrument soil ph meter for agriculture |NBL-S-PH
 Wind Speed sensor Output Modbus/RS485/Analog/0-5V/4-20mA
 Tipping bucket rain gauge for weather monitoring auto rainfall sensor RS485/Outdoor/stainless steel
 Pyranometer Solar Radiation Sensor 4-20mA/RS485


Screenshot, WhatsApp to identify the QR code
WhatsApp number:+8615367865107
(Click on WhatsApp to copy and add friends)

