

— Blogs —
—Products—
 Consumer hotline +8618073152920
WhatsApp:+8615367865107
Address:Room 102, District D, Houhu Industrial Park, Yuelu District, Changsha City, Hunan Province, China
Product knowledge
Time:2026-09-09 12:00:00 Popularity:253
Separate real localized rainfall from blocked funnels, switch faults, pulse scaling, clock errors, communication gaps and aggregation mistakes. Diagnosing abnormal rainfall data at weather and hydrology stations requires the rain gauge, mounting, logger interval and event timeline to be reviewed together. Diagnosing abnormal rainfall data at weather and hydrology stations requires the rain gauge, mounting, logger interval and event timeline to be reviewed together. Diagnosing abnormal rainfall data at weather and hydrology stations requires the rain gauge, mounting, logger interval and event timeline to be reviewed together. Diagnosing abnormal rainfall data at weather and hydrology stations requires the rain gauge, mounting, logger interval and event timeline to be reviewed together. Diagnosing abnormal rainfall data at weather and hydrology stations requires the rain gauge, mounting, logger interval and event timeline to be reviewed together. Diagnosing abnormal rainfall data at weather and hydrology stations requires the rain gauge, mounting, logger interval and event timeline to be reviewed together. Diagnosing abnormal rainfall data at weather and hydrology stations requires the rain gauge, mounting, logger interval and event timeline to be reviewed together. Diagnosing abnormal rainfall data at weather and hydrology stations requires the rain gauge, mounting, logger interval and event timeline to be reviewed together.
| Decision field | Engineering requirement | Evidence for acceptance |
|---|---|---|
| Measurement purpose | State what action abnormal rainfall data should support | Approved monitoring objective |
| Location for abnormal rainfall diagnosis for weather and hydrology stations | Coordinates, depth or height, orientation and exposure | Drawing and installation photos |
| Data path for abnormal rainfall diagnosis for weather and hydrology stations | Sensor to logger, controller, gateway and platform | Real-time value with correct unit and timestamp |
| Maintenance for abnormal rainfall diagnosis for weather and hydrology stations | Safe access and responsible person | Inspection and service record |
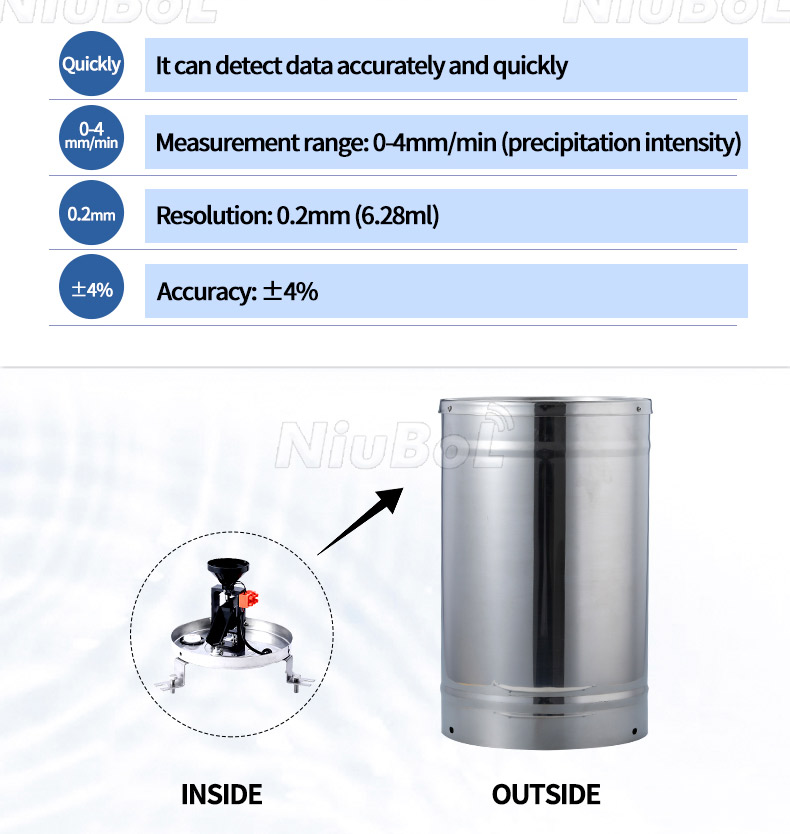
In the system, the rain gauge is the precipitation input of a logger or hydrometeorological station and must be treated as a level, exposed measuring instrument instead of a general outdoor box. During the abnormal rainfall diagnosis for weather and hydrology stations pre-order review, trace the measuring point through cable protection, logger and network to its database field and alarm destination. For abnormal rainfall data, a live number on a display is merely the first check. Across the Abnormal Rainfall Data measurement chain, preserve engineering units, timestamps, Modbus addresses and device status.
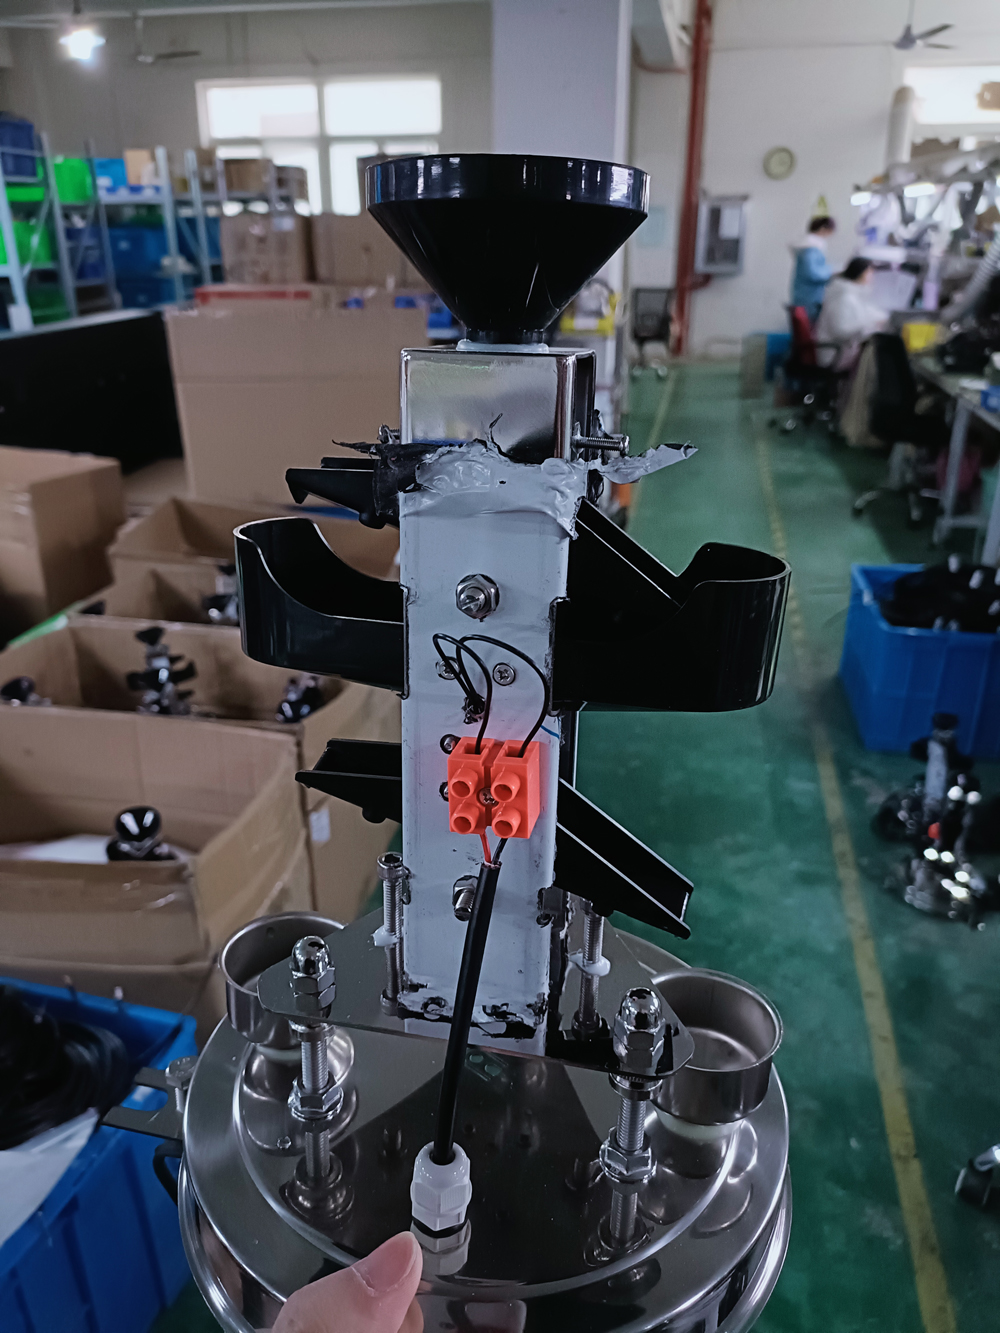
A key limitation is that check leveling, splash, wind, funnel blockage, debris, snow and accumulation interval when rainfall records look unreliable. If the instrument result later changes, the retained files let the owner distinguish a real field event from installation movement, fouling, configuration changes or communication loss.
For sustained operation, describe abnormal rainfall data as a measuring point with an operating purpose.
| RFQ item | Information to provide | Cost or risk controlled |
|---|---|---|
| Application | Purpose and site for abnormal rainfall data | Prevents wrong product family |
| Measurement for abnormal rainfall diagnosis for weather and hydrology stations | Normal, alarm and peak range; required interval | Avoids under-range or needless overspecification |
| Integration for abnormal rainfall diagnosis for weather and hydrology stations | PLC/RTU/logger model, signal and protocol | Reduces panel rework |
| Mechanical for abnormal rainfall diagnosis for weather and hydrology stations | Mounting, depth or height, cable route and material exposure | Defines accessories and serviceability |
| Supply scope for abnormal rainfall diagnosis for weather and hydrology stations | Sensor only or complete station; documents and spares | Makes prices comparable |
| Commercial for abnormal rainfall diagnosis for weather and hydrology stations | Quantity, destination, delivery target and packing | Supports a realistic quotation |
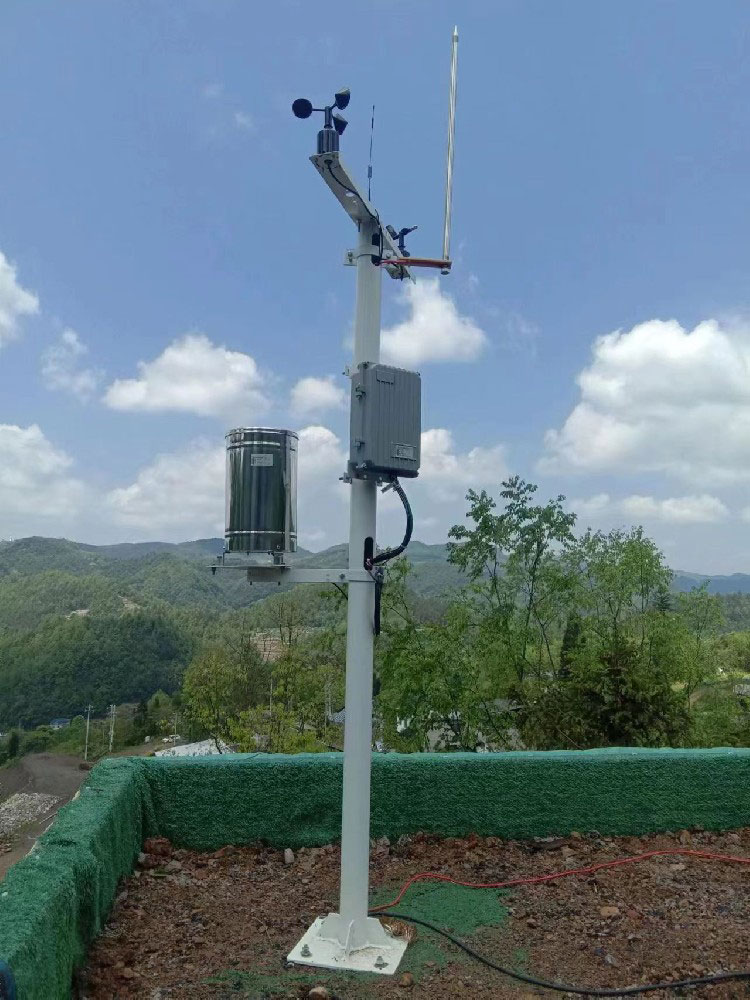
Select abnormal rainfall data only when its measurement function, operating limits and interface match the documented project requirements. For abnormal rainfall diagnosis for weather and hydrology stations, check leveling, splash, wind, funnel blockage, debris, snow and accumulation interval when rainfall records look unreliable.
Do not postpone the interface choice for Abnormal Rainfall Data until after the control cabinet has been built. The abnormal rainfall data model, power demand and output must be frozen early enough for the integrator to allocate terminals, protection, addresses and data fields. If the host system has only analog inputs, obtain the exact 4-20 mA scaling on a suitable model. For an RS485 Modbus RTU version of Abnormal Rainfall Data, obtain the register map before controller programming begins. A protocol name by itself does not prove plug-and-play compatibility.
Before shipment, bench-test the selected abnormal rainfall data with the intended power supply and host interface where practical. At the measuring location, verify mounting, cable protection, grounding or bonding, address assignment, logger clock, upload interval and alarm destination.
For abnormal rainfall data, do not close acceptance with a screenshot alone. Handover records for Abnormal Rainfall Data should identify the serial number, installed position, cable and terminal, communication settings, initial comparison, platform tag and routine-inspection owner; include firmware or configuration references where available. Capturing this evidence while commissioning Abnormal Rainfall Data is far easier than reconstructing it during a fault investigation.
For abnormal rainfall diagnosis for weather and hydrology stations, the project file should connect the measurement objective, field location, interface, maintenance access and acceptance method.
A1: Possible causes include blocked funnels, stuck tipping mechanisms, failed pulse or RS485 wiring, wrong addresses, power loss or rainfall that did not reach the gauge location.
A2: Check obstruction, wind exposure, gauge level, splash loss, funnel contamination, resolution and the distance between sites. Local rainfall can also differ significantly.
A3: fter inspecting and leveling the mechanism, apply a known water volume slowly enough to simulate rainfall and compare the expected tip count with the recorded value.
A4: For Abnormal Rainfall Data, no. Preserve the raw record, diagnostic evidence and any corrected series separately. A real localized event can look abnormal when compared with a distant reference.
A5: For Abnormal Rainfall Data, read raw device responses locally, verify power and wiring, and compare tip events with logger records. A valid response with zero rainfall requires different checks from no response.
A6: Wrong register type, scaling, pulse factor, reset logic, timestamp or cumulative-to-increment conversion can create false rainfall totals.
A7: Include weather conditions, gauge condition, level check, manual test result, raw data, configuration, repair action and the period affected.
A8: Use scheduled cleaning, secure mounting, cable protection, surge protection and automatic alerts for communication loss or implausible accumulation patterns.
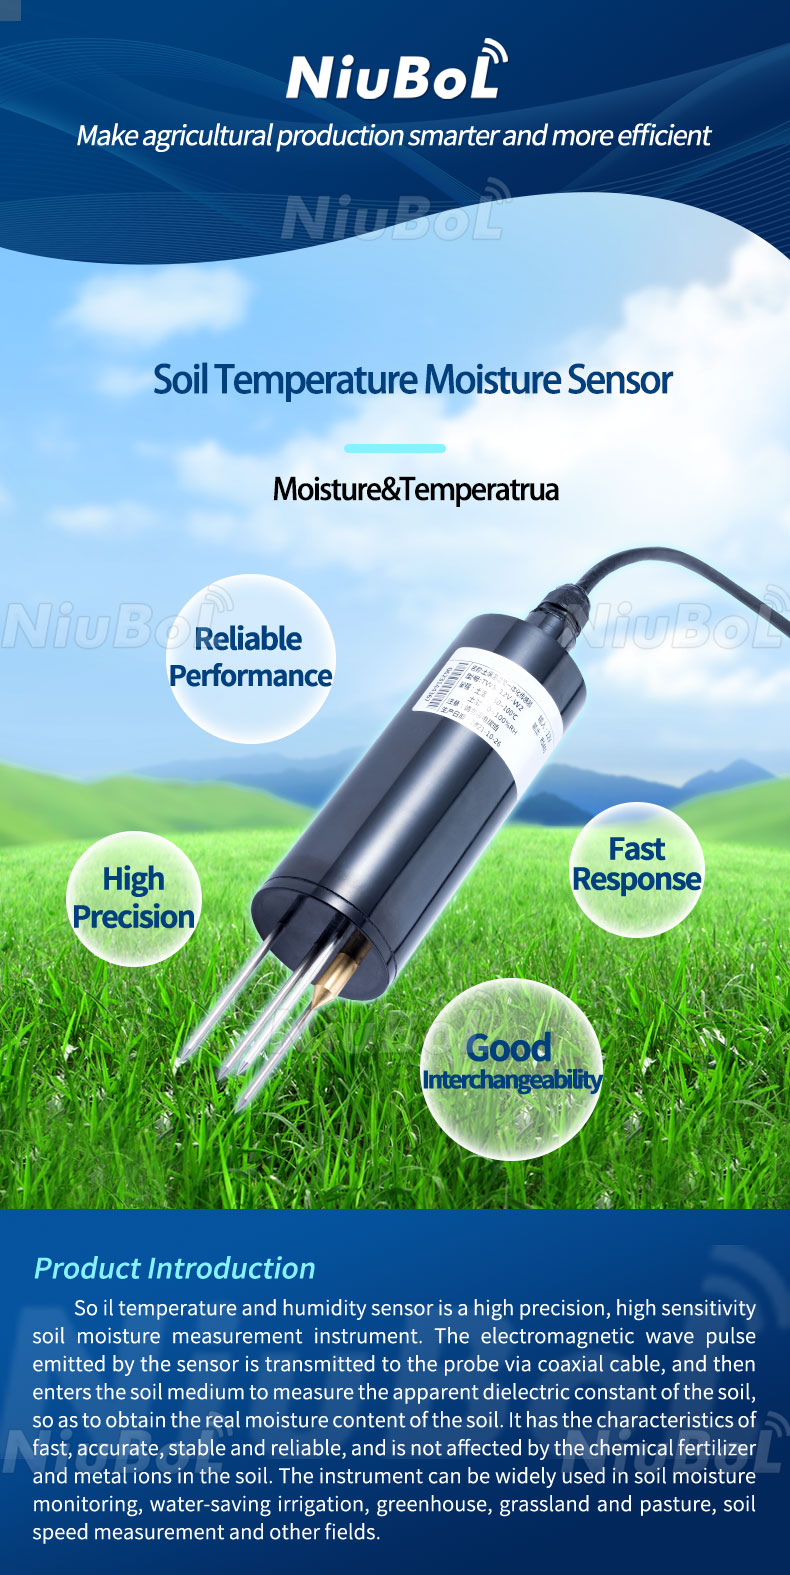
Abnormal rainfall data should be diagnosed from the measurement chain rather than corrected by assumption. Separate communication faults, mechanical problems, installation errors and genuine localized rainfall before changing records.
Prev:Farmland Microclimate Monitoring Station: Measurement Architecture
Next:3D Ultrasonic Anemometer Applications and Project Selection
Related recommendations
Sensors & Weather Stations Catalog
 Agriculture Sensors and Weather Stations Catalog-NiuBoL.pdf
Weather Stations Catalog-NiuBoL.pdf
Agriculture Sensors Catalog-NiuBoL.pdf
Water Quality Sensor Catalog-NiuBoL.pdf
Related products
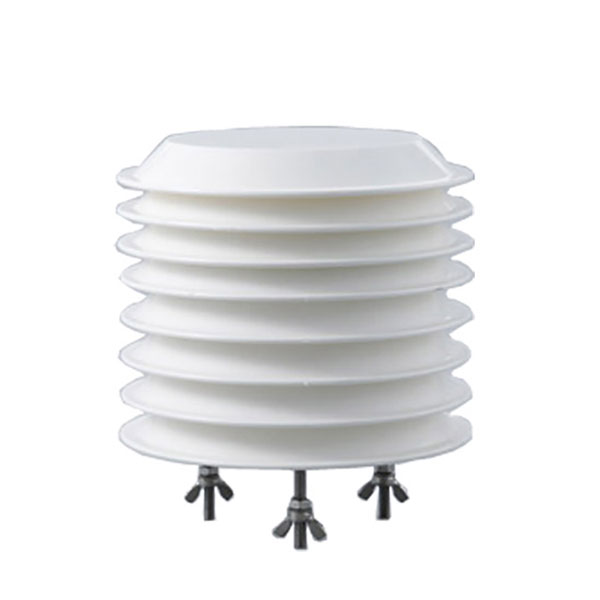 Combined air temperature and relative humidity sensor
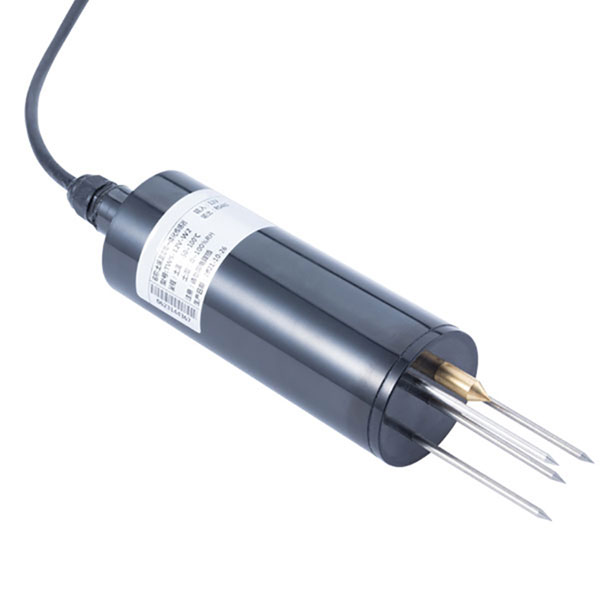 TDR Soil Moisture & Temperature Sensor for irrigation| RS485 |4-20mA| NBL-S-THR
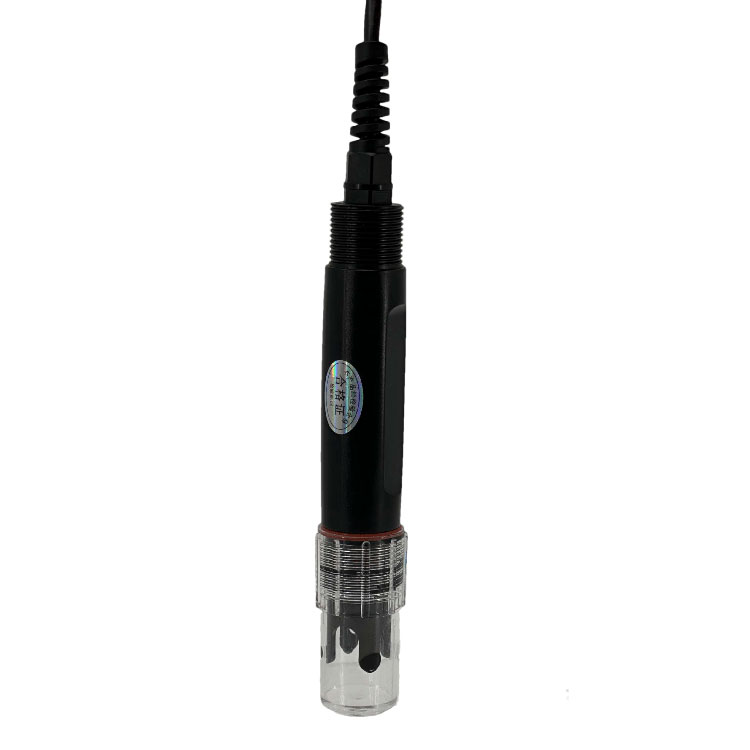 Soil pH sensor RS485 soil Testing instrument soil ph meter for agriculture |NBL-S-PH
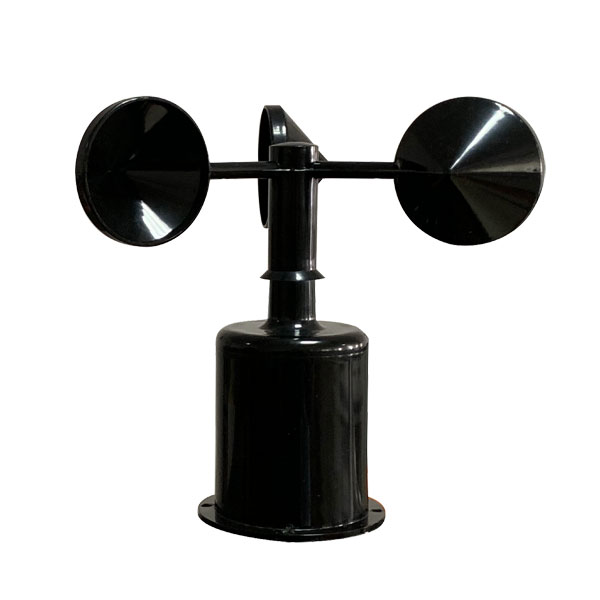 Wind Speed sensor Output Modbus/RS485/Analog/0-5V/4-20mA
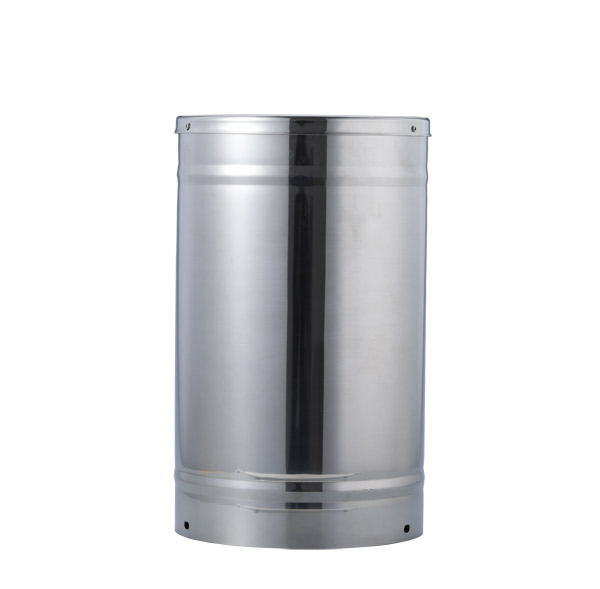 Tipping bucket rain gauge for weather monitoring auto rainfall sensor RS485/Outdoor/stainless steel
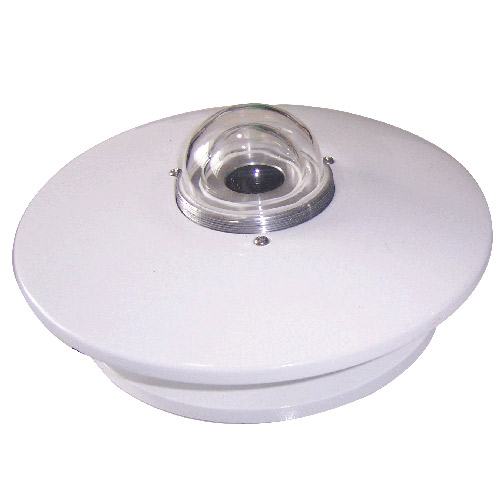 Pyranometer Solar Radiation Sensor 4-20mA/RS485


Screenshot, WhatsApp to identify the QR code
WhatsApp number:+8615367865107
(Click on WhatsApp to copy and add friends)