


— Blogs —
—Products—
 Consumer hotline +8618073152920
 WhatsApp:+8615367865107
Address:Room 102, District D, Houhu Industrial Park, Yuelu District, Changsha City, Hunan Province, China
Product knowledge
Time:2026-06-17 09:36:37 Popularity:192
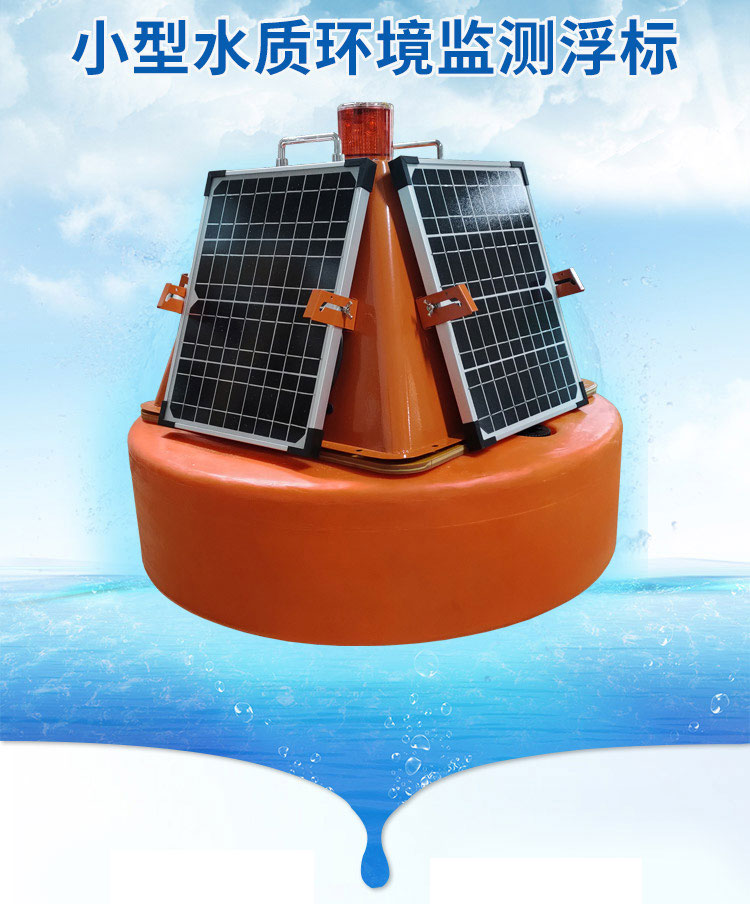
A buoy water quality monitoring station is a field platform for automatic, networked and in-situ surface water monitoring. It combines buoy structure, water quality sensors, data acquisition, wireless communication, power supply and platform software. Compared with a fixed cabinet on shore, a buoy station places the measurement point closer to the water body that must be evaluated, which is important for reservoirs, fish ponds, river sections, drinking water source areas and lake management projects.
A buoy station can be configured as an integrated system that measures dissolved oxygen, pH, ORP, conductivity, turbidity and other parameters, with the host collecting bus data and sending it to a remote server. This guide focuses on deployment details that buyers, distributors and system integrators should clarify before procurement.
Before choosing buoy size or sensor quantity, define the monitoring mission. Is the station protecting a drinking water intake, supporting aquaculture management, checking river pollution, or building a lake trend database? Each mission changes parameter priority, data interval, power budget, anchoring design and alarm threshold. A reservoir intake may need turbidity, pH, conductivity and dissolved oxygen. Aquaculture may prioritize dissolved oxygen, pH, temperature and ammonia nitrogen. A pollution control project may add COD, turbidity and conductivity.
The buoy station acts as the remote measurement node in a larger monitoring network. Sensors send values to the host through RS485 / Modbus RTU or supported bus channels. The host processes the data, stores local records and transmits readings to a remote server. Users view data from a web system or mobile application, query history and receive alarms. This architecture lets the project team manage several buoy stations from one platform.
| Parameter | Engineering Reference | Integration Note |
|---|---|---|
| Platform type | Buoy-mounted automatic water quality monitoring station | Used for in-situ measurement in surface water |
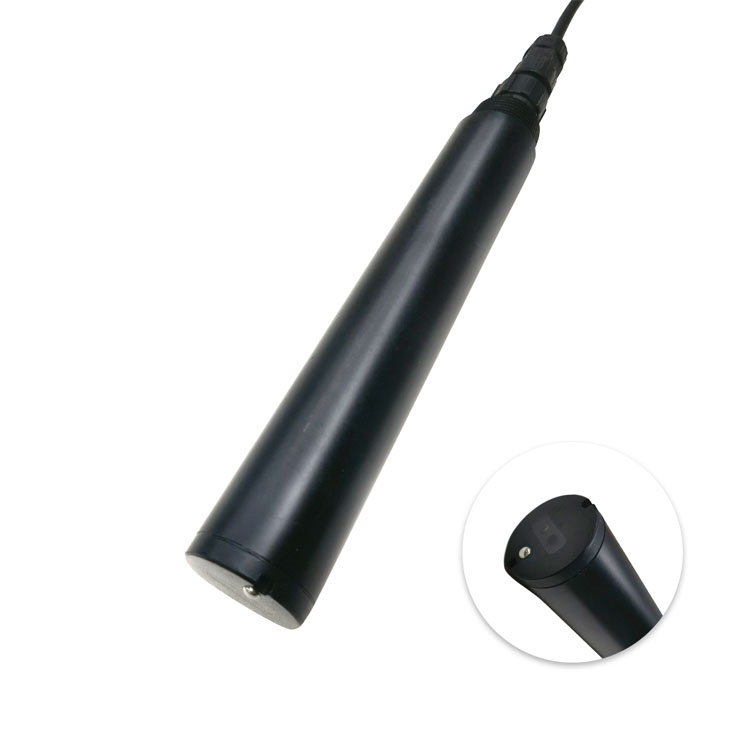
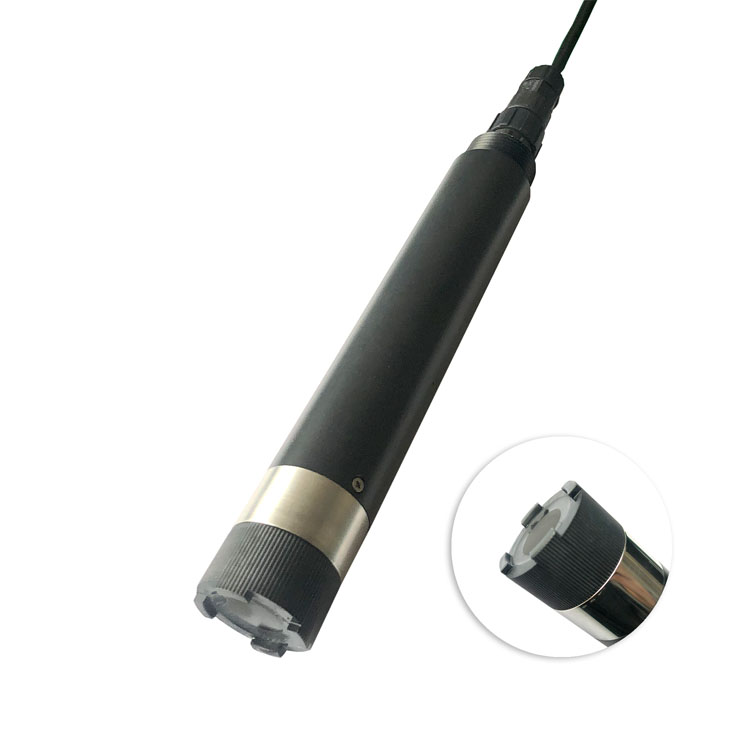
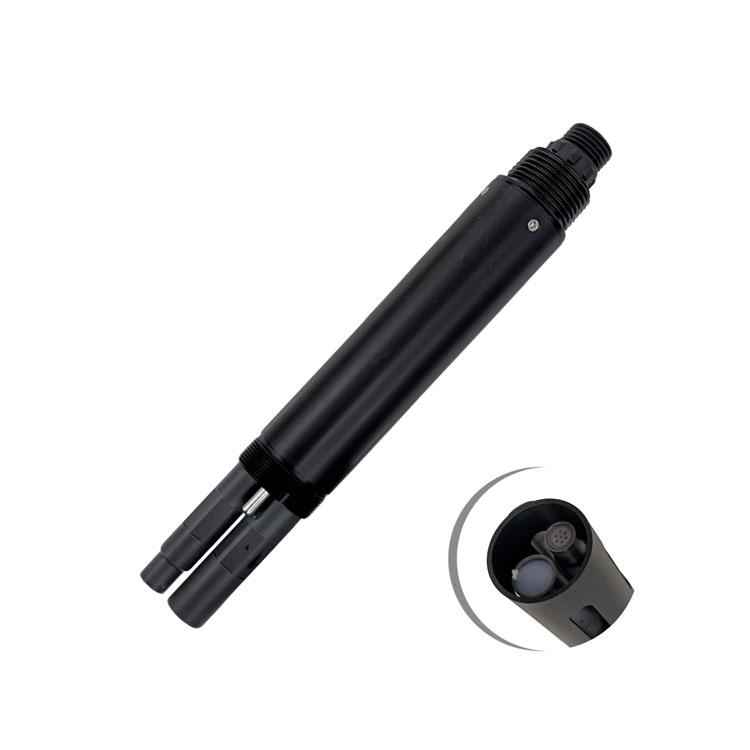
| Selectable sensors | DO, pH, ORP, conductivity, turbidity, ammonia nitrogen and other project sensors | Choose parameters by monitoring mission |
| Sensor output | RS485 Modbus RTU for many digital water quality probes | Supports multi-sensor bus acquisition |
| Power system | Solar panel and battery storage depending on station model | Calculate autonomy for cloudy days |
| Communication | Wireless module to remote server or platform | Confirm signal coverage at actual water location |
| Mechanical deployment | Buoy body with anchoring or mooring system | Design for water depth, level change and flow |
| Protection | Waterproof electrical compartment and IP-rated probes | Use marine-grade sealing practice for outdoor use |
| Operating conditions | Outdoor surface water environment; model-specific ratings apply | Review wind, wave, ice and debris risks |
| Maintenance | Probe cleaning, calibration, battery check and mooring inspection | Plan service access by boat or bank |
| Data functions | Real-time data, historical query, alarm and report support | Useful for management and project acceptance |
For aquaculture, dissolved oxygen is usually the first parameter because low oxygen creates immediate production risk. pH and temperature help interpret biological activity and water stress. Ammonia nitrogen may be added for intensive farming. For reservoir monitoring, turbidity, pH, conductivity, dissolved oxygen and temperature help show runoff, sediment and stratification changes. For river monitoring, conductivity and turbidity are useful for detecting inflow changes, while pH and ammonia nitrogen support pollution assessment.
Site challenge: Open-water quality may change before the intake point shows a clear abnormality.
System integration scheme: Deploy buoy stations near inflow and intake areas with turbidity, pH, conductivity and DO.
User value: The utility gains earlier warning and a basis for intake operation decisions.
Site challenge: Oxygen demand rises at night and during feeding, while ammonia risk increases with stock density.
System integration scheme: Use DO, pH, temperature and ammonia nitrogen probes on a buoy station.
User value: Farm managers can adjust aeration and water exchange based on continuous data.
Site challenge: Pollution events may move quickly and not be captured by manual sampling.
System integration scheme: Place buoy stations at upstream, suspected source and downstream sections with remote alarms.
User value: The authority or contractor gains time-stamped evidence for investigation.
Site challenge: Restoration projects require comparable data over long periods.
System integration scheme: Monitor DO, turbidity, conductivity, pH and temperature at fixed buoy points.
User value: Project stakeholders can compare seasonal trends and treatment outcomes.
When preparing an inquiry, specify water body type, water depth, deployment duration, parameters, data interval, communication method, platform access, solar power expectation, anchoring requirement, anti-theft requirement and maintenance access. Ask for sensor datasheets, Modbus protocol, station wiring diagram, buoy structure drawing, power calculation and installation guidance. If the buoy will operate in harsh weather, include wind, wave, ice and flood conditions in the specification.
Commissioning should include sensor calibration, Modbus address setup, platform data check, alarm test, battery voltage check, solar charging test and anchoring inspection. Keep the sensor depth stable and avoid collision with the buoy body. Use waterproof connectors and strain relief at all cable entries. For long-term monitoring networks, use consistent parameter names and units across stations to make trend comparison reliable.
For a buoy station, acceptance should be performed in two stages. The first stage is a land-based functional test. Power on the controller, connect every sensor, verify RS485 communication, check platform display, confirm alarm logic and make sure each sensor value uses the correct unit. This stage is easier to troubleshoot because the equipment is still accessible.
The second stage is on-water acceptance. After anchoring, check whether the buoy remains stable, whether the sensor depth is correct, whether solar charging works, and whether wireless signal remains available at the actual location. Record the first day of data and compare it with manual observations or portable instrument checks. If the project uses several buoy stations, compare timestamps and reporting intervals across all stations.
Mechanical acceptance is as important as electrical acceptance. Inspect anchor rope, chain, anti-loosening parts, cable protection, probe guard and waterproof enclosure. In lakes and reservoirs, floating debris and seasonal water-level changes may create more risk than the sensor electronics. A well-designed buoy station should allow safe maintenance without disturbing the sensor mounting position every time.
When multiple buoy stations are deployed, the value comes from comparison. The platform should allow the user to compare upstream and downstream stations, inflow and intake stations, or pond center and pond edge stations. To make that comparison reliable, all stations should use consistent parameter units, synchronized time settings and similar reporting intervals.
Alarm rules should also be location-specific. A dissolved oxygen alarm for aquaculture may be stricter than a general lake monitoring alarm. A turbidity alarm near a river inflow may be different from an intake protection alarm. Buyers should define these rules during commissioning instead of using one fixed threshold for every site.
The first mistake is choosing a buoy station only by the number of sensors. More sensors do not automatically create better data if maintenance access, power autonomy and alarm rules are weak. The second mistake is ignoring the water body. A calm pond, a reservoir and a fast river require different anchoring and protection. The third mistake is treating platform software as an afterthought. If users cannot easily view trends, export history or receive alarms, the station will not deliver its full management value.
A stronger procurement approach is to ask for a complete station proposal that includes sensor configuration, power calculation, communication method, anchoring accessories, installation procedure, maintenance plan and data platform functions. This makes technical comparison easier and gives the project owner a clearer basis for approval.
For buyers who manage public or industrial water projects, the station proposal should also include delivery schedule, spare parts, user training and after-sales response method. These items may look administrative, but they strongly affect whether the buoy station can remain online after installation.
When the project is located far from the supplier, remote support becomes part of the technical design. Clear wiring labels, photos of the installed cabinet, Modbus register documents and platform screenshots help the service team diagnose problems without waiting for another site visit. This reduces downtime.
A: It is an automatic floating platform that carries water quality sensors, power, communication and data acquisition equipment for in-situ monitoring.
A: A buoy station measures directly at the open-water point, while a shore station may depend on sampling lines or bank-side conditions.
A: Dissolved oxygen, pH, temperature, conductivity, turbidity, ORP and ammonia nitrogen are common choices.
A: Yes. Many digital water quality probes use RS485 Modbus RTU, allowing the station host to collect multiple parameters.
A: Sensor power, controller power, communication interval, sunlight conditions and required backup days determine panel and battery sizing.
A: Poor anchoring, debris collision, insufficient power margin and difficult maintenance access are common risks.
A: Yes. The platform can generate alarms when measured values exceed configured thresholds or when device status changes.
A: Include parameters, ranges, buoy structure, power design, communication, platform function, anchoring accessories and maintenance requirements.
A: Calibration interval depends on sensor type and water condition. High-fouling water requires more frequent inspection and verification.
A: It provides continuous, location-specific data that helps operators see trends, events and spatial differences across large water bodies.
A buoy water quality monitoring station is a practical solution for surface water projects that need continuous, remote and representative measurements. NiuBoL buoy station integration should be planned around the monitoring mission, selected sensors, RS485 Modbus data acquisition, solar power, communication coverage and maintenance access. When these details are specified clearly, the station becomes a dependable field node in a scalable water quality monitoring network.
Prev:Floating Water Quality Monitoring Station Advantages for Rivers, Lakes and Aquaculture
Next:VOCs Online Monitoring System for Industrial Parks, Boundary Monitoring and Air Quality Projects
Related recommendations
Sensors & Weather Stations Catalog
 Agriculture Sensors and Weather Stations Catalog-NiuBoL.pdf
Weather Stations Catalog-NiuBoL.pdf
Agriculture Sensors Catalog-NiuBoL.pdf
Water Quality Sensor Catalog-NiuBoL.pdf
Related products
 Combined air temperature and relative humidity sensor
 Soil Moisture Temperature sensor for irrigation|NBL-S-THR
 Soil pH sensor RS485 soil Testing instrument soil ph meter for agriculture |NBL-S-PH
 Wind Speed sensor Output Modbus/RS485/Analog/0-5V/4-20mA
 Tipping bucket rain gauge for weather monitoring auto rainfall sensor RS485/Outdoor/stainless steel
 Pyranometer Solar Radiation Sensor 4-20mA/RS485

Screenshot, WhatsApp to identify the QR code
WhatsApp number:+8615367865107
(Click on WhatsApp to copy and add friends)
