

— Blogs —
—Products—
 Consumer hotline +8618073152920
 WhatsApp:+8615367865107
Address:Room 102, District D, Houhu Industrial Park, Yuelu District, Changsha City, Hunan Province, China
Product knowledge
Time:2026-07-10 16:52:36 Popularity:184
Dust Monitoring System Technical Parameters projects should be planned around data use, not only around sensor purchase. The buyer needs PM2.5, PM10, TSP, noise, temperature, humidity, wind speed and wind direction data only when those values support engineering value and compliance records. A useful system turns site dust into records, alarms and corrective action.
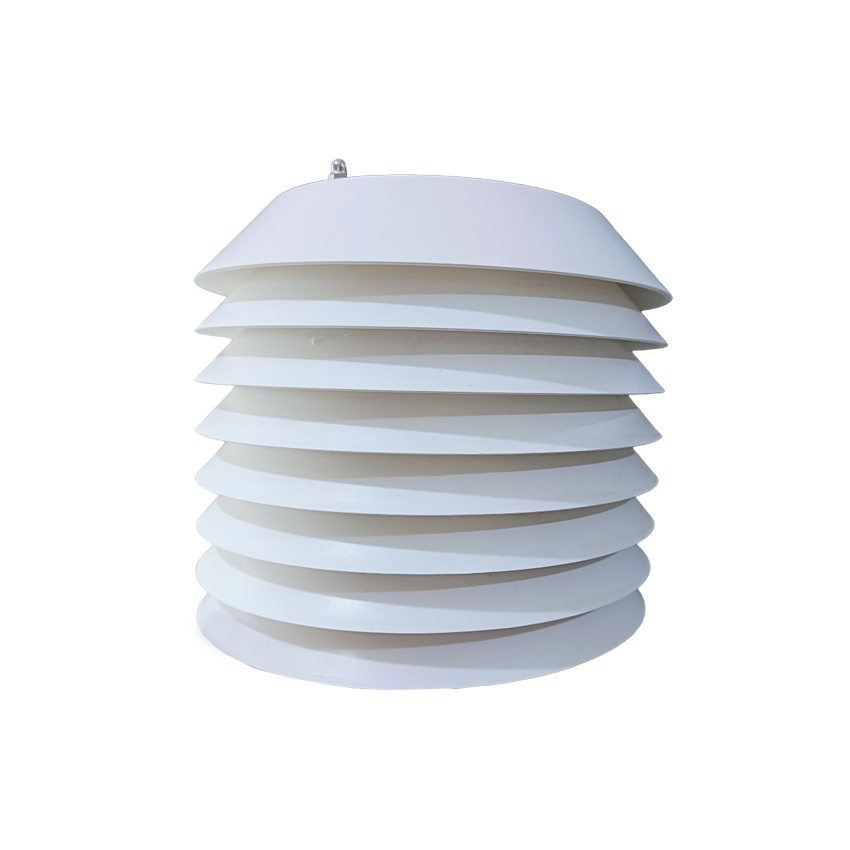
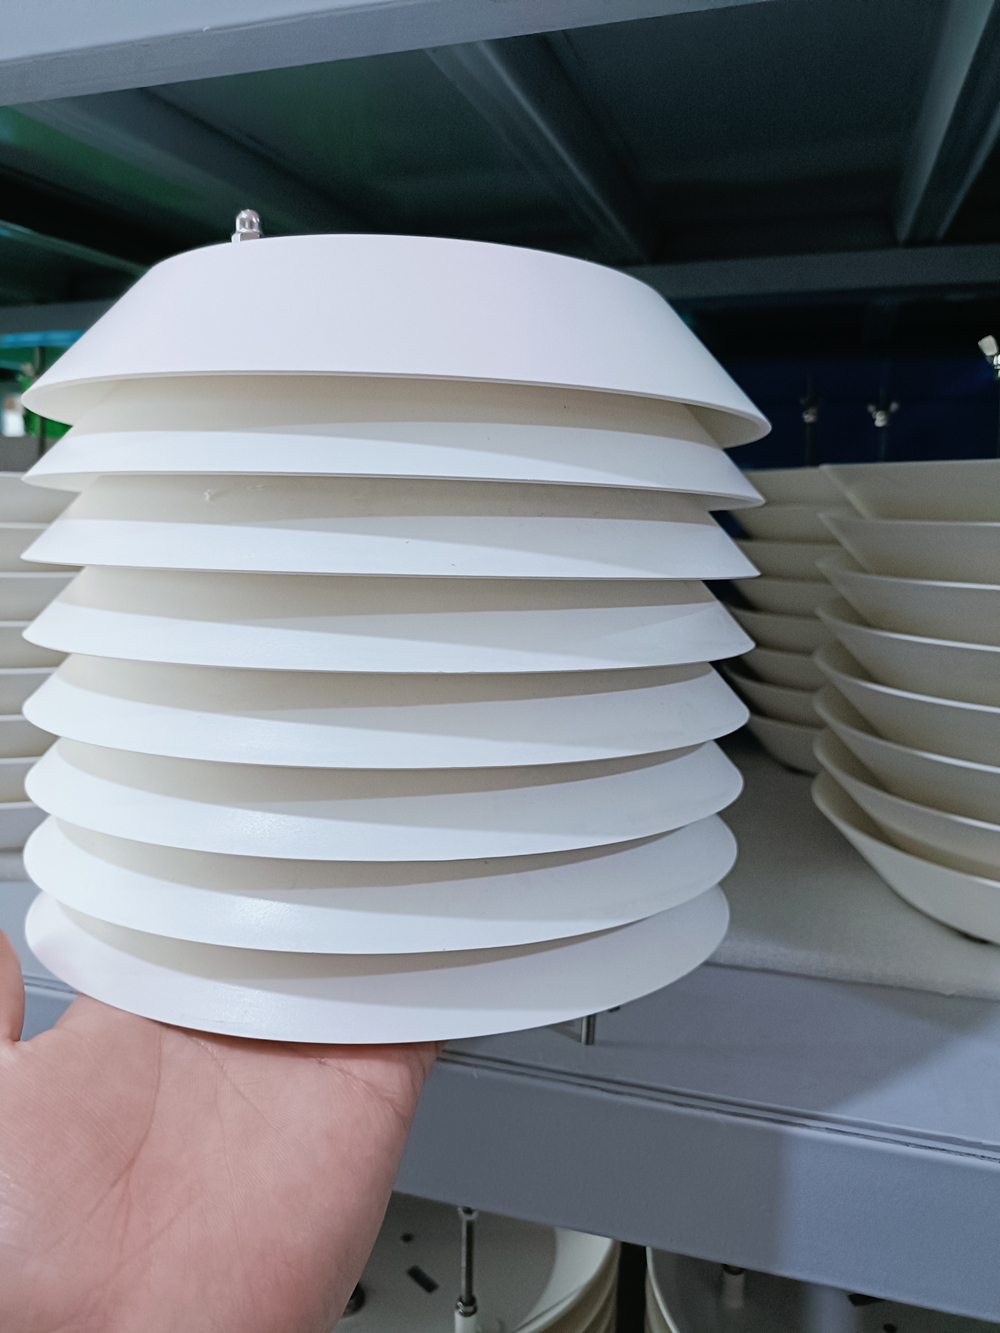
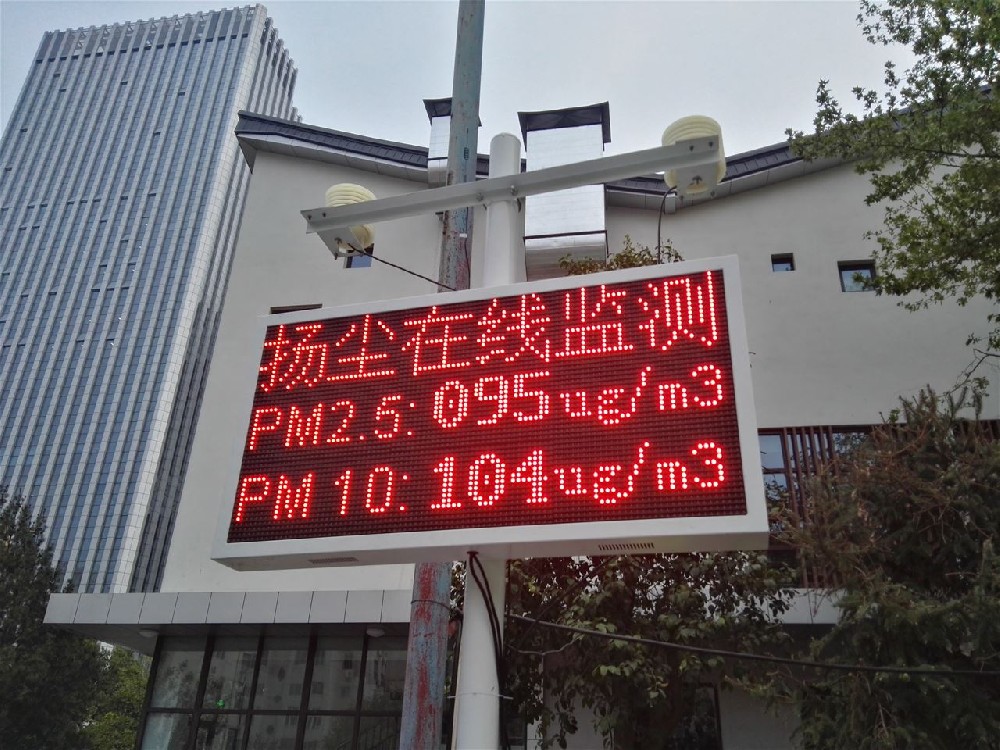
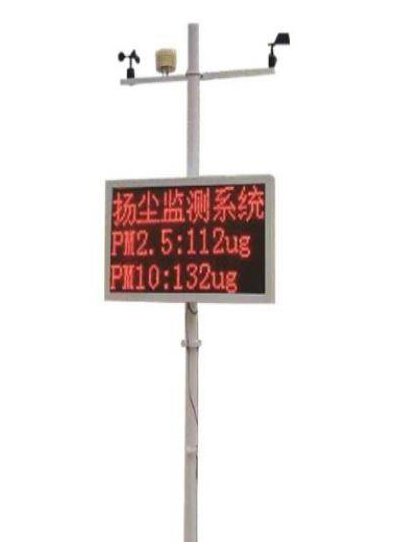
A NiuBoL dust monitoring system can include data collector, sensors, video monitoring, wireless transmission, backend data processing and a management platform. It can support real-time data display, historical query, alarm, statistics, reports, camera evidence and linkage with dust control devices such as fog cannon systems.
A dust monitoring article has practical value when it distinguishes procurement intent. A buyer may need system price, installation requirements, PM sensor parameters, platform alarms, port dust control or construction-site compliance. The article should answer one clear intent instead of repeating the same product description.
| Layer | Typical Content | Project Value |
|---|---|---|
| Sensing layer | PM2.5, PM10, TSP, noise, temperature, humidity, wind speed and direction | Provides quantitative site evidence |
| Data acquisition | Collector and communication module | Converts sensor readings into uploadable records |
| Display layer | Outdoor LED display, optional single or dual color | Shows public or site-level data |
| Platform | Real-time data, history, alarms, reports | Supports management and compliance review |
| Linkage | Fog cannon, tower crane spray or video capture | Turns monitoring into corrective action |
| Element | Range | Resolution | Accuracy |
|---|---|---|---|
| PM2.5 | 0-1000 ug/m3 | 0.1 ug/m3 | ±20% |
| PM10 | 0-2000 ug/m3 | 0.1 ug/m3 | ±20% |
| Noise | 30-130 dB | 0.1 dB | ±5 dB |
| Air temperature | -50 to +100 C | 0.1 C | ±0.5 C |
| Relative humidity | 0-100% RH | 0.1% RH | ±3% RH |
| Wind speed | 0-45 m/s | 0.1 m/s | ±(0.3±0.03V) m/s |
| Wind direction | 0-360 degrees | 1 degree | ±3 degrees |
| Scenario | Field Challenge | Recommended Configuration |
|---|---|---|
| Construction site | Dust varies with earthwork, transport and wind | PM, noise, wind, LED display, 4G platform, camera |
| Sand and gravel yard | Unorganized dust from loading and storage | PM10/TSP, wind data, threshold alarm and spray linkage |
| Coal yard or mine | High particle load and heavy-duty environment | Outdoor enclosure, platform records and maintenance plan |
| Urban road project | Dust and noise close to residential areas | PM, noise, video evidence and public display |
| Port bulk cargo | Wind-driven dust during loading and unloading | PM, wind direction, video and control linkage |
Choose a system when dust data must be recorded, reported or linked to control. Choose a simpler particulate sensor only when the buyer has an existing cabinet, collector and platform. For official or compliance-related projects, ask whether sensors have third-party test reports and whether the platform can export normal and over-limit data separately.
A parameter table should not be copied without explanation. PM range tells whether the instrument can handle high-concentration dust. Resolution tells how small a change can be displayed. Accuracy tells how much uncertainty the buyer should expect. Wind speed and direction explain dust movement. Noise data may be required where construction or traffic complaints are part of the project.
| Parameter | Engineering Value | Common Buyer Mistake |
|---|---|---|
| PM2.5 | Fine particle trend and air quality reference | Using it alone for construction dust |
| PM10 | Useful for fugitive dust and site control | Ignoring wind direction context |
| TSP | Bulk particle assessment for yards and roads | Not confirming range and calibration basis |
| Noise | Complaint and boundary monitoring | No microphone position plan |
| LED display | Public or site transparency | Screen installed where it is unreadable |
For project buyers, the value of a dust monitoring system is strongest when it can pass site acceptance: sensors installed correctly, data uploaded continuously, alarms tested, reports exportable and images linked to over-limit events. These acceptance items should be written before purchase.
The same PM2.5 or PM10 range can be acceptable in one project and insufficient in another. A construction boundary monitor may focus on PM10 and noise. A coal yard may care more about TSP and wind. A municipal display project may need LED visibility and platform reports. A technical parameter becomes useful only after the buyer connects it to the application.
Accuracy also needs context. Dust monitoring systems used for site management and warning are different from laboratory reference instruments. Buyers should ask what the instrument is intended to support: trend monitoring, over-limit warning, public display, internal management or formal acceptance under a local rule.
| Value Area | What Buyers Should Check | Why It Matters |
|---|---|---|
| Continuity | 24-hour upload and auto restart | Prevents missing data during unattended operation |
| Traceability | History, reports and over-limit records | Supports management and review |
| Visibility | Outdoor LED and clear screen layout | Makes site data visible to workers or inspectors |
| Corrective action | Alarm and linkage output | Turns data into dust-control response |
| Maintenance | Filter, enclosure and sensor service access | Keeps readings stable in dusty sites |
Use the parameter table as a starting point for the RFQ, not as the whole RFQ. Add site type, installation location, display requirement, communication method, platform functions, linkage requirement, quantity and local acceptance rule. With that information, a supplier can quote a system that matches the project instead of sending a generic model.
This article is useful because it explains what each number does for the project. A buyer who understands the difference between range, resolution, accuracy, platform records and linkage can compare quotations with fewer mistakes.
Two dust monitoring quotations may list the same parameters but deliver different project value. Ask whether the PM sensor has a defined measurement principle, whether noise measurement is included or optional, whether the wind sensor is installed above obstruction height, whether the LED display content is customizable, whether the platform can export reports, and whether alarm thresholds can be adjusted by user role.
Also ask whether the supplier provides wiring diagrams and platform screenshots before shipment. These items are simple, but they reveal whether the supplier is quoting a complete system or only assembling parts.
A higher configuration is reasonable when the project needs public display, video evidence, linkage control, multi-station comparison or long-term reporting. It is not always necessary for an internal site that only needs PM trend monitoring. The buyer should spend money on the functions that reduce project risk, not on every option in the catalog.
Start with the required parameters, then add the project purpose. For example, a construction boundary project may request PM2.5, PM10, noise, wind, LED display, 4G upload and over-limit alarm reports. A material yard may add TSP, camera and spray linkage. This method creates a quotation based on use, not only on a copied parameter table.
A: PM10, TSP, PM2.5, noise, wind speed and wind direction are the main parameters for most construction, yard and industrial projects. The right priority depends on the site: construction boundaries often focus on PM10 and noise, while bulk material yards need TSP and wind context.
A: Measuring range shows whether the sensor can handle expected dust concentration; accuracy shows expected uncertainty under stated conditions. Buyers should not compare numbers alone. They should ask whether the system is intended for site management, warning, public display or formal acceptance.
A: Resolution affects how small a change can be displayed, while update interval affects how quickly the system shows dust changes. For alarm and linkage projects, slow updates may delay action. For reporting projects, stable historical records may matter more than very fast refresh.
A: Wind data explains dust movement and helps evaluate whether a PM peak is related to the monitored site, another source or weather conditions. It also helps managers choose control actions such as spraying, covering or temporary operation adjustment.
A: An LED display is useful when data must be visible at a construction boundary, industrial gate or public-facing site. It is less necessary for a private internal monitoring point where managers use only the platform. Display size and readability should be specified before purchase.
A: Check real-time display, history records, over-limit alarms, report export, multi-station comparison, user roles and data storage. A platform that only shows live values may be insufficient when the buyer needs acceptance records or management reports.
A: Compare sensor parameters, platform functions, display specification, camera inclusion, communication method, enclosure protection, linkage output, documentation and after-sales support. Similar parameter lists can hide very different project scopes.
A: Include site type, monitoring purpose, parameters, measuring ranges, LED display requirement, platform reports, communication method, linkage need, installation quantity and local acceptance requirement. This turns a parameter list into a project specification.
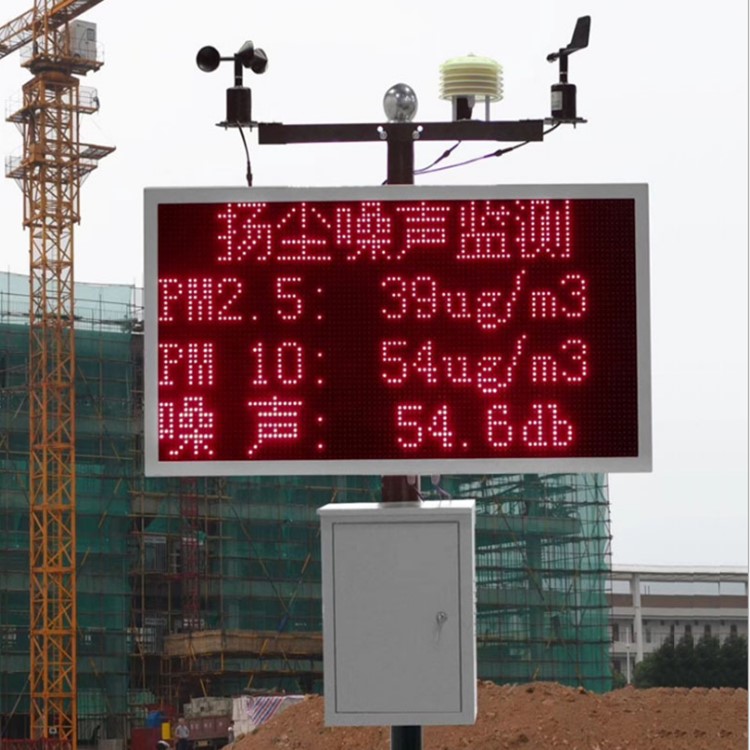
Dust Monitoring System Technical Parameters should be purchased as a management tool. The value is not only measuring particles; it is the ability to record, alarm, verify and support timely dust control action.
If you are not sure which configuration fits your dust monitoring system technical parameters project, send the site type, required parameters, communication method, power condition, installation country and expected quantity. NiuBoL can help match a practical configuration instead of only quoting a sensor list.
Prev:Port Dust Pollution Monitoring Guide for Coal Terminals and Bulk Cargo Yards
Next:Real-Time Rainfall Monitoring System Guide for Flood Control, Roads and Agriculture
Related recommendations
Sensors & Weather Stations Catalog
 Agriculture Sensors and Weather Stations Catalog-NiuBoL.pdf
Weather Stations Catalog-NiuBoL.pdf
Agriculture Sensors Catalog-NiuBoL.pdf
Water Quality Sensor Catalog-NiuBoL.pdf
Related products
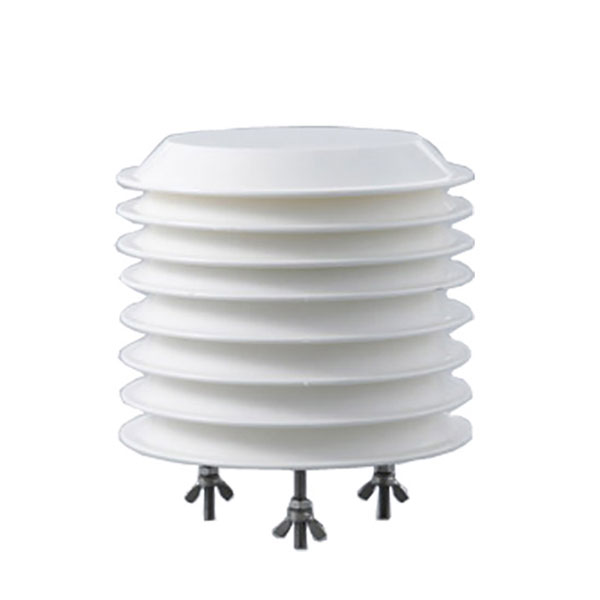 Combined air temperature and relative humidity sensor
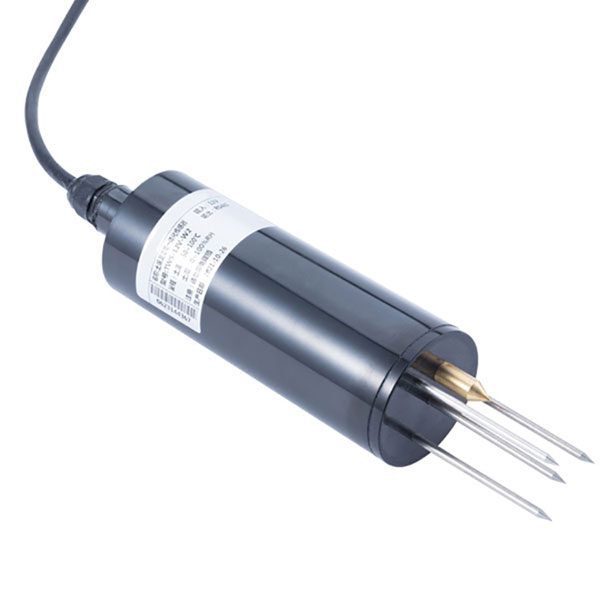 TDR Soil Moisture & Temperature Sensor for irrigation| RS485 |4-20mA| NBL-S-THR
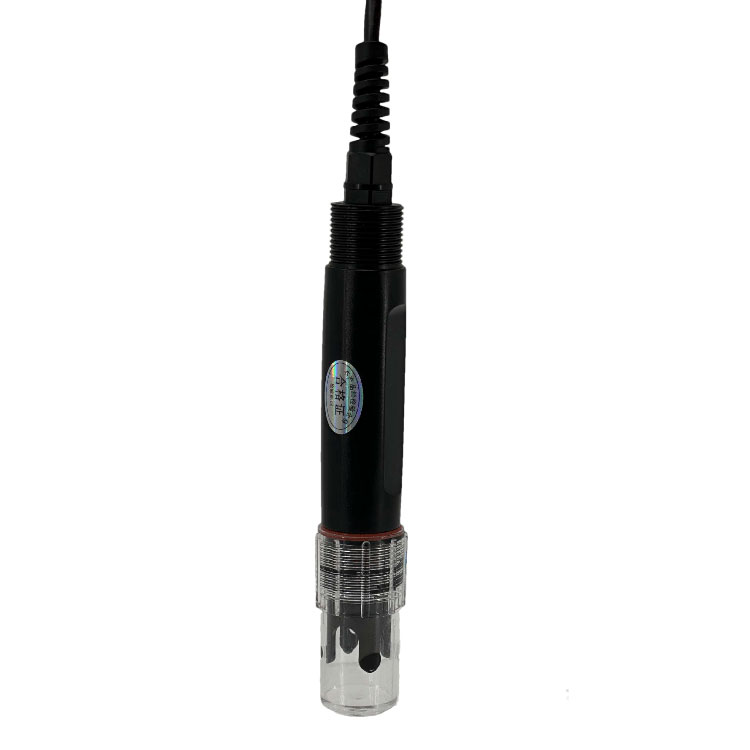 Soil pH sensor RS485 soil Testing instrument soil ph meter for agriculture |NBL-S-PH
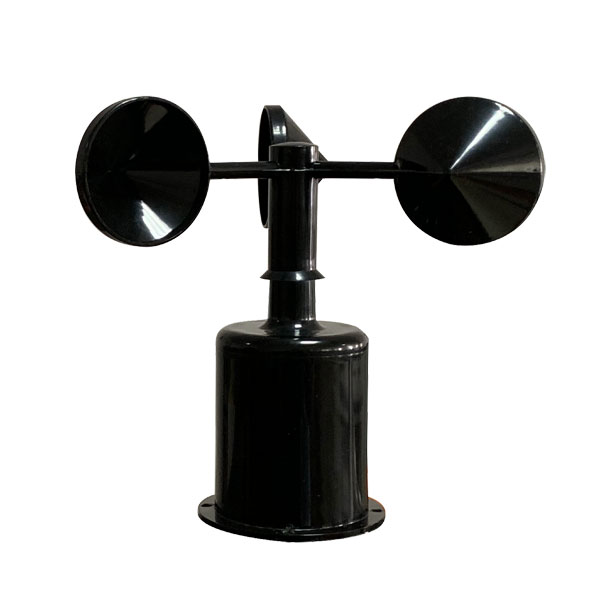 Wind Speed sensor Output Modbus/RS485/Analog/0-5V/4-20mA
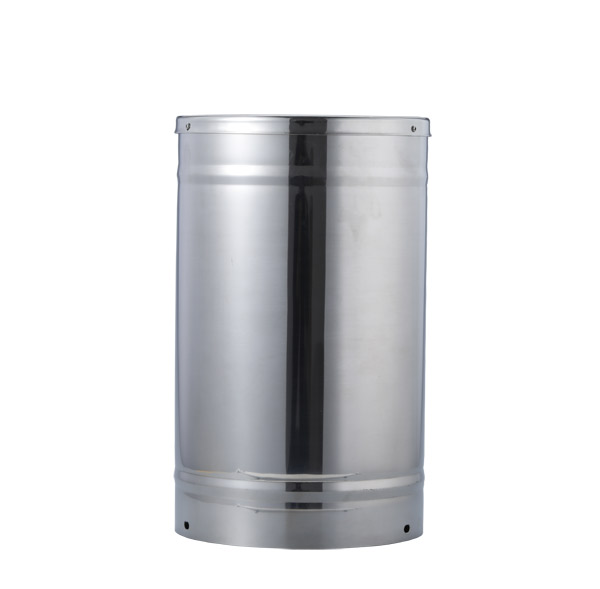 Tipping bucket rain gauge for weather monitoring auto rainfall sensor RS485/Outdoor/stainless steel
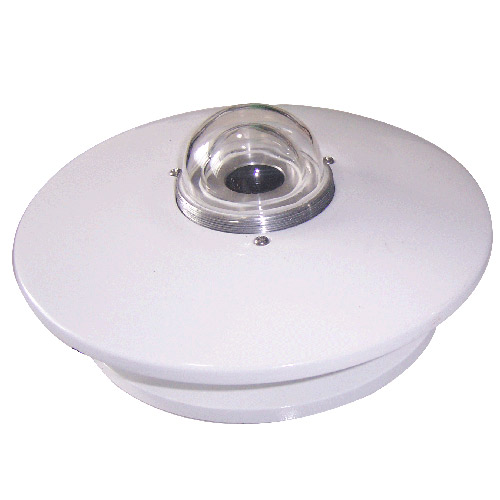 Pyranometer Solar Radiation Sensor 4-20mA/RS485

Screenshot, WhatsApp to identify the QR code
WhatsApp number:+8615367865107
(Click on WhatsApp to copy and add friends)