

— Blogs —
—Products—
 Consumer hotline +8618073152920
 WhatsApp:+8615367865107
Address:Room 102, District D, Houhu Industrial Park, Yuelu District, Changsha City, Hunan Province, China
Product knowledge
Time:2026-07-10 16:52:35 Popularity:203
Port Dust Pollution Monitoring projects should be planned around data use, not only around sensor purchase. The buyer needs PM2.5, PM10, TSP, noise, temperature, humidity, wind speed and wind direction data only when those values support coal terminals and bulk cargo yards. A useful system turns site dust into records, alarms and corrective action.
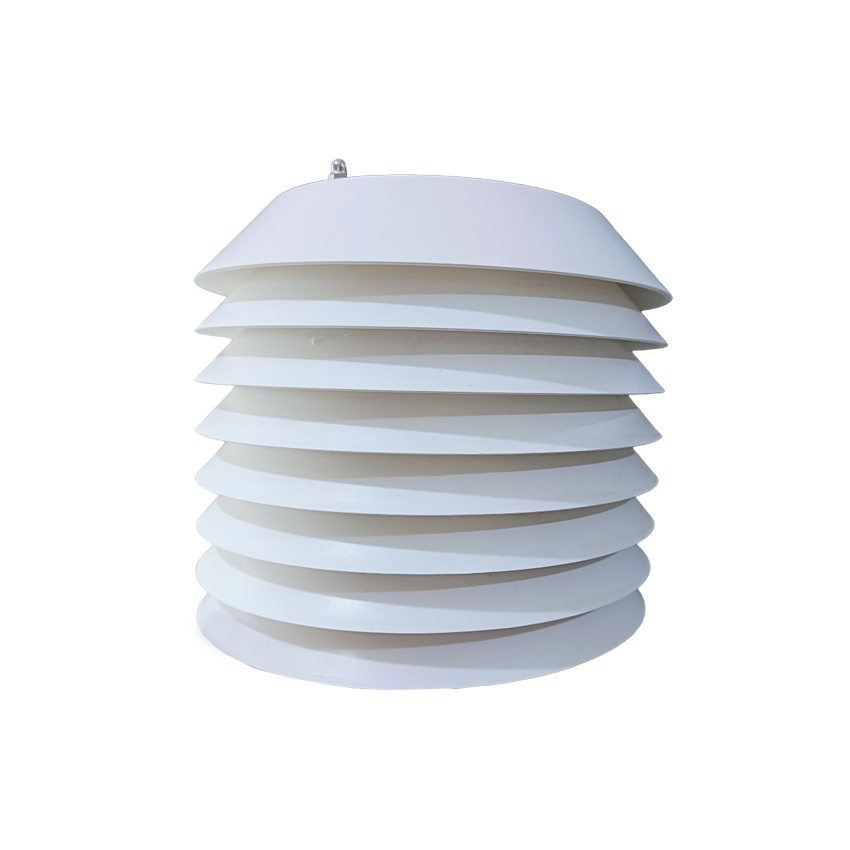
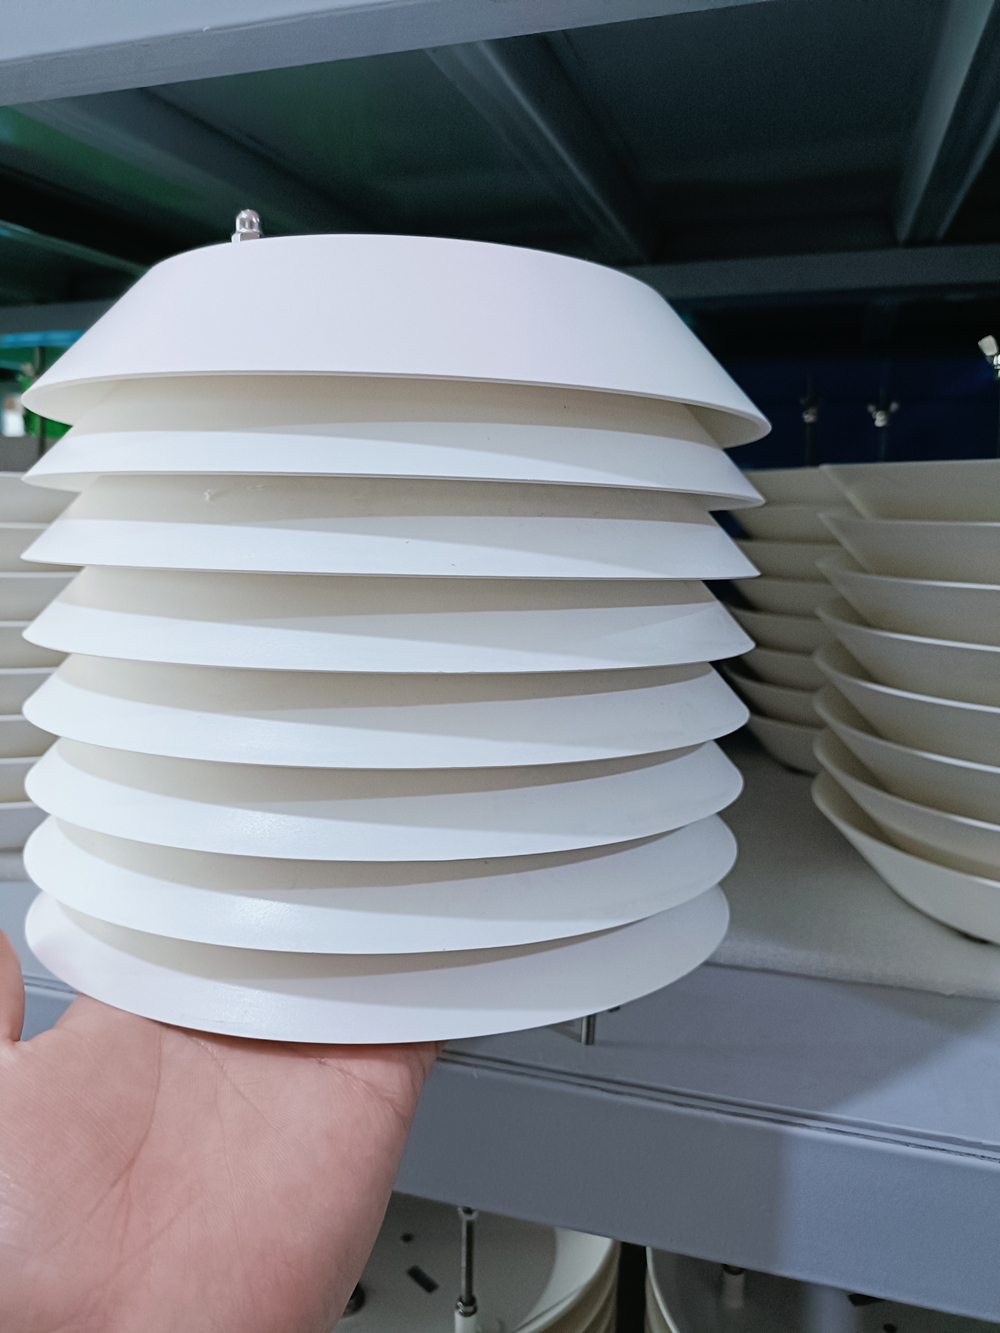
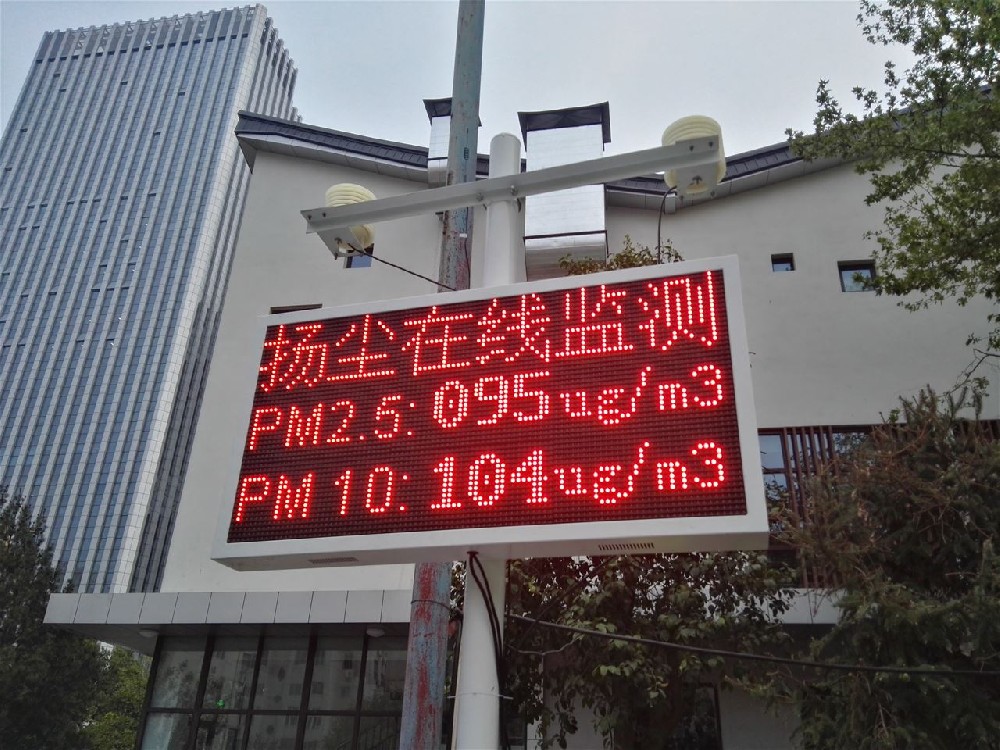
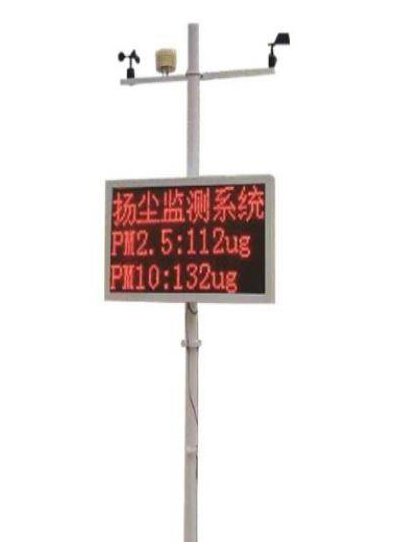
A NiuBoL dust monitoring system can include data collector, sensors, video monitoring, wireless transmission, backend data processing and a management platform. It can support real-time data display, historical query, alarm, statistics, reports, camera evidence and linkage with dust control devices such as fog cannon systems.
A dust monitoring article has practical value when it distinguishes procurement intent. A buyer may need system price, installation requirements, PM sensor parameters, platform alarms, port dust control or construction-site compliance. The article should answer one clear intent instead of repeating the same product description.
| Layer | Typical Content | Project Value |
|---|---|---|
| Sensing layer | PM2.5, PM10, TSP, noise, temperature, humidity, wind speed and direction | Provides quantitative site evidence |
| Data acquisition | Collector and communication module | Converts sensor readings into uploadable records |
| Display layer | Outdoor LED display, optional single or dual color | Shows public or site-level data |
| Platform | Real-time data, history, alarms, reports | Supports management and compliance review |
| Linkage | Fog cannon, tower crane spray or video capture | Turns monitoring into corrective action |
| Element | Range | Resolution | Accuracy |
|---|---|---|---|
| PM2.5 | 0-1000 ug/m3 | 0.1 ug/m3 | ±20% |
| PM10 | 0-2000 ug/m3 | 0.1 ug/m3 | ±20% |
| Noise | 30-130 dB | 0.1 dB | ±5 dB |
| Air temperature | -50 to +100 C | 0.1 C | ±0.5 C |
| Relative humidity | 0-100% RH | 0.1% RH | ±3% RH |
| Wind speed | 0-45 m/s | 0.1 m/s | ±(0.3±0.03V) m/s |
| Wind direction | 0-360 degrees | 1 degree | ±3 degrees |
| Scenario | Field Challenge | Recommended Configuration |
|---|---|---|
| Construction site | Dust varies with earthwork, transport and wind | PM, noise, wind, LED display, 4G platform, camera |
| Sand and gravel yard | Unorganized dust from loading and storage | PM10/TSP, wind data, threshold alarm and spray linkage |
| Coal yard or mine | High particle load and heavy-duty environment | Outdoor enclosure, platform records and maintenance plan |
| Urban road project | Dust and noise close to residential areas | PM, noise, video evidence and public display |
| Port bulk cargo | Wind-driven dust during loading and unloading | PM, wind direction, video and control linkage |
Choose a system when dust data must be recorded, reported or linked to control. Choose a simpler particulate sensor only when the buyer has an existing cabinet, collector and platform. For official or compliance-related projects, ask whether sensors have third-party test reports and whether the platform can export normal and over-limit data separately.
Port dust is different from ordinary construction dust. Coal, ore, grain and bulk materials are moved by ship, conveyor, vehicle and yard machinery. Wind direction changes the affected area quickly. A port monitoring plan therefore needs PM data, wind data, video context and clear response rules for loading, unloading, stockpiling and vehicle movement.
Ports are economic transport hubs, and coal movement remains a large source of bulk-cargo dust pressure in many coastal logistics networks. The procurement conclusion is direct: port environmental management cannot rely only on manual inspection. It needs continuous monitoring points placed near cargo yards, transfer points, boundaries and sensitive receptors.
| Monitoring Point | Reason | Recommended Data |
|---|---|---|
| Coal yard boundary | Track dust leaving the yard | PM10, TSP, wind speed, wind direction |
| Loading/unloading area | Capture process-related emissions | PM, video, wind and time records |
| Residential boundary | Support complaint response | PM2.5, PM10, noise and trend records |
| Control room display | Support operation decisions | Dashboard, alarms and history |
Monitoring alone does not reduce dust. The station should connect data to actions: spray system, fog cannon, material covering, truck washing, route cleaning or temporary operation adjustment under high wind. This action logic is what makes monitoring valuable to port operators.
A port buyer should start with cargo type, yard layout, prevailing wind, loading method, sensitive boundaries and existing dust-control equipment. Coal, ore, sand, grain and cement all create different dust patterns. A system designed only from a standard product list may miss the transfer point that creates the highest dust peak.
The port also needs to decide whether data is for internal operation, environmental reporting, customer communication or government inspection. Internal operation may need fast alarms and linkage. Reporting may need stable historical records and export. Boundary management may need multiple stations and wind-direction analysis.
| Data | Port Use | Typical Action |
|---|---|---|
| PM10/TSP | Tracks bulk cargo dust concentration | Start spray, adjust loading or clean road |
| Wind speed | Identifies high-risk dust movement periods | Increase covering or reduce exposed handling |
| Wind direction | Shows likely affected boundary | Compare downwind stations and complaint areas |
| Video | Connects high readings with visible activity | Verify loading, unloading or truck movement |
| History reports | Supports management review | Find repeated high-risk operation times |
A small inland terminal may need two or three monitoring points with PM, wind and platform reporting. A large coastal coal terminal may need boundary stations, yard stations, transfer-point stations, cameras and linkage with spray systems. The right design follows the yard, not a fixed template.
For procurement, ask for a monitoring layout drawing before final order. The drawing should show where each station is installed, which parameters are measured, how data is transmitted and which control actions are linked. This drawing is often more valuable than a long product brochure.
Daily use should be simple. The control room checks current PM and wind conditions, reviews alarms by yard area, and compares high readings with loading schedules or camera images. If a repeated pattern appears, such as high PM during truck transfer under a certain wind direction, the port can change road cleaning frequency, spray timing, pile covering or vehicle route.
This is the difference between monitoring for display and monitoring for management. A display-only station may satisfy a visible requirement, but it does not help reduce dust unless someone uses the readings to adjust operation.
A port RFQ should include cargo type, yard map, number of monitoring points, expected parameters, wind conditions, power availability, communication method, platform users, report requirements and whether dust-control equipment needs linkage. Photos of the yard and transfer points help the supplier decide where stations should be placed and which accessories are needed.
A: A port dust monitoring system should measure PM10, TSP, PM2.5 where needed, wind speed, wind direction and often video evidence. Noise or weather parameters may be added depending on the port boundary, cargo type and local management requirements.
A: Wind direction helps identify which yard, loading area or boundary may be affected by dust movement. In ports, coal, ore and bulk cargo dust can shift quickly with wind. PM data without wind direction is much weaker for tracing and response decisions.
A: Typical points include cargo yard boundaries, loading and unloading areas, transfer points, truck roads and sensitive boundaries near residential or public areas. The layout should follow cargo movement and prevailing wind, not a fixed product template.
A: Yes. Data can support spray systems, fog cannon operation, road cleaning, material covering, route adjustment or temporary operation changes under high wind. The value comes from linking readings to action, not from displaying PM numbers only.
A: Video is useful because it connects PM peaks with visible events such as ship unloading, conveyor transfer, truck movement or stockpile handling. It helps managers verify whether a high reading is linked to port operation or an external source.
A: Cost depends on number of monitoring points, parameters, wind sensors, cameras, platform functions, communication method, power supply, pole or foundation work and linkage control. A large port should be quoted by monitoring layout, not by one standard station.
A: The main risk is installing too few stations or placing them where they do not represent the dust path. A port RFQ should include a yard map, cargo type, transfer points, wind conditions and the purpose of each monitoring point.
A: Send cargo type, yard map, number of berths or yards, dust-control equipment, expected monitoring points, power availability, network condition, report requirements and whether linkage is needed. Photos of loading, unloading and storage areas improve configuration accuracy.
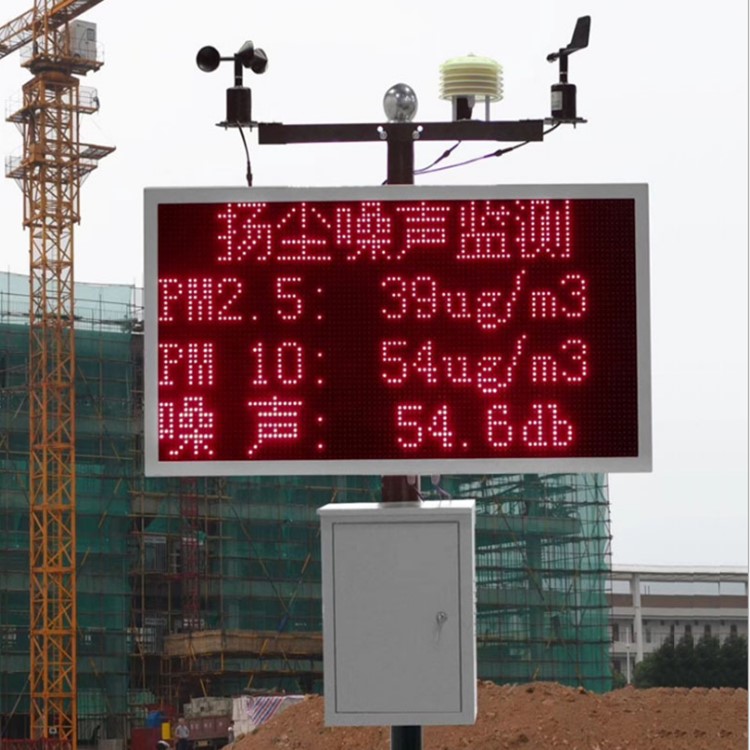
Port Dust Pollution Monitoring should be purchased as a management tool. The value is not only measuring particles; it is the ability to record, alarm, verify and support timely dust control action.
If you are not sure which configuration fits your port dust pollution monitoring project, send the site type, required parameters, communication method, power condition, installation country and expected quantity. NiuBoL can help match a practical configuration instead of only quoting a sensor list.
Prev:Integrated Online Dust Monitor Selection Guide for PM, Noise, Weather and Video Linkage
Next:Dust Monitoring System Technical Parameters and Application Value for Project Buyers
Related recommendations
Sensors & Weather Stations Catalog
 Agriculture Sensors and Weather Stations Catalog-NiuBoL.pdf
Weather Stations Catalog-NiuBoL.pdf
Agriculture Sensors Catalog-NiuBoL.pdf
Water Quality Sensor Catalog-NiuBoL.pdf
Related products
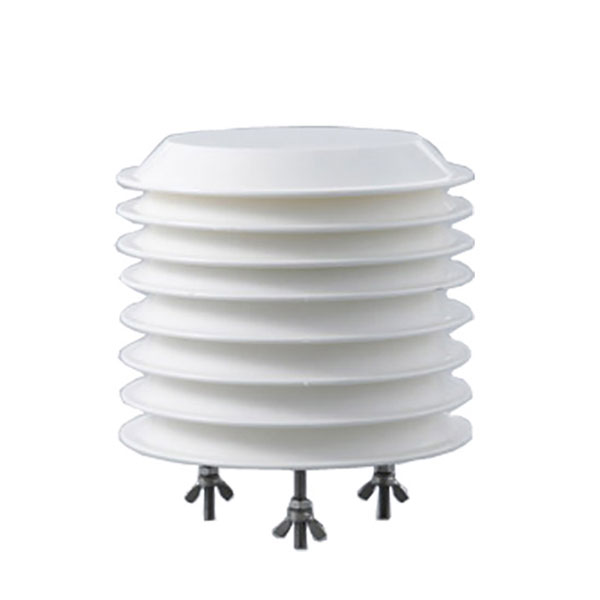 Combined air temperature and relative humidity sensor
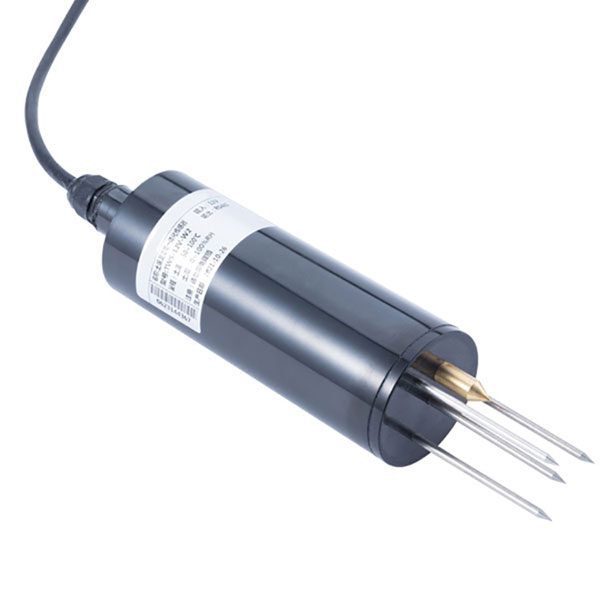 TDR Soil Moisture & Temperature Sensor for irrigation| RS485 |4-20mA| NBL-S-THR
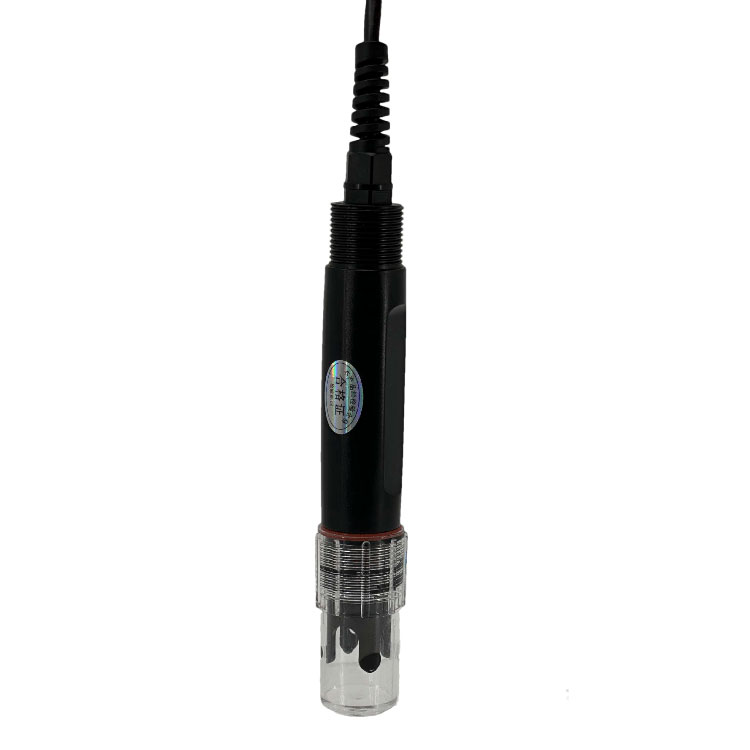 Soil pH sensor RS485 soil Testing instrument soil ph meter for agriculture |NBL-S-PH
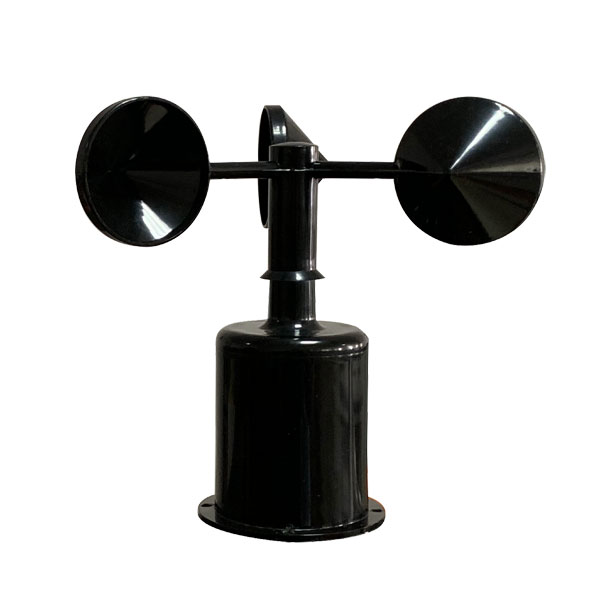 Wind Speed sensor Output Modbus/RS485/Analog/0-5V/4-20mA
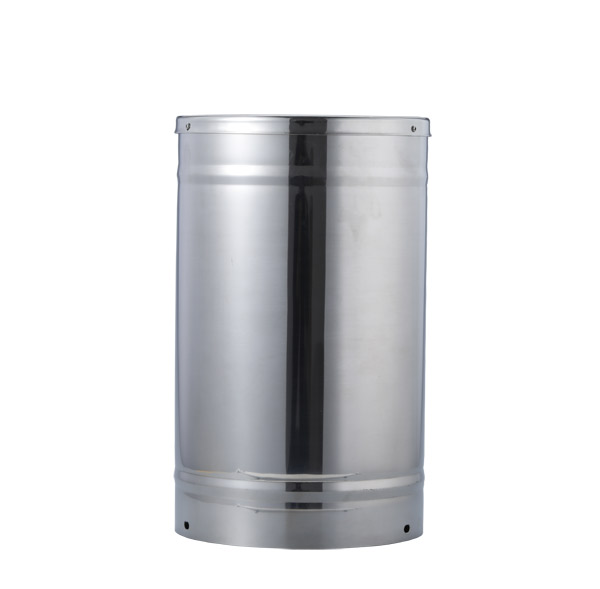 Tipping bucket rain gauge for weather monitoring auto rainfall sensor RS485/Outdoor/stainless steel
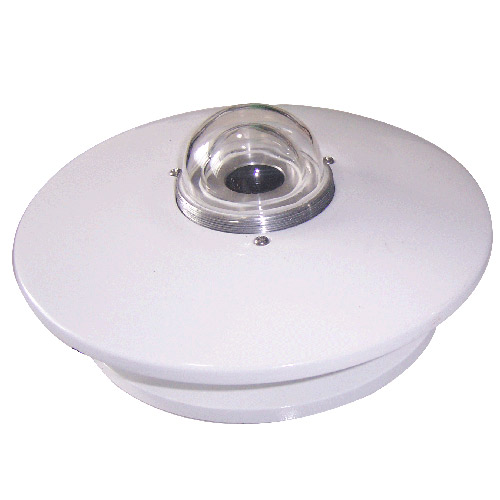 Pyranometer Solar Radiation Sensor 4-20mA/RS485

Screenshot, WhatsApp to identify the QR code
WhatsApp number:+8615367865107
(Click on WhatsApp to copy and add friends)