

— Blogs —
—Products—
 Consumer hotline +8618073152920
WhatsApp:+8615367865107
Address:Room 102, District D, Houhu Industrial Park, Yuelu District, Changsha City, Hunan Province, China
Product knowledge
Time:2026-11-07 15:53:23 Popularity:8
A multi-parameter environmental monitoring sensor combines several sensing elements, a shared inlet, one conditioning and digitizing stage, and a single digital output. The convenience is real: one enclosure, one cable, one Modbus address map. The cost is that the channels are not independent. They share an air path, a temperature environment, a supply and often a compensation algorithm, so a fault in one place can appear as a plausible change in several channels at once.
Parameter lists are easy to expand and hard to justify. A municipal air quality node needs PM2.5, PM10 and the gases relevant to its emission sources. An industrial exhaust point needs VOCs, SO₂, NOx and particulate matter. A scenic-area or indoor comfort station may need negative ion concentration, temperature and humidity instead. Each added channel increases power draw, calibration workload and the chance of cross-sensitivity.
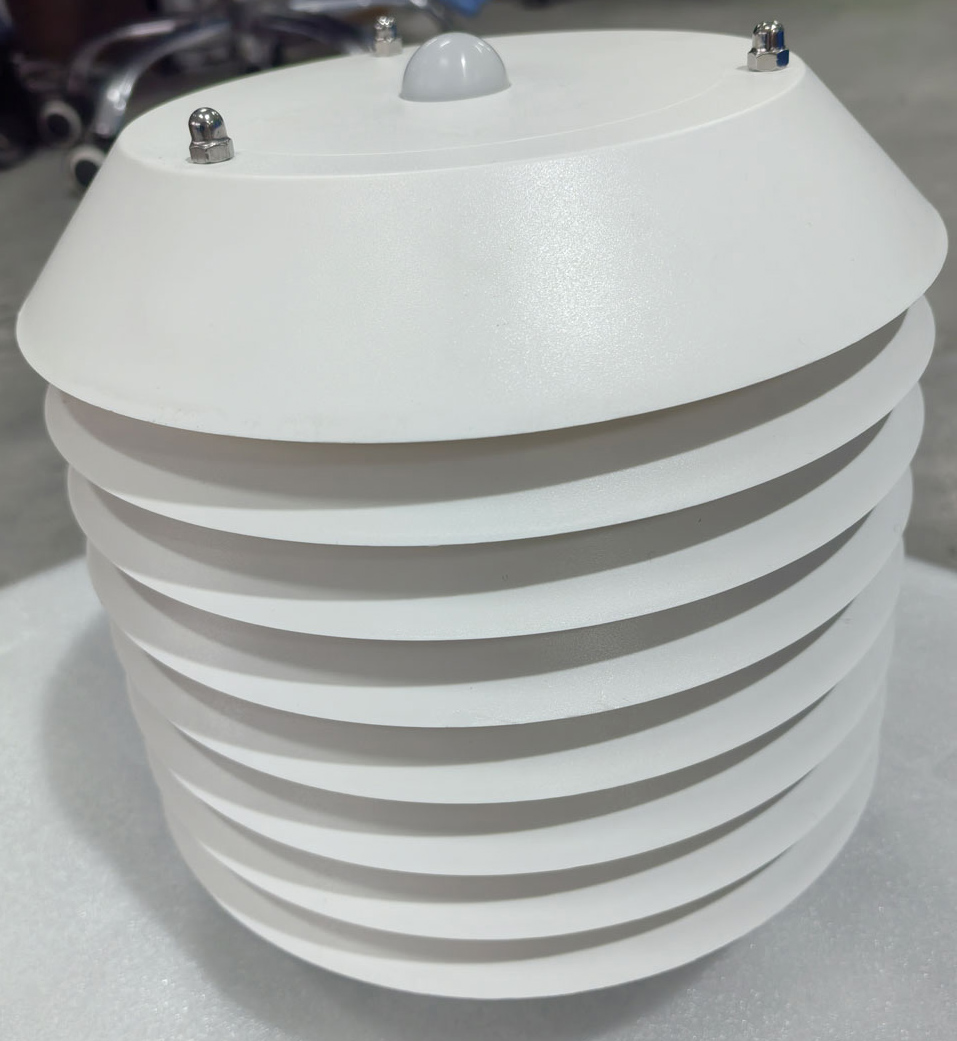
Figure 1. 6-in-1 Temperature, Humidity, Pressure, Illuminance, CO2, and CO Sensor.
NiuBoL's 6-in-1 air quality sensor detects PM2.5, CO, CO₂, O₃, SO₂ and NO₂, with optional PM10 customization, and is specified at ±5% FS sampling accuracy over −30°C to 50°C and 15% to 90% RH. That single line contains three decisions: which six parameters, what accuracy convention, and what environmental envelope. A buyer should ask all three questions, not just the first.
For particulate-only applications, NiuBoL's particulate matter sensor series integrates PM1, PM2.5 and PM10 monitoring, with a documented PM2.5 measurement range of 0–1000 μg/m³. For industrial exhaust, NiuBoL describes a monitor that integrates VOCs, PM, SO₂ and NOx sensors in an IP65 enclosure at a discharge port. These are different instruments for different questions, although all three can be described as "environmental monitoring sensors".
| Parameter | Question it answers | Common interference |
|---|---|---|
| PM2.5 / PM10 | Particle mass concentration at a size cut | High humidity, fog, inlet obstruction |
| CO | Incomplete combustion / safety | Cross-gas response, sensor lifetime |
| CO₂ | Ventilation adequacy | Temperature, calibration baseline |
| O₃ / SO₂ / NO₂ | Oxidant and combustion-gas exposure | Cross-sensitivity between electrochemical cells |
| VOCs | Solvent / process emissions | Broad response, not compound-specific |
| Negative ion concentration | Small air ion population | Humidity leakage, airflow, nearby corona sources |
| Temperature / RH | Context and compensation | Solar radiation, siting |
Each channel begins with its own physical transduction — light scattering for particles, electrochemical current for many gases, NDIR absorption for CO₂, a biased collector for ions. After that, the channels converge: amplification, filtering, temperature compensation, ADC, register mapping and RS485 Modbus RTU output. NiuBoL's environmental equipment commonly exposes RS485 Modbus RTU, and its industrial collector specification lists 16 sensor inputs, 128 GB storage, breakpoint resume transmission and remote configuration of sampling frequency and thresholds.
Convergence creates three specific risks.
A common-mode supply fault looks like a multi-channel event. If the supply at the enclosure sags, several channels may drift or drop out together. Because the pattern looks like a real air-quality episode, it is often misdiagnosed. Measure voltage at the device under load and log a supply or status flag where the device provides one.
A shared inlet means shared sample air. NiuBoL's installation guidance for the 6-in-1 sensor specifies mounting in open, well-ventilated areas using pole fixation with unobstructed sensor inlets. An inlet under a canopy, against a wall or downwind of a vent changes every gas and particle channel at once. No per-channel calibration fixes that.
A single compensation algorithm may not suit every element. Temperature compensation that is appropriate for an electrochemical cell is not necessarily appropriate for a light-scattering particle channel. Ask which channels are compensated, over what range, and whether the raw and compensated values can both be read.
Solution-level NiuBoL material describes monitoring 15+ pollutants with precision ≤±5%, exceedance response time ≤3 seconds, automatic alert push, edge-cloud collaboration with local filtering and anomaly detection, encrypted cloud storage, transmission success rate ≥99.9% and annual device failure rate ≤1%. Those describe a complete system under stated conditions. They are useful as acceptance questions — measured under what network conditions, at what concentration, with what calibration interval — but they are not a substitute for the individual channel datasheet.
Cross-sensitivity is the response of one channel to something other than its target. In a multi-parameter enclosure it has four common sources.
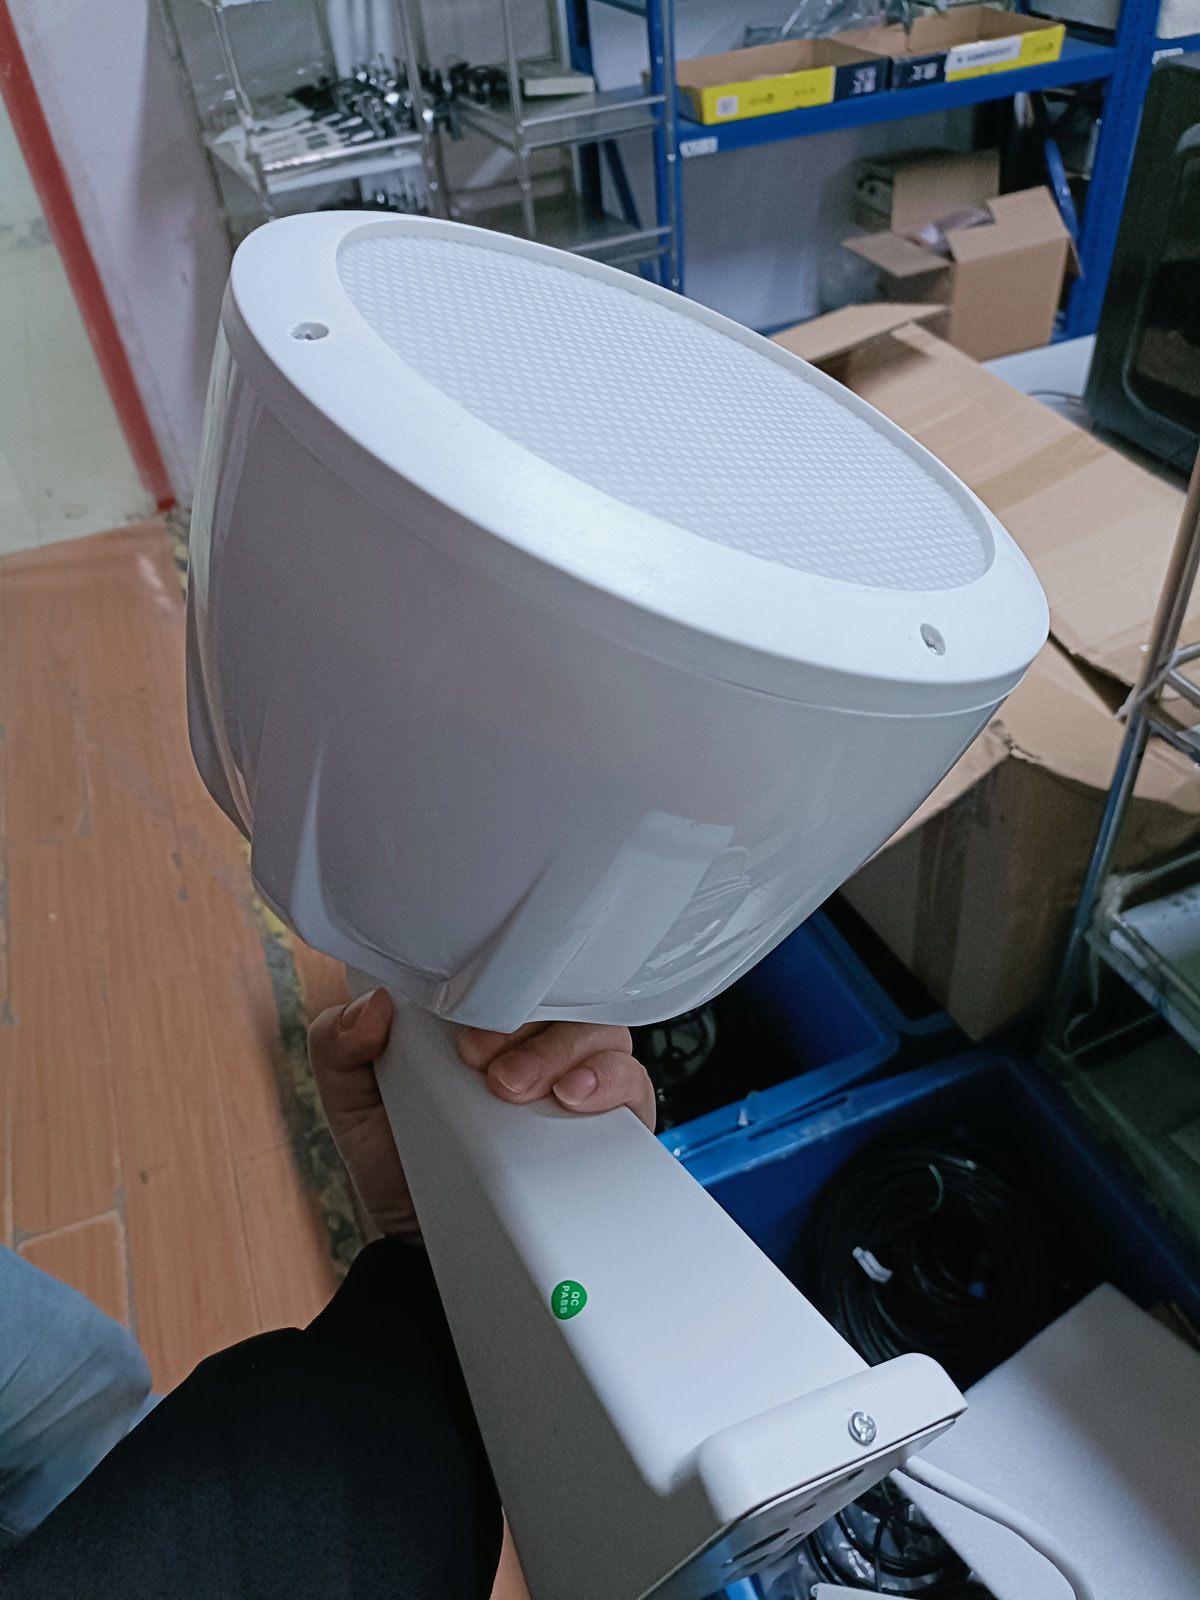
Figure 2. 6-in-1 Air Quality Sensor.
Electrochemical cross-gas response. Cells designed for SO₂, NO₂, O₃ or CO can respond to each other. A plume that is mostly NO₂ may produce a smaller but entirely believable O₃ reading. Without a separate reference or a known source signature, the two channels cannot be disentangled from the instrument alone.
Humidity effects on particle channels. Light-scattering particle sensors count scattered light; hygroscopic particles grow as RH rises, so the same mass can produce a larger optical signal. Fog droplets are counted as particles. NiuBoL's documented 15–90% RH operating range for the 6-in-1 sensor should be read as without condensation; near dew point, treat PM data as qualitative.
Temperature effects on gas baselines. Electrochemical baselines drift with temperature. The −30°C to 50°C envelope defines where the specification applies, not where the instrument stops producing numbers.
Shared grounding and leakage. Small currents, whether from a gas cell or an ion collector, are vulnerable to ground loops and insulator leakage. A shield earthed at both ends or a moisture film on an insulator produces a bias that tracks weather rather than pollution.
NiuBoL's environmental pollution monitoring material notes that ordinary sensors can have up to 30% error, making emission-source localization difficult, and describes a dual-calibration mechanism with ≤±5% error for an industrial-grade instrument. The useful lesson is that error magnitude depends on calibration discipline, not only on the sensing element. Treat a 30%-class reading as a trend indicator and a calibrated reading as a measurement, and label them differently in the archive.
The following is an illustrative example, not a NiuBoL field dataset. Suppose a roadside node reports PM2.5 rising from 18 to 62 μg/m³ between 05:00 and 07:00, with RH rising from 72% to 94% over the same period, while CO₂ rises from 430 to 610 ppm and NO₂ from 12 to 38 ppb. Two interpretations fit: a genuine morning traffic episode, or a humidity-driven optical bias superimposed on a modest traffic increase.
Three checks separate them. First, look at the PM1/PM10 ratio: a hygroscopic growth event tends to shift the apparent size distribution toward larger optical sizes, while a combustion plume shifts it toward fine particles. Second, compare with a co-located node a few hundred meters away that is not in the same fog pocket; a regional humidity artefact appears at both, a local plume at one. Third, inspect the RH channel against the documented 15–90% RH envelope — at 94% the reading is outside the stated operating range and should be flagged rather than silently archived.
If the NO₂ and CO₂ channels rise with a consistent time offset that matches the site's known traffic peak, the episode is real. If the PM channel rises sharply while the gas channels stay flat and RH crosses 90%, the PM channel is the suspect. No single channel settles it; the combination does.
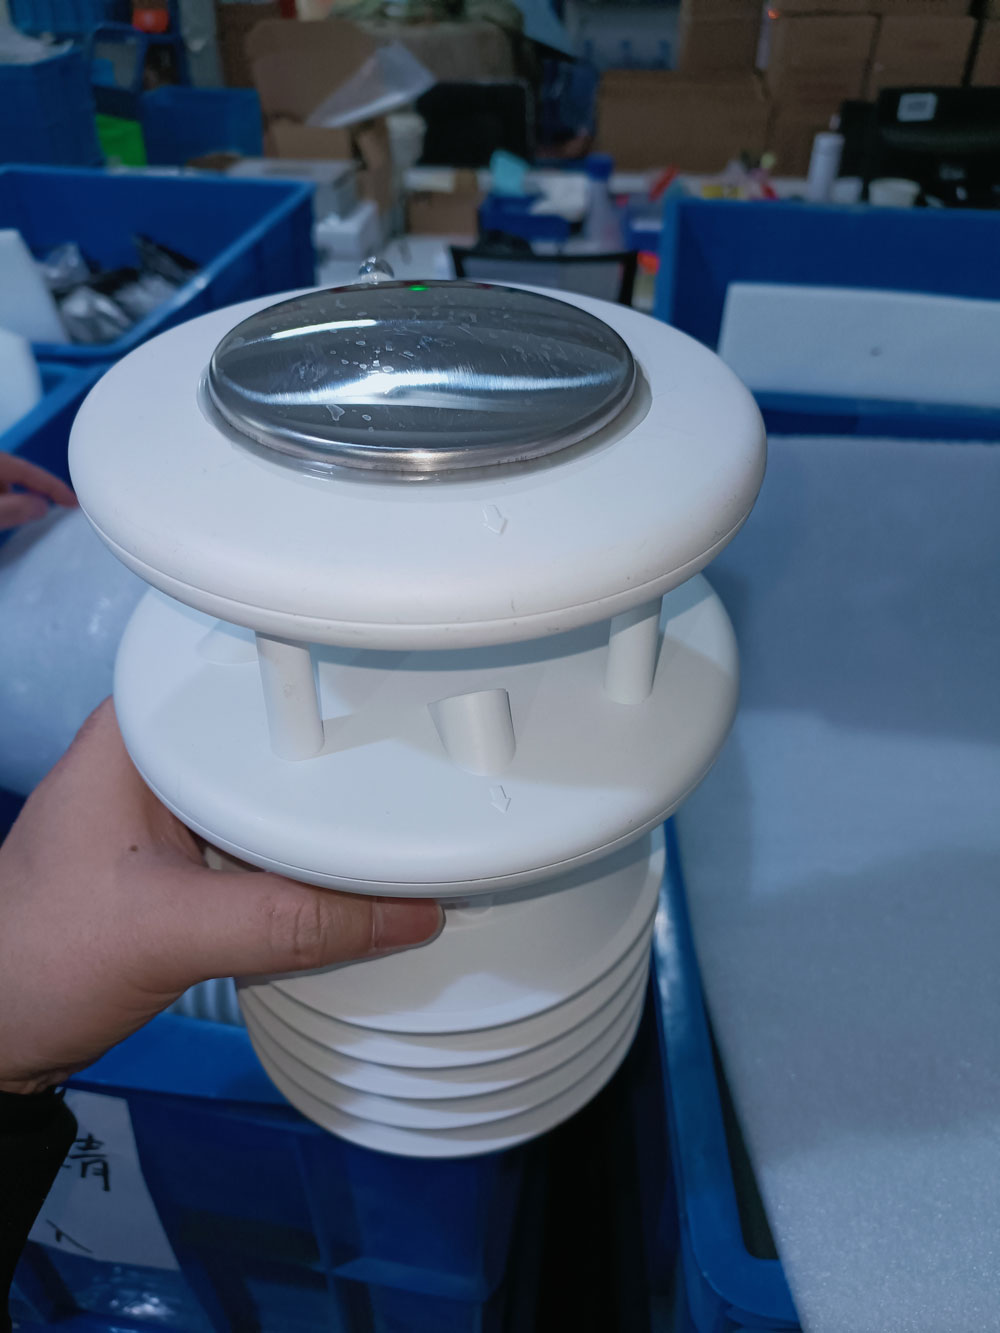
Figure 3. NBL-W-91GUWS 9-in-1 ultrasonic weather station sensor detail.
Treating channels as independent. They share an inlet, supply and compensation path. A common-mode fault can look like a coordinated pollution event.
Quoting a single accuracy for all channels. ±5% FS applies to a stated channel under stated conditions; it does not transfer to every gas cell in the enclosure.
Ignoring the RH envelope. Optical PM readings near condensation are not mass concentrations in the usual sense.
Skipping the raw values. A smoothed engineering value cannot be re-analyzed when a compensation or scaling change is discovered months later.
Confusing solution-level claims with instrument specs. Transmission success rate, alert latency and annual failure rate describe a system; channel range, accuracy and cross-sensitivity describe an instrument.
A multi-parameter node should be commissioned channel by channel, then as a system. A single "all channels online" check cannot detect cross-sensitivity.
Step 1 — raw register audit. For each channel, decode one raw frame by hand and confirm the platform's scaling, byte order and unit against the current datasheet revision. Log the raw word beside the scaled value for the first week.
Step 2 — individual zero and span. Establish the zero with a filtered inlet for optical channels and a reference gas for electrochemical cells. Record the reference material, its concentration, the temperature and the date. Note the accuracy convention per channel: ±5% FS and ±3% of reading are not interchangeable.
Step 3 — single-species cross-check. Present one target species at a time and record the response of every other channel. An NO₂ challenge that produces a visible O₃ response is a measurable cross-sensitivity coefficient, and it belongs in the site record. Without it, a mixed plume cannot be interpreted.
Step 4 — humidity step. Move from a dry to a humid condition within the documented 15–90% RH envelope and observe the particle channels. A PM channel that tracks RH without any change in particle source is showing hygroscopic or condensation sensitivity, not pollution.
Step 5 — common-mode test. Briefly reduce the supply or disconnect the uplink under controlled conditions. Confirm that supply status and sequence numbers make the event visible, and that the collector's breakpoint resume re-sends the buffered block exactly once. A multi-channel drift that appears only during a supply sag is an electrical fault, not an air-quality episode.
Step 6 — co-location. Run beside a trusted reference across several days and different humidity conditions before reporting absolute values.
Store the results per channel, not as one pass/fail line. A node with five healthy channels and one humidity-sensitive particle channel is still useful — provided the affected channel is flagged rather than silently trusted.
Q1. What does a 6-in-1 environmental sensor actually measure?
NiuBoL's version targets PM2.5, CO, CO₂, O₃, SO₂ and NO₂ with optional PM10, at ±5% FS sampling accuracy over −30°C to 50°C and 15–90% RH.
Q2. Can one channel's interference affect another?
Yes. Electrochemical cells can respond to other gases, and all channels share the inlet, supply and often a compensation stage.
Q3. Is PM2.5 data reliable in fog?
Treat it as qualitative. Hygroscopic growth and droplets change the optical signal; the documented RH envelope does not cover condensing conditions.
Q4. What does ±5% FS mean compared with ±5% of reading?
Full scale is fixed by the range; of reading scales with the measured value. Convert both to absolute error at your operating concentration before comparing instruments.
Q5. Should I log raw registers?
Yes. Raw values plus status flags and the datasheet revision are what make a multi-channel dataset auditable.
Q6. How do I tell a real episode from a common-mode fault?
Compare channels against RH, supply status and a co-located node, and check whether the pattern respects the documented operating envelope.
Prev:Fertilizer Injectors: Dosing Ratios, Injection Points and Where Calibration Drifts
Next:Ambient Air Quality Monitors on Site: Siting, Calibration and a Worked Dataset
Related recommendations
Sensors & Weather Stations Catalog
 Agriculture Sensors and Weather Stations Catalog-NiuBoL.pdf
Weather Stations Catalog-NiuBoL.pdf
Agriculture Sensors Catalog-NiuBoL.pdf
Water Quality Sensor Catalog-NiuBoL.pdf
Related products
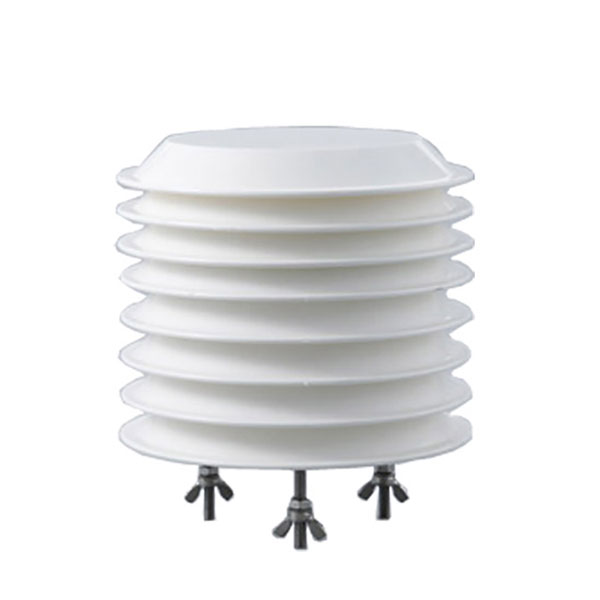 Combined air temperature and relative humidity sensor
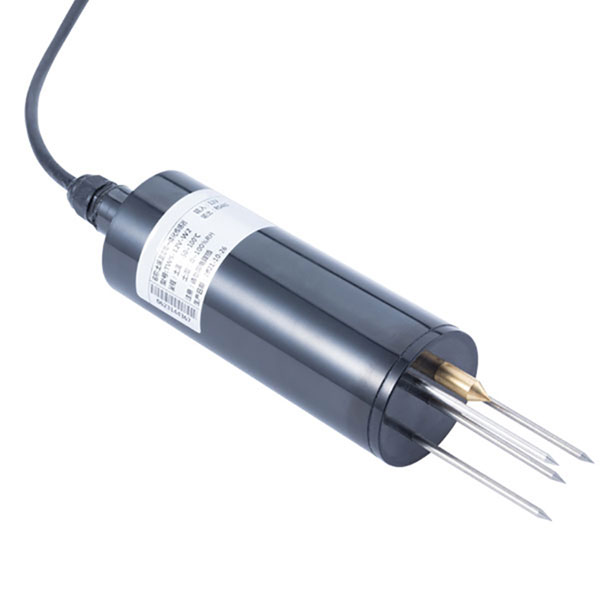 TDR Soil Moisture & Temperature Sensor for irrigation| RS485 |4-20mA| NBL-S-THR
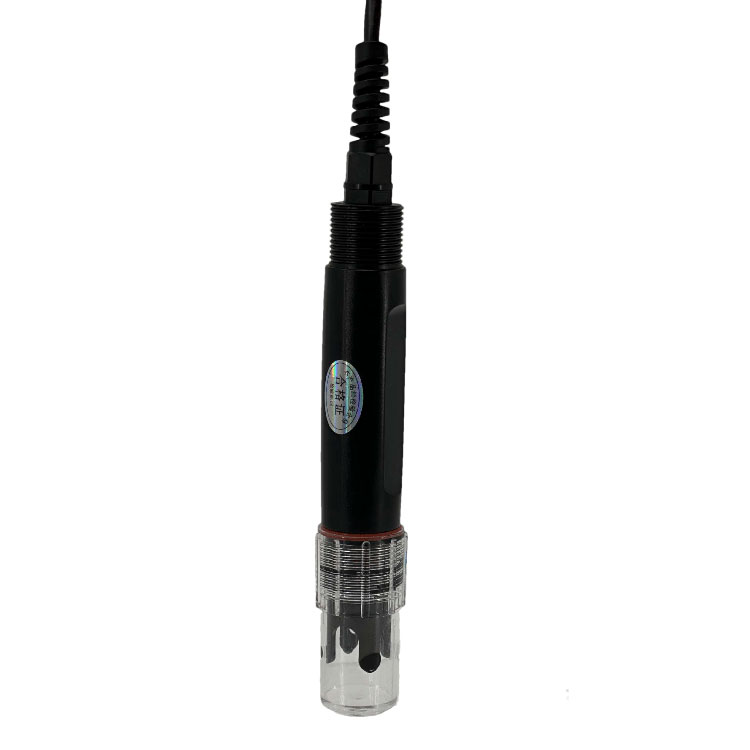 Soil pH sensor RS485 soil Testing instrument soil ph meter for agriculture |NBL-S-PH
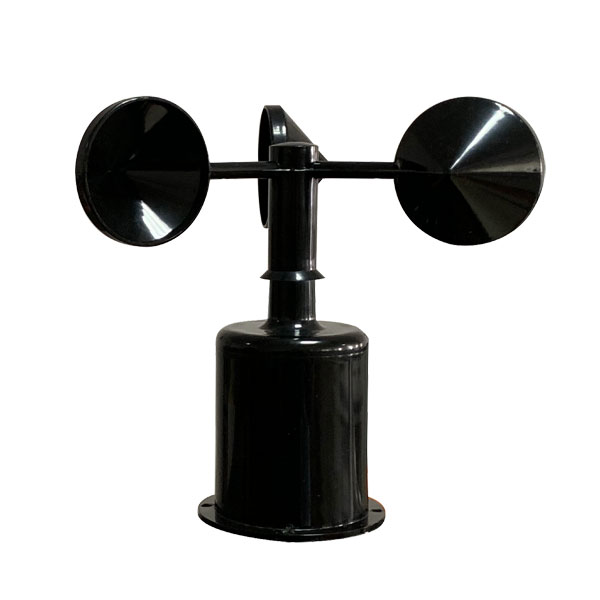 Wind Speed sensor Output Modbus/RS485/Analog/0-5V/4-20mA
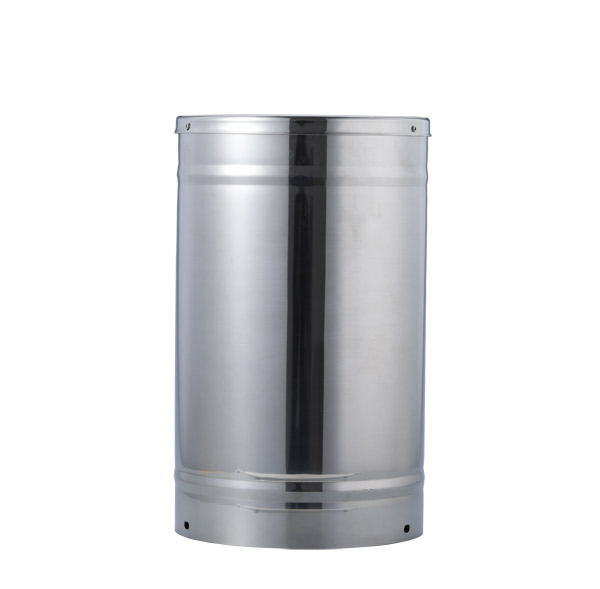 Tipping bucket rain gauge for weather monitoring auto rainfall sensor RS485/Outdoor/stainless steel
 Pyranometer Solar Radiation Sensor 4-20mA/RS485

Screenshot, WhatsApp to identify the QR code
WhatsApp number:+8615367865107
(Click on WhatsApp to copy and add friends)