

— Blogs —
—Products—
 Consumer hotline +8618073152920
WhatsApp:+8615367865107
Address:Room 102, District D, Houhu Industrial Park, Yuelu District, Changsha City, Hunan Province, China
Product knowledge
Time:2026-11-07 15:52:53 Popularity:8
Selecting a monitoring station is a specification exercise followed by a cost exercise, and the two are often done in the wrong order. Buyers compare a list of measured parameters and a unit price, then discover a year later that the site needs a different output interface, a second visit to add a sensor, or a logger that cannot buffer an outage. Total cost of ownership is driven by integration choices and site visits, not by the station's headline parameter count.
Start with the decisions the data will support. A station for irrigation scheduling needs soil moisture at two depths and reliable rainfall. A station for road safety needs wind, visibility and surface state. A campus air quality station needs PM2.5/PM10 and possibly CO₂, but does not need a full radiation suite. Each decision implies a required parameter, an accuracy, a sampling interval and an acceptable downtime. Write those four things down for each channel.

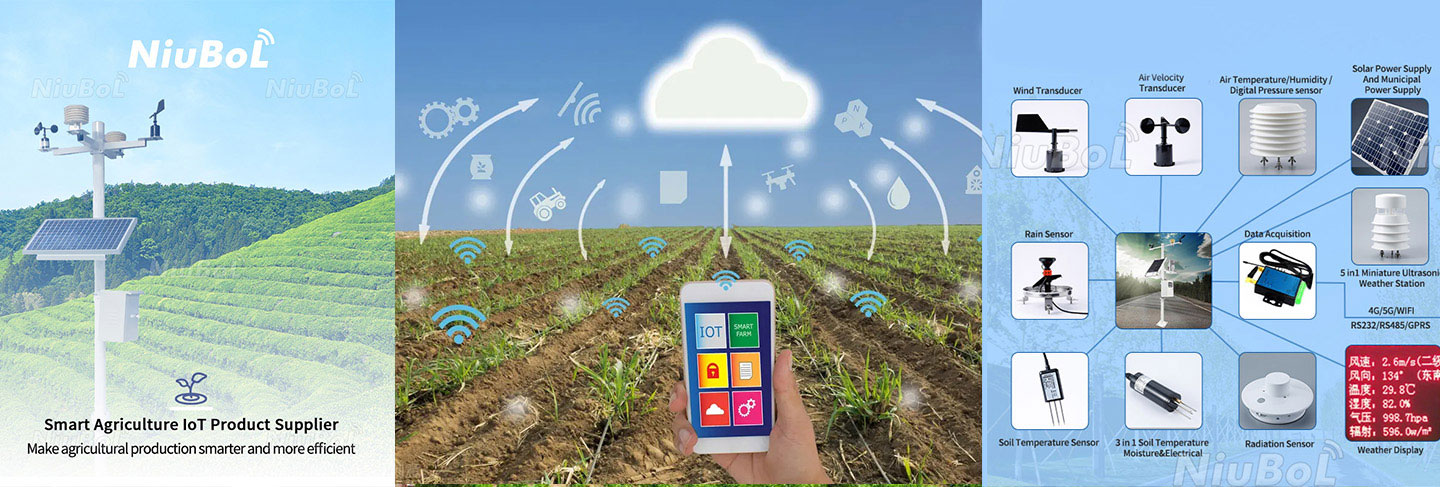
Figure 1. Automatic Weather Station (AWS) Supplier with RS485, 4G & Solar Power — NiuBoL.
Then distinguish the input layer from the communication layer. NiuBoL's technical guidance makes this explicit: at the input layer, distinguish RS485 Modbus RTU from current, voltage and pulse interfaces, and note that RS485 Modbus RTU sensors connect to a compatible data logger, PLC or IoT gateway. Remote communication is normally handled by that logger or gateway rather than by the individual RS485 sensor — individual RS485 sensors do not need their own cellular modem. A station quote that puts a modem on every sensor is either misunderstanding the architecture or charging for hardware you do not need.
Optional channels are where scope creeps. NiuBoL lists UV, noise and PM2.5/PM10 as optional sensors on weather station configurations, customized to the project. Ask whether adding a channel later requires replacing the logger firmware, changing the power budget, or revisiting the mast — all three are common sources of unplanned cost.
| Criterion | What to compare | Why it changes TCO |
|---|---|---|
| Input interfaces | RS485 Modbus RTU vs 4–20 mA / 0–5 V / pulse | Determines logger compatibility and wiring cost |
| Channel accuracy convention | % of reading vs % of full scale | Changes the real error at your operating point |
| Optional sensor path | Add later without replacing logger | Avoids a second hardware purchase |
| Local storage | Capacity and retention at the sampling rate | Determines whether an uplink outage loses data |
| Breakpoint resume | Automatic re-send after reconnect | Avoids manual data recovery visits |
| Remote configuration | Sampling frequency and thresholds over the air | Avoids a site visit for every tuning change |
| Mast and mounting | Wall thickness, diameter, bracket compatibility | Avoids rework and wind-induced bias |
| Power budget | Device draw plus logger plus uplink | Sizes solar panel and battery |
| Ingress protection | Enclosure and connector ratings | Drives cleaning and replacement intervals |
| Diagnostics | Raw values, status flags, supply monitoring | Reduces troubleshooting visits |
NiuBoL's industrial collector specification provides concrete reference points for several of these rows: 16 sensor inputs, 128 GB storage, breakpoint resume transmission, and remote setting of sampling frequency and thresholds. NiuBoL solution-level material also cites a transmission success rate of ≥99.9%, an annual device failure rate of ≤1%, and an exceedance response time of ≤3 seconds for a monitoring solution. Those latter figures describe a complete solution under stated conditions, not a standalone station datasheet; treat them as questions to put to a supplier ("under what network conditions, measured how?") rather than as universal guarantees.
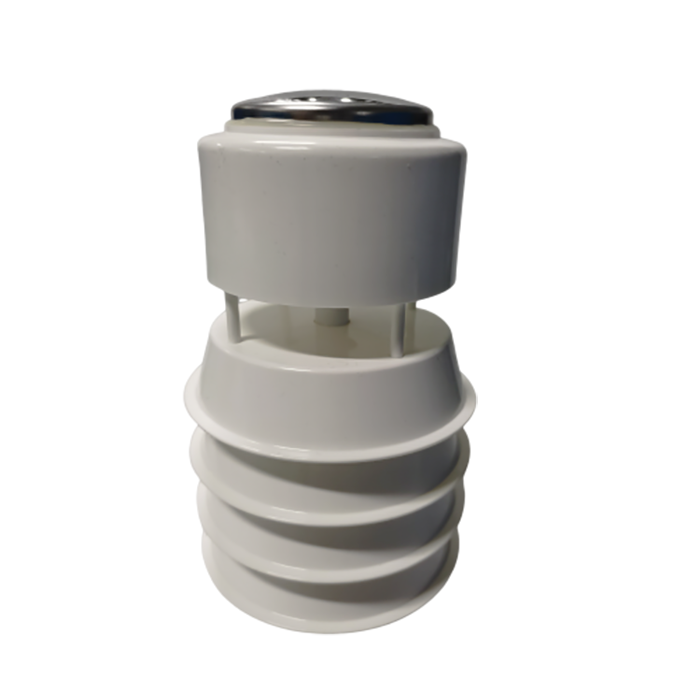
Figure 2. 7-in-1 Ultrasonic Weather Sensor with Rainfall & illuminance — NBL-W-71MUWS.
On the mechanical side, a NiuBoL mast is specified with 2.0 mm galvanized steel wall thickness and a 76 mm support diameter compatible with standard interface devices. Those two numbers determine whether the intended brackets and shields fit and whether the assembly stays plumb under wind load. Cheaper masts with thinner walls save a small amount at purchase and cost a correction visit after the first storm.
| Channel | Range | Stated accuracy |
|---|---|---|
| Humidity | 0–100% RH | ±5% RH |
| Illuminance | 0–200,000 Lux | ±7% |
| CO₂ | 0–2000 ppm | ±(40 ppm + 2% F.S) |
Compare these with a standalone CO₂ sensor such as the NBL-W-CO2, specified at 0–5000 ppm with ±(50 ppm + 3% of reading), 1 ppm resolution, 12–24 VDC and 0.2 W. The ranges, accuracy conventions and power draws differ. An integrated station is not automatically "better" or "worse" — it is a different trade-off between channel count, wiring simplicity and per-channel metrology. A buyer comparing two quotes must convert accuracy to the same basis before deciding.
A station's accuracy is conditional on its site, and site work is rarely in the quote. Budget for:
A station mounted over asphalt against a sunlit wall can be several degrees warmer than a properly sited reference. No calibration removes that offset; only moving the mast does. Paying for survey time at the start is cheaper than paying for a re-siting visit after a season of unusable data.
The following is an illustrative calculation, not a quotation. Consider two offers for a ten-site network over three years.
Offer A costs 1,000 units per station, includes RS485 sensors and a basic logger with no local storage, and needs one technician visit per site per year for configuration changes (150 units per visit). Offer B costs 1,250 units per station, includes RS485 sensors and a collector with 128 GB storage, breakpoint resume and remote sampling configuration, and needs one visit per site per year only for physical cleaning.
Purchase difference: (1,250 − 1,000) × 10 = 2,500 units. Configuration visits avoided: assume two per site per year in Offer A because thresholds are tuned seasonally, against zero in Offer B. That is 2 × 10 × 3 × 150 = 9,000 units saved. Add data loss: if Offer A loses two hours of records during each of six uplink outages per year across the network and each recovery requires a manual extract at 100 units per event, that is 6 × 3 × 100 = 1,800 units. Offer B's breakpoint resume removes both. Net three-year advantage for Offer B: roughly 8,300 units, or about 830 per site per year, against a 250-unit purchase premium per station.
The arithmetic is deliberately simple. Its purpose is to show which inputs dominate: visit count and data recovery, not the sensor price. Substitute your own labor rate and outage frequency, and the ranking can flip — which is exactly why the calculation should be done before the purchase order, not after.
Buying channel count instead of channel quality. Six inadequately specified channels produce six columns of data nobody trusts.

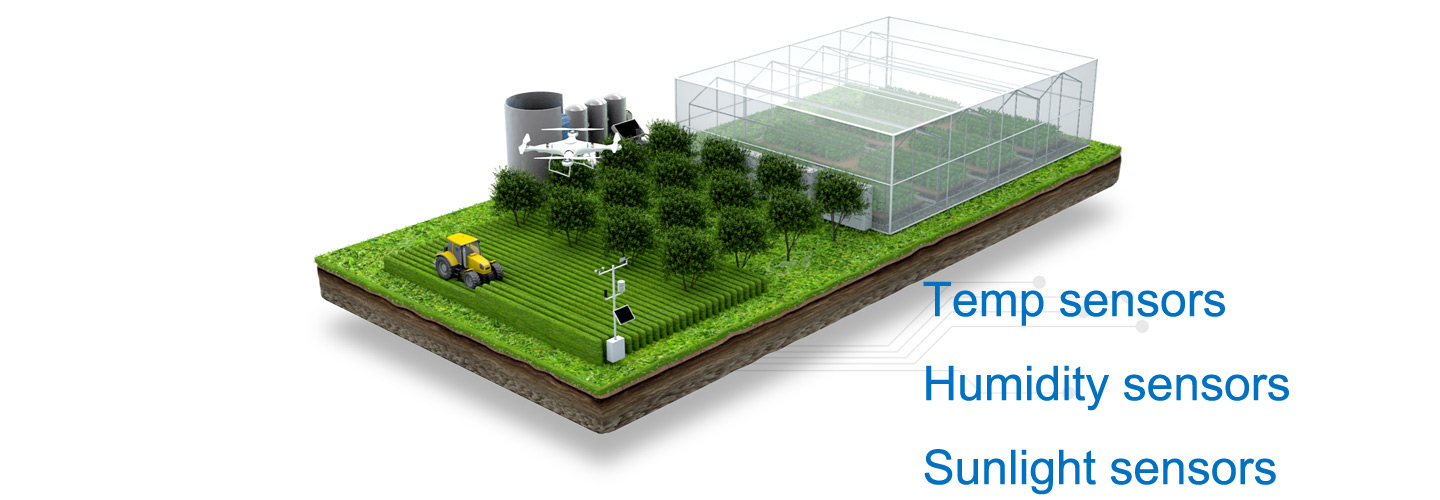
Figure 3. Portable Tripods Weather Station Stands.
Mixing accuracy conventions. ±(40 ppm + 2% F.S) and ±(50 ppm + 3% of reading) are not comparable without conversion at the operating concentration.
Assuming every sensor needs a modem. Remote communication belongs at the logger or gateway. Paying for ten modems when one gateway suffices inflates both hardware and SIM costs.
Ignoring storage and resume. A logger without local buffering converts a routine cellular outage into a permanent gap.
Undersizing power. Measure the actual draw of sensors, logger and uplink, then size the supply. NiuBoL's NBL-W-CO2 at 0.2 W and 12–24 VDC is an example of the device-level figure needed.
No path to add a channel. Confirm that optional sensors can be added without replacing the logger or rewiring the mast.
Ten questions, asked before the purchase order, reveal more about three-year cost than the quoted unit price.
Ask the supplier to answer in writing and attach the answers to the acceptance record. The point is not to catch anyone out: it is to make the two offers comparable on the same basis. When one quotation is 25% cheaper and silent on storage, resume, remote configuration and diagnostics, the worked TCO calculation in this article usually explains where the difference will be paid.
Q1. Should I choose an all-in-one station or separate RS485 sensors?
All-in-one units reduce wiring and commissioning; separate sensors allow per-channel replacement and independent siting. Decide from the required accuracy per channel and the maintenance model, not from the parameter count.
Q2. Does each sensor need its own cellular connection?
No. Remote communication is normally handled by the data logger or gateway; individual RS485 sensors do not need their own modem.
Q3. What does breakpoint resume actually save?
It preserves the series across an uplink outage and avoids a manual data recovery visit. Test it by disconnecting the uplink during commissioning.
Q4. How do I compare two accuracy figures quoted differently?
Convert both to absolute error at the concentration you actually measure, and note whether each is of reading or of full scale.
Q5. Which siting costs are usually missing from a quote?
Survey, foundation, trenching, power sizing, uplink verification and access for cleaning and zero checks.
Q6. What should be in the acceptance record?
Channel list, interface types, accuracy conventions, local storage capacity, resume test result, supply measurements at each device, mast dimensions and the datasheet revision.
Prev:How a Sensor Turns a Physical Change Into a Signal: Principles, Specs and Error Sources
Next:Data Logging and Telemetry for Environmental Monitoring: Protocols, Gaps and Recovery
Related recommendations
Sensors & Weather Stations Catalog
 Agriculture Sensors and Weather Stations Catalog-NiuBoL.pdf
Weather Stations Catalog-NiuBoL.pdf
Agriculture Sensors Catalog-NiuBoL.pdf
Water Quality Sensor Catalog-NiuBoL.pdf
Related products
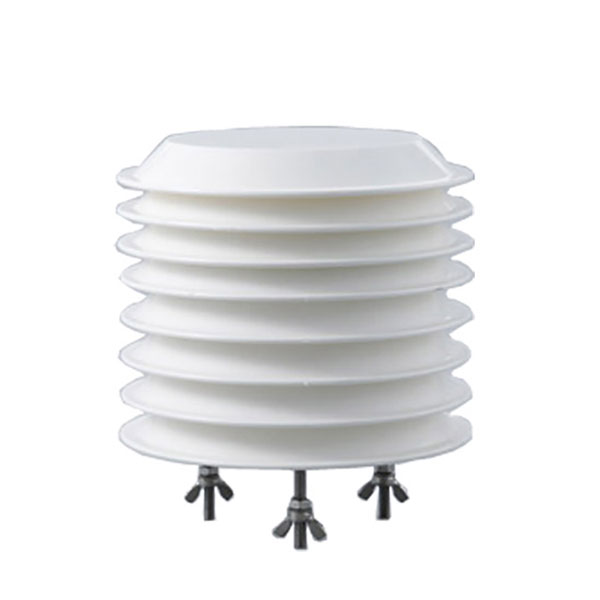 Combined air temperature and relative humidity sensor
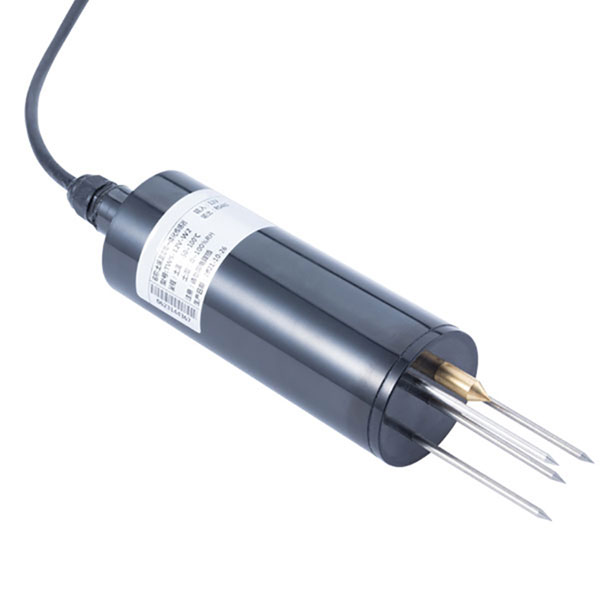 TDR Soil Moisture & Temperature Sensor for irrigation| RS485 |4-20mA| NBL-S-THR
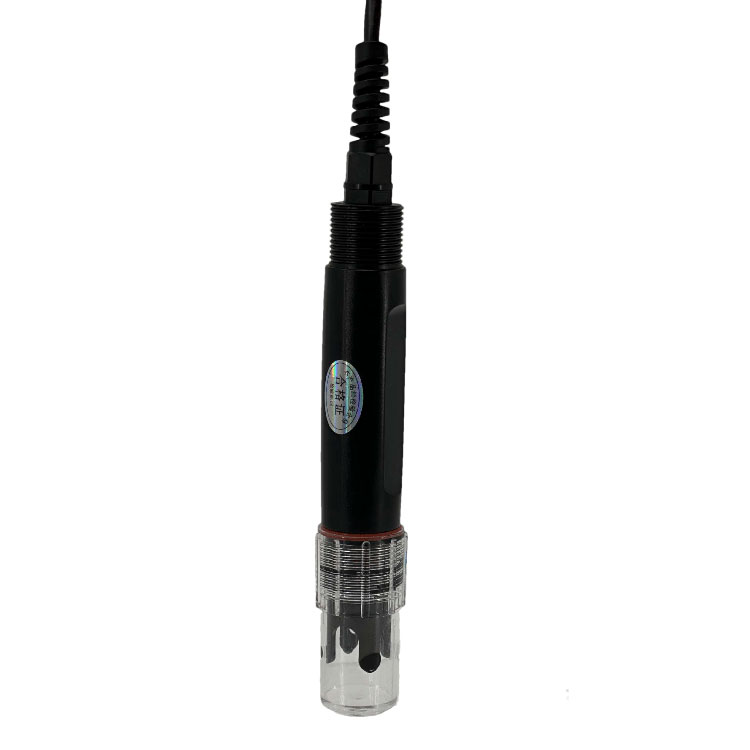 Soil pH sensor RS485 soil Testing instrument soil ph meter for agriculture |NBL-S-PH
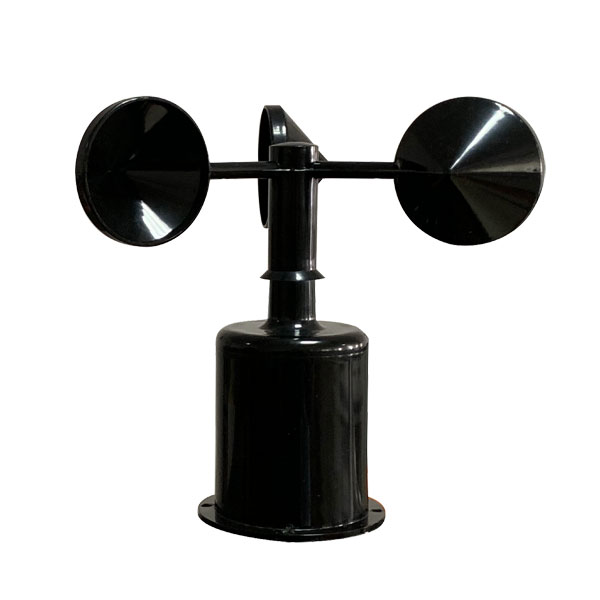 Wind Speed sensor Output Modbus/RS485/Analog/0-5V/4-20mA
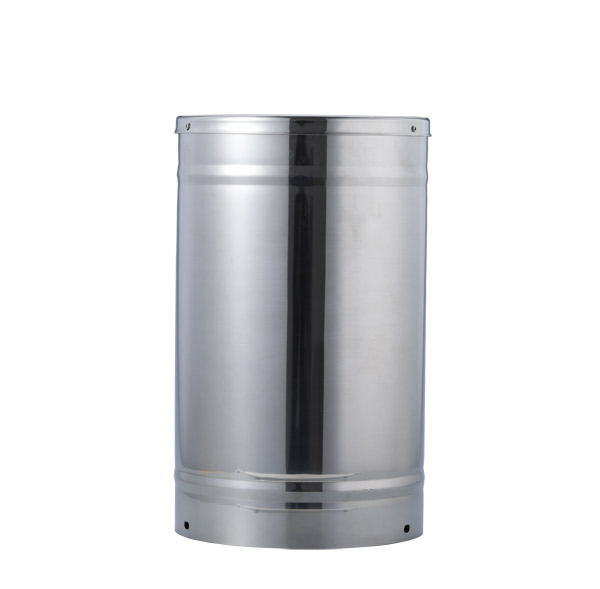 Tipping bucket rain gauge for weather monitoring auto rainfall sensor RS485/Outdoor/stainless steel
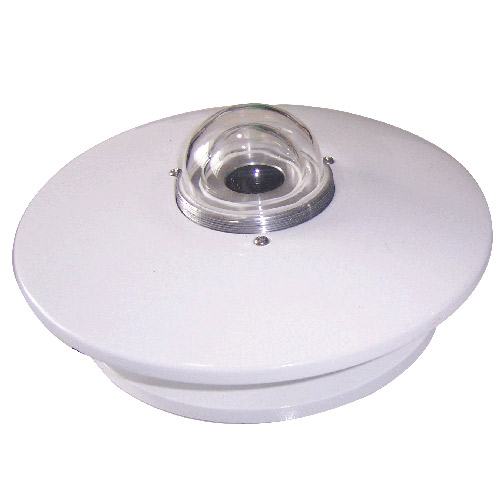 Pyranometer Solar Radiation Sensor 4-20mA/RS485


Screenshot, WhatsApp to identify the QR code
WhatsApp number:+8615367865107
(Click on WhatsApp to copy and add friends)