

— Blogs —
—Products—
 Consumer hotline +8618073152920
WhatsApp:+8615367865107
Address:Room 102, District D, Houhu Industrial Park, Yuelu District, Changsha City, Hunan Province, China
Product knowledge
Time:2026-11-07 15:53:14 Popularity:8
A fertilizer injector introduces a concentrated nutrient solution into an irrigation line at a controlled ratio, so the dose delivered to the crop is the product of the injection ratio, the stock solution concentration and the irrigation volume. Three things can go wrong independently: the ratio can drift, the stock concentration can change, and the injection point can be positioned where the dose never reaches the intended zone. Measuring downstream EC or pH closes the loop; trusting the dial does not.
Scope note. The numeric ratio and equipment values in this article are general engineering reference values used to explain the calculation, not NiuBoL product specifications. Confirm them against the injector nameplate and the current datasheet of any monitoring instrument before publishing a specification table.
Fixed-ratio injectors are commonly described by a proportional setting such as 1:100 or 1:200, meaning one part stock solution drawn into a stated number of parts of carrier water. Venturi-type devices create a pressure differential that draws the concentrate; piston or diaphragm pumps meter it positively. Whatever the mechanism, the delivered concentration at the emitter is:

Figure 1. Water and fertilizer machine (1).
C_delivered ≈ C_stock × injection fraction × mixing uniformity
where the injection fraction is the inverse of the ratio (0.01 for 1:100) and mixing uniformity accounts for incomplete blending and travel-time differences along the line. That last term is why two emitters on the same lateral can deliver different doses even when the pump is perfectly calibrated.
| Quantity | Typical reference range | How it is confirmed |
|---|---|---|
| Fixed injection ratio | 1:50 to 1:500, model-dependent | Injector nameplate and a measured draw test |
| Stock solution EC | strongly formulation-dependent | Bench EC meter at a recorded temperature |
| Irrigation line EC downstream of injection | monitored continuously | Inline EC sensor with temperature compensation |
| Soil pH measurement range | 0–14 pH | NiuBoL soil pH sensor datasheet |
| Soil EC measurement range | 0–15 mS/cm, 0.01 mS/cm resolution | NiuBoL soil EC sensor datasheet |
| Salinity measurement range | 0–8000 mg/L, 1 mg/L resolution | NiuBoL soil EC sensor datasheet |
| EC temperature compensation | 0–50°C | NBL-S-TMC documentation |
| Typical sensor outputs | RS485 Modbus, 4–20 mA, 0–5 V | NiuBoL sensor datasheet |
NiuBoL's combined NBL-S-TMC soil probe measures temperature, moisture and EC in an IP68 housing over RS485 Modbus RTU, with EC temperature compensation over 0–50°C. Its documentation notes that above roughly 20% volumetric water content, dissolved ions form a more continuous conductive pathway and EC becomes more representative of soluble salt content — while explicitly stating that 20% is a measurement reference rather than a universal irrigation threshold. That is exactly the distinction that matters for fertigation verification: EC is a measurement of what arrived, not a threshold for when to irrigate.
Place the injection point upstream of the filtration and distribution network, but far enough upstream that the concentrate is fully mixed before the first emitter takes a branch. In practice this means a straight run with a mixing length, a check valve to prevent backflow into the stock tank, and a sampling port downstream where the delivered EC can be measured.
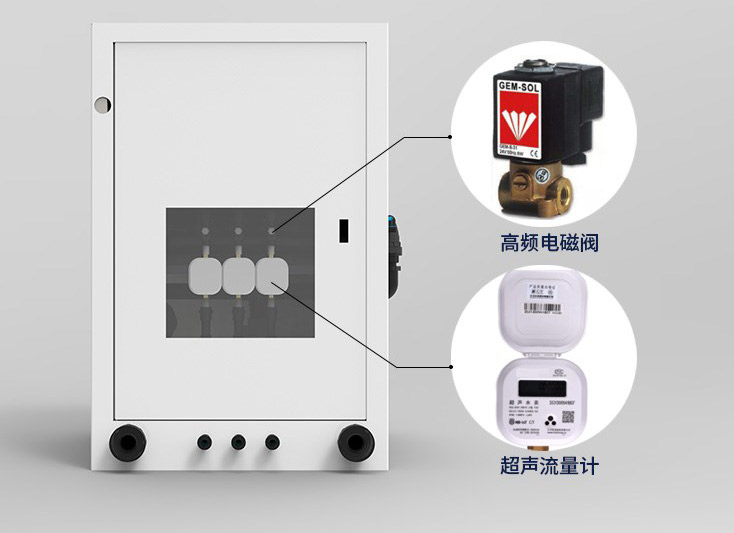
Figure 2. Intelligent water and fertilizer integration.
Three placement errors recur:
Injecting downstream of a branch. Emitters on the upstream branch receive no nutrient at all, while the downstream branch receives the full dose. The field looks uniformly irrigated and unevenly fed.
Injecting immediately before a short lateral. Incomplete mixing produces a concentration front: the first emitters see a slug of concentrate and the last ones see diluted solution. A downstream sampling port at the far end of the lateral, not near the injector, is what reveals this.
No backflow protection. A pressure drop can pull irrigation water into the stock tank or push concentrate into the supply line when the pump is off. A check valve and a clearly labelled isolation procedure are part of the installation, not optional extras.
For verification, sample at three points: the stock tank, immediately downstream of the injector, and at the far end of the representative lateral. Compare all three against the same EC meter at the same temperature. If the near and far readings differ by more than the sensor's stated uncertainty, the problem is mixing or placement, not dosing.
The following is an illustrative calculation using general engineering assumptions, not a NiuBoL project dataset. Assume a stock solution with an EC of 20.0 mS/cm measured at 25°C, an injector set to 1:100 (injection fraction 0.01), and a carrier water EC of 0.4 mS/cm. Ignoring nonlinear mixing effects, the expected downstream EC is:
0.4 + (20.0 × 0.01) = 0.60 mS/cm
Now suppose the downstream inline sensor reads 0.48 mS/cm. Solving backwards, the realized injection fraction is (0.48 − 0.4) / 20.0 = 0.004, or an effective ratio of about 1:250 — the injector is delivering 40% of the intended dose. Plausible causes include a partially blocked suction line, a worn seal, a stock tank that was topped up with water rather than replenished with concentrate, or a pressure differential below the Venturi's design range.
A second check separates the instrument from the process. Measure the same downstream sample with a bench EC meter at the same temperature. If the bench meter agrees with the inline sensor, the process is at fault; if it disagrees, check the inline sensor's calibration, temperature compensation state and fouling. Because EC is temperature compensated over 0–50°C on the combined probe, a reading taken outside that window should not be treated as compensated.
At the soil end, a worked interpretation: if a soil EC channel rises from 1.20 to 1.44 mS/cm after an irrigation event that included fertigation, that is a 20% increase. If VWC also rose and temperature stayed within the compensation window, the increase is consistent with nutrient arriving at the root zone. If VWC fell while EC rose, the more likely explanation is concentration through drying, not dosing. Logging VWC, temperature and EC together is what makes that call possible.
Suction-side restriction. A partially blocked strainer or a kinked suction tube reduces the drawn volume. The injector still sounds normal and the dial is unchanged.
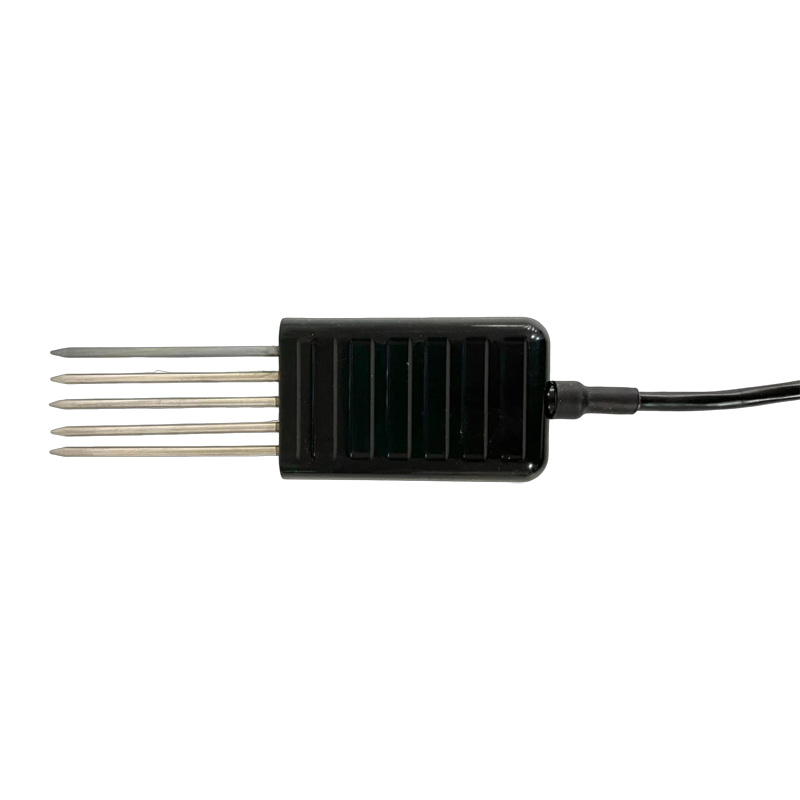
Figure 3. 7-in-1 Soil Sensor RS485 Modbus for pH, EC & NPK — NBL-S-TMC-7.
Seal and diaphragm wear. Positive-displacement pumps lose volumetric efficiency gradually. The drift is slow enough that a daily chart looks stable; a monthly draw test is what catches it.
Stock concentration changes. Evaporation, precipitation, incomplete mixing after topping up, and temperature all change the stock EC. A "1:100" setting is meaningless without a measured stock concentration.
Pressure differential outside the design range. Venturi devices draw according to the pressure drop they were designed for. Changes to pump speed, filter loading or the number of open valves shift the ratio.
Sensor fouling and calibration drift. NiuBoL's guidance on online pH sensors covers cleaning and calibration in dosing applications, and the same discipline applies to EC: a biofilm or scale layer on the cell changes the cell constant. Rinse, inspect and re-check against a reference solution on a schedule tied to observed drift, not to a fixed calendar date.
Temperature outside the compensated range. Conductivity is strongly temperature dependent. Outside the stated 0–50°C compensation window on the combined soil probe, label the value as uncompensated.
Confusing EC with nutrient identity. EC responds to all dissolved ions, not specifically to nitrate or potassium. A high EC can indicate over-dosing, saline irrigation water, or a pH adjustment — never a specific nutrient without a separate analysis.
For nutrient identity, NiuBoL publishes a soil nutrient analyzer specification that reports N/P/K determination times (one soil sample in about 20 minutes; eight simultaneous samples in about one hour; three fertilizer samples in about 1.5 hours), a light source life of 100,000 hours, IP65 enclosure, USB/Ethernet interfaces and U-disk export, with a stated relative error of ±5% for salinity/moisture and <0.5% moisture error. That is a laboratory-style instrument for verifying what is in the stock or the soil — not an inline injector, and not a substitute for continuous EC monitoring. Use the two for different questions.
Fertigation systems fail most often when nobody is injecting: a pressure drop pulls irrigation water into the stock tank, or concentrate migrates into the supply line with the pump off. A short written procedure prevents both.
Hardware. Fit a check valve on the suction line, an isolation valve on the stock tank, and a clearly labelled sampling port downstream of the injector and at the far end of a representative lateral. Confirm the injector's design pressure differential from its nameplate — Venturi devices draw according to the pressure drop they were built for, not according to the dial setting.
Normal shutdown. Close the stock isolation valve first, let the injector run on clean carrier water until the downstream EC returns to the carrier baseline, then stop the pump. That flush step is what prevents concentrate from sitting in the lateral and being delivered as an unintended slug at the next start-up. Record the flush duration from your own measured EC recovery rather than from a fixed timer.
Unexpected stop. If power or pressure is lost mid-injection, isolate the stock tank, do not restart against a closed downstream valve, and sample the far end before resuming. Compare that sample with the stock EC at the same temperature. If the near and far readings disagree by more than the sensor's stated uncertainty, the line still contains unmixed concentrate.
Verification. Log VWC, soil temperature and EC together at the root zone. Conductivity is temperature compensated over a stated 0–50°C window on combined soil probes, so a reading outside that window should be labelled uncompensated. Above roughly 20% VWC, dissolved ions form a more continuous conductive pathway and EC becomes more representative of soluble salt content — but NiuBoL's documentation explicitly calls 20% a measurement reference, not a dosing or irrigation threshold.
Keep the nameplate ratio, the measured draw test, the stock EC and the datasheet revision in one commissioning sheet. When the delivered dose is questioned, that sheet is what separates a dosing fault from a mixing fault.
Q1. What does a 1:100 injection ratio mean?
One part stock solution to 100 parts carrier water, an injection fraction of 0.01. Confirm the realized ratio by a timed draw test rather than trusting the dial.
Q2. Why is downstream EC lower than calculated?
Most often a restricted suction line, worn seal, diluted stock, or a pressure differential below the injector's design range. Check the near/far readings to separate dosing from mixing.
Q3. Can EC tell me which nutrient is overdosed?
No. EC responds to total dissolved ions. Nutrient identity requires a separate analysis, such as a soil N/P/K instrument.
Q4. Is 20% VWC a fertigation trigger?
No. NiuBoL's documentation describes ~20% as the point above which EC readings become more representative of soluble salts — a measurement reference, not an irrigation or dosing threshold.
Q5. Where should the verification sample be taken?
At the far end of a representative lateral, plus the stock tank and a point immediately downstream of the injector, all measured at the same temperature.
Q6. How often should the injector be recalibrated?
At commissioning, after any change to stock formulation, filter or pump settings, and at an interval derived from your own draw-test drift.
Prev:Drip Irrigation vs Sprinkler and Surface Systems: Accuracy, Cost and Maintenance
Next:Environmental Monitoring Sensors: Parameter Choices, Signal Chains and Cross-Sensitivity
Related recommendations
Sensors & Weather Stations Catalog
 Agriculture Sensors and Weather Stations Catalog-NiuBoL.pdf
Weather Stations Catalog-NiuBoL.pdf
Agriculture Sensors Catalog-NiuBoL.pdf
Water Quality Sensor Catalog-NiuBoL.pdf
Related products
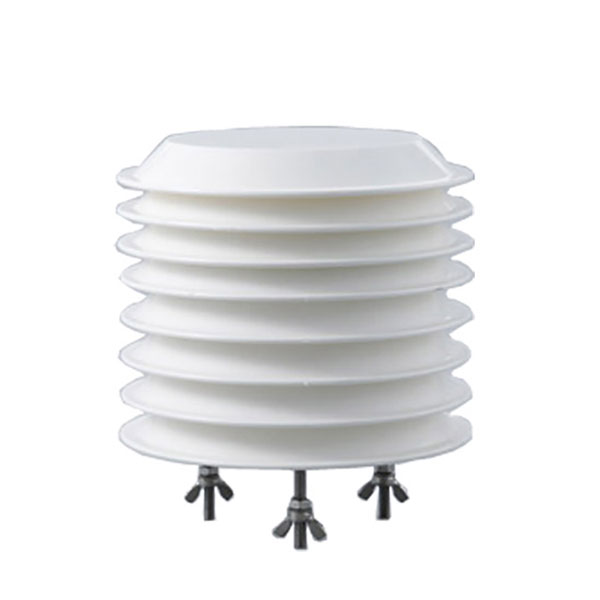 Combined air temperature and relative humidity sensor
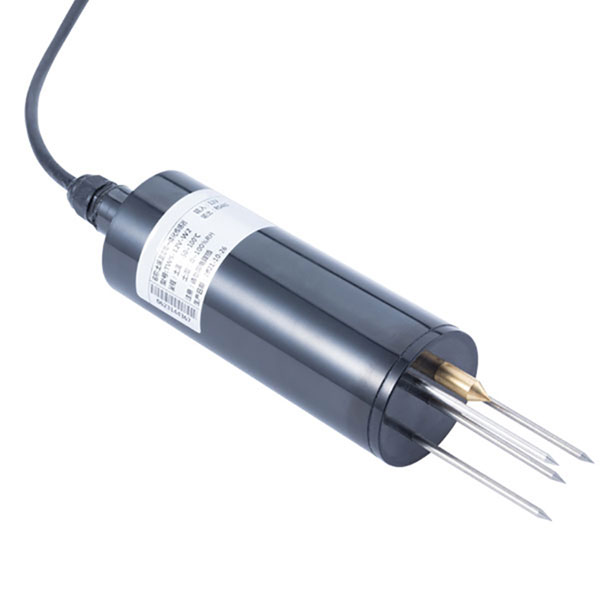 TDR Soil Moisture & Temperature Sensor for irrigation| RS485 |4-20mA| NBL-S-THR
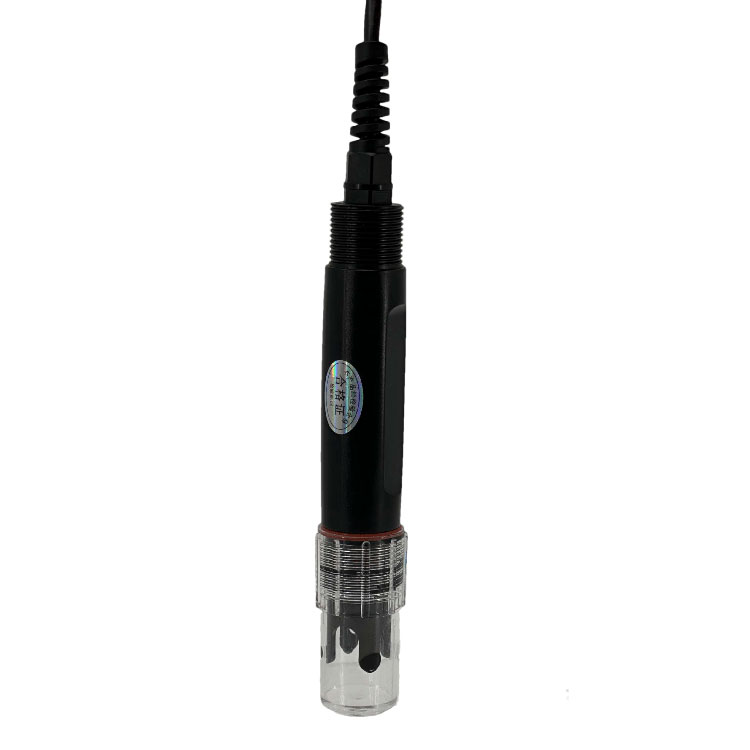 Soil pH sensor RS485 soil Testing instrument soil ph meter for agriculture |NBL-S-PH
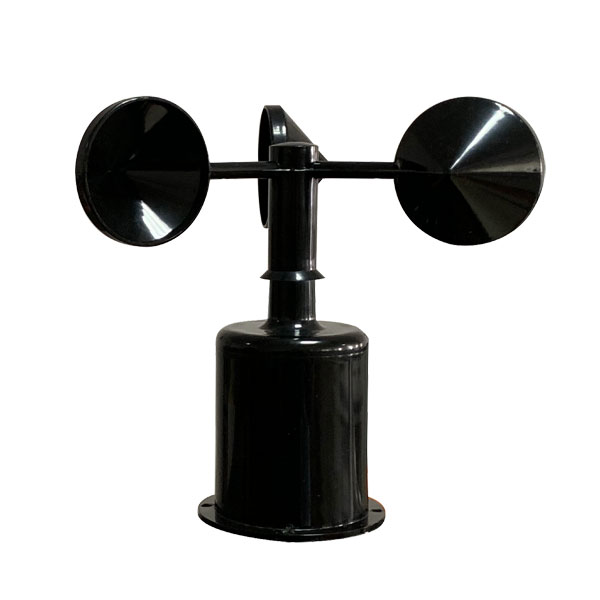 Wind Speed sensor Output Modbus/RS485/Analog/0-5V/4-20mA
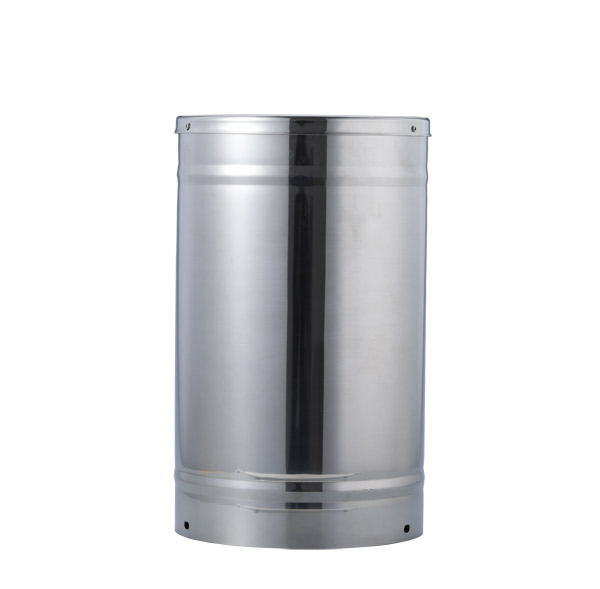 Tipping bucket rain gauge for weather monitoring auto rainfall sensor RS485/Outdoor/stainless steel
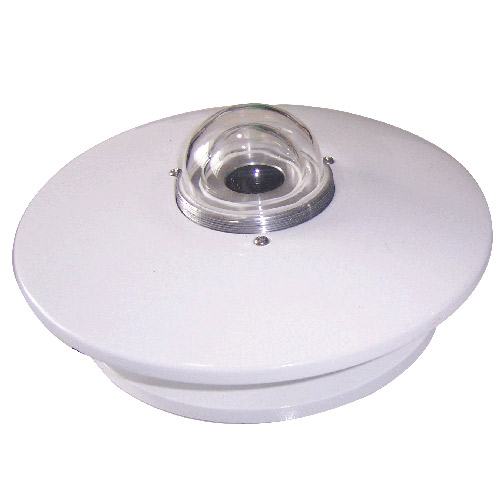 Pyranometer Solar Radiation Sensor 4-20mA/RS485


Screenshot, WhatsApp to identify the QR code
WhatsApp number:+8615367865107
(Click on WhatsApp to copy and add friends)