

— Blogs —
—Products—
 Consumer hotline +8618073152920
WhatsApp:+8615367865107
Address:Room 102, District D, Houhu Industrial Park, Yuelu District, Changsha City, Hunan Province, China
Product knowledge
Time:2026-11-07 15:53:07 Popularity:8
Drip irrigation delivers water directly to the root zone at low flow and low pressure, while sprinkler systems distribute it through the air and surface systems wet the whole field by gravity. The practical difference is not just water saving: it is where the measurement uncertainty lives. Drip systems concentrate risk at the emitter, sprinkler systems at wind and distribution uniformity, and surface systems at infiltration variability. Choosing between them requires a water budget and a maintenance plan, not a percentage claimed in a brochure.
A drip system controls the volume delivered per emitter per hour, typically expressed in litres per hour, and the duration of the irrigation event. Uniformity depends on emitter manufacturing variation, pressure compensation, filtration and clogging. Because only a fraction of the soil surface is wetted, the rest of the field stays dry — which is efficient but means a sensor placed outside the wetted bulb will report almost no response to irrigation.
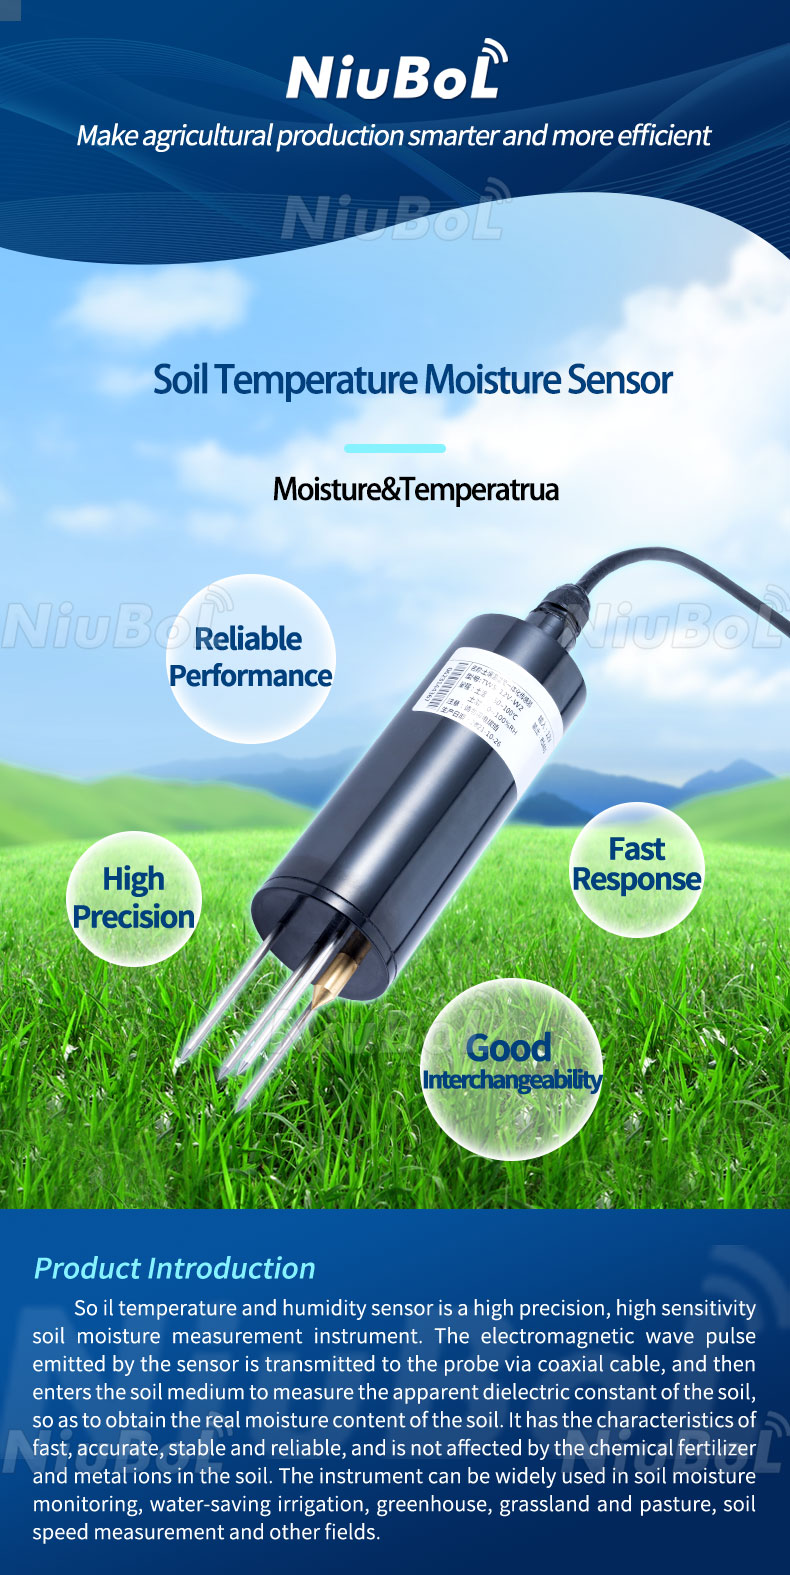
Figure 1. Soil moisture sensor used in intelligent drip irrigation.
A sprinkler system controls application rate over an area, expressed in mm/h, and uniformity is dominated by nozzle spacing, pressure variation and wind. Evaporation and drift losses occur before water reaches the soil. A surface system controls the depth of water applied to a basin or furrow, and the dominant uncertainty is how evenly that water infiltrates across the field.
These differences determine what "accuracy" means. For drip, it is emitter discharge uniformity and the absence of blockages. For sprinkler, it is distribution uniformity under the wind conditions that actually occur. For surface, it is infiltration uniformity. A single accuracy percentage cannot describe all three.
| Criterion | Drip | Sprinkler | Surface / furrow |
|---|---|---|---|
| Delivery point | Root zone, localized bulb | Whole field through the air | Whole field by gravity |
| Main loss path | Clogging, pressure variation, bypass flow | Wind drift, evaporation, canopy interception | Deep percolation, runoff, uneven infiltration |
| Uniformity driver | Emitter CV and filtration | Nozzle spacing and pressure | Soil intake rate variability |
| Energy | Low pressure; pumping plus filtration | Higher pressure for atomization | Lowest pumping, highest labor |
| Fertigation | Straightforward, dose at the emitter | Possible but foliar contact and drift | Poor dose control |
| Measurement challenge | Sensor must sit in the wetted bulb | Sensor sees a spatially averaged application | Sensor sees a highly variable infiltration |
| Maintenance focus | Filter, emitter, line flushing | Nozzles, pressure regulation, leaks | Leveling, furrow condition, tailwater |
| Failure visibility | A blocked emitter may not change the flow meter much | Visible pattern gaps | Visible ponding or dry headlands |
No universal water-saving percentage is quoted here deliberately. The saving depends on the baseline system, climate, soil and whether the schedule is actually adjusted from measured data. A drip system running a fixed timer can use as much water as a well-managed sprinkler system; measurement and control, not the hardware alone, produce the saving.
For drip, place probes inside the wetted bulb at two depths, and record the horizontal distance from the emitter as a commissioning value. A shallow probe outside the bulb will show a slow, damped response that looks like a sensor fault.
NiuBoL's NBL-S-THR soil moisture/temperature sensor is specified at 0–100% moisture, −50 to 100°C, DC 12–24 V, 0.1% and 0.1°C resolution, ±3% moisture and ±0.5°C temperature accuracy. Combined probes such as NBL-S-TMC add electrical conductivity in one IP68 housing with RS485 Modbus RTU and built-in EC temperature compensation over 0–50°C. For a fertigated drip block, EC is the channel that tells you whether the injected dose actually arrived at the root zone.
One integration constraint is easy to overlook: an RS485 soil sensor does not supply the power or switching function needed to operate a solenoid. The measurement chain and the actuation chain are separate. A controller with a rated output drives the valve; the sensor only reports the state. NiuBoL offers RS485 Modbus, 4–20 mA and 0–5 V variants on several soil sensors, and soil pH sensors are documented at 0–14 pH with those output options — useful for monitoring the nutrient solution, not for switching valves.
NiuBoL's documentation also notes that soil moisture sensors can be integrated into automated irrigation systems to trigger events based on preset moisture thresholds, and that avoiding overwatering reduces water waste. The important word is preset: the threshold must come from the site's own soil and crop, not from a generic number. A separate NiuBoL page states that above roughly 20% VWC, dissolved ions form a more continuous conductive pathway and EC readings become more representative of soluble salt content, while explicitly cautioning that 20% is a measurement reference, not a universal irrigation threshold.
The following is an illustrative calculation using engineering assumptions, not a NiuBoL project dataset. Consider a one-hectare block with a crop evapotranspiration demand of 5.0 mm/day.
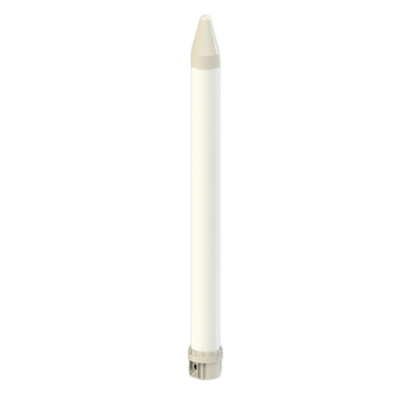
Figure 2. Multi depth soil moisture sensor for water-saving irrigation, flower horticulture, greenhouse, smart….
The difference between drip and surface is 27.7 m³/day, or about 2,770 m³ over a 100-day season. That number is only as defensible as the efficiency assumptions. Measure them: weigh or meter the delivered volume, then check the soil response at two depths. If the deep probe rises sharply while the shallow probe barely moves, water is bypassing the root zone through a preferential path, and the effective efficiency is lower than the assumed 0.90 regardless of what the flow meter says.
A second, cheaper check is the pulse test used in sensor commissioning: irrigate in two short pulses separated by a redistribution pause. If the shallow probe responds to the first pulse and the deep probe to the second, infiltration is behaving as expected. If only the deep probe moves, investigate the cable trench, cracks or emitter placement before changing the schedule.
Drip: filtration is the system's life insurance. Budget for filter cleaning, periodic line flushing, emitter inspection and pressure checks at the far end of the laterals. A partially blocked emitter does not always reduce total flow enough to trigger an alarm, so a flow meter alone will not catch it — spatial sensor data will.
Sprinkler: nozzle wear changes droplet size and distribution uniformity long before a nozzle fails. Budget for periodic catch-can tests under representative wind conditions and pressure checks across the block.
Surface: leveling and furrow condition drift over a season. Labor is the dominant recurring cost, and tailwater management can dominate water loss.
Across all three, the measurement system has its own lifecycle: verify supply voltage at the probe under load, check that RS485 A/B is twisted pair with a single-point shield earth, run gravimetric checks of the moisture calibration on the site's own soil at two moisture levels, and keep the raw values and datasheet revision with the site record. A ±3% sensor in a poorly installed hole can be wrong by far more than 3%.
Drip in saline or hard water. Emitter clogging and salt accumulation at the edge of the wetted bulb are predictable. EC monitoring and a leaching plan are part of the design, not an afterthought.
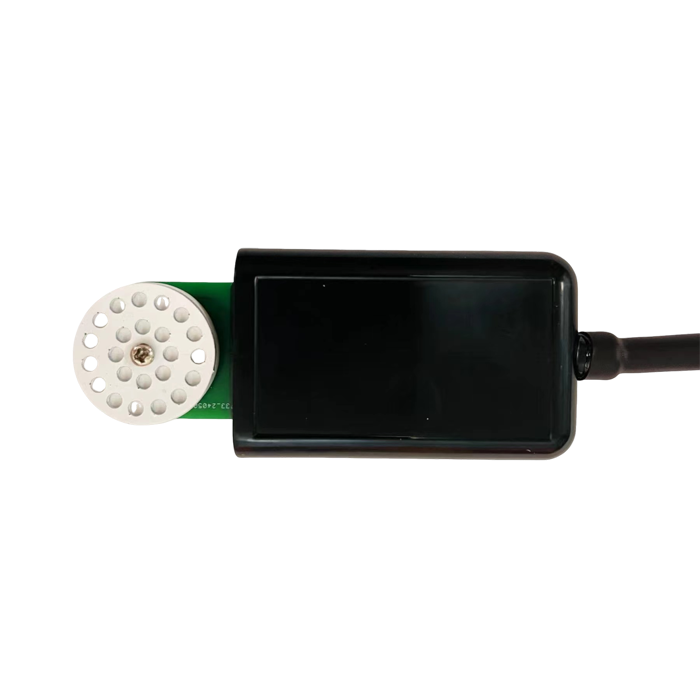
Figure 3. NBL-S-WPS Soil Water Potential Sensor with porous sensing element and RS485 cable.
Sprinkler in wind. Distribution uniformity collapses in the afternoon. Scheduling irrigation at night changes both drift loss and the measured soil response.
Surface on variable soil. Intake rates vary across the field, so a single probe cannot represent the block. Zoning is required before any automation is worthwhile.
Any system with a generic threshold. A fixed 20% VWC trigger is not agronomy. Establish the refill point by comparing probe readings with crop response over a season.
Any system where the sensor is expected to switch the valve. It will not. Keep measurement and actuation on separate, correctly rated chains.
Replacing a surface or furrow system wholesale is expensive and removes the baseline you need to judge the result. A staged retrofit is both cheaper and more measurable.
Stage one: instrument before changing hardware. Install probes at two depths in each management zone of the existing system and log a full irrigation cycle. Record delivered volume, the timing of the wetting front at each depth, and any tailwater. This gives the baseline efficiency for the worked water budget instead of an assumed 0.60.
Stage two: zone the field. Use the baseline data to group areas with similar infiltration behavior. A single probe cannot characterize a variable-soil block, and a single drip design applied across unlike zones will reproduce the same unevenness the surface system had.
Stage three: convert one zone. Fit filtration, a pressure-regulated lateral and emitters in one management zone, keeping the rest unchanged. Run a two-pulse test with a redistribution pause and compare shallow and deep probe responses. If the deep probe responds before the shallow one, water is bypassing the intended volume through a crack, trench or emitter placement — fix that before converting another zone.
Stage four: compare like with like. Over the same crop period, compare delivered volume per zone against the recorded baseline, and check EC where fertigation is used. Express the saving as measured m³ per zone, not as a brochure percentage.
Stage five: scale and decommission. Extend the design to the remaining zones and retire the furrows only after the comparison holds. Keep the old baseline dataset with the site record; it is the evidence for the investment.
This sequence also protects the measurement system. Each stage has its own commissioning sheet — supply voltage at the probe, RS485 A/B twisted pair with single-point shield earth, gravimetric moisture checks on the site's own soil, and the raw values with the datasheet revision. A retrofit that skips stage one can report a large water saving and still have no defensible number.
Q1. Which system uses the least water?
In most climates drip has the highest application efficiency, but the realized saving depends on scheduling, filtration and whether the threshold is calibrated locally. A timer-driven drip system can waste as much as a well-managed sprinkler system.
Q2. Can a soil moisture sensor drive a solenoid valve?
No. An RS485 soil sensor provides measurement only; a controller with a rated output is needed to switch the valve.
Q3. Is 20% VWC a good irrigation threshold?
No. NiuBoL's documentation describes ~20% as the level above which EC readings become more representative of soluble salts — a measurement reference, not an irrigation trigger.
Q4. Where should I put probes in a drip block?
Inside the wetted bulb, at two depths, with the horizontal distance from the emitter recorded. A probe outside the bulb will barely respond to irrigation.
Q5. Why does my deep probe rise while the shallow one stays flat?
Usually preferential flow — a cable trench, crack or emitter placement is delivering water past the sensing volume. Investigate before adjusting the schedule.
Q6. How do I verify the assumed application efficiency?
Meter the delivered volume and check the wetting-front response at both depths; a two-pulse test with a redistribution pause makes bypass visible.
Prev:Data Logging and Telemetry for Environmental Monitoring: Protocols, Gaps and Recovery
Next:Fertilizer Injectors: Dosing Ratios, Injection Points and Where Calibration Drifts
Related recommendations
Sensors & Weather Stations Catalog
 Agriculture Sensors and Weather Stations Catalog-NiuBoL.pdf
Weather Stations Catalog-NiuBoL.pdf
Agriculture Sensors Catalog-NiuBoL.pdf
Water Quality Sensor Catalog-NiuBoL.pdf
Related products
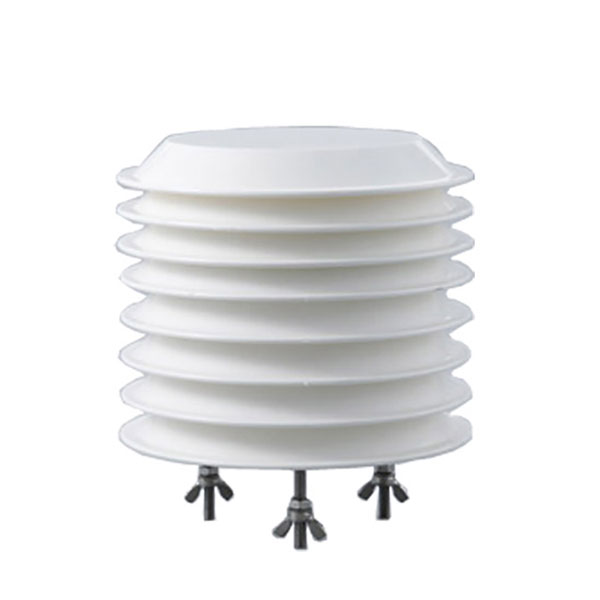 Combined air temperature and relative humidity sensor
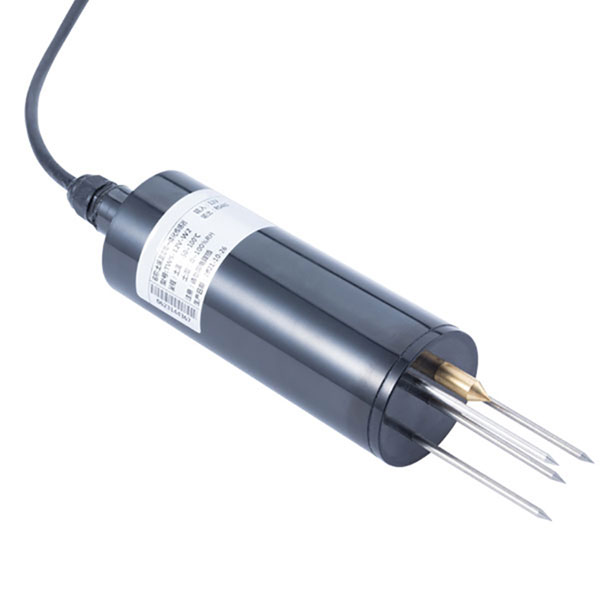 TDR Soil Moisture & Temperature Sensor for irrigation| RS485 |4-20mA| NBL-S-THR
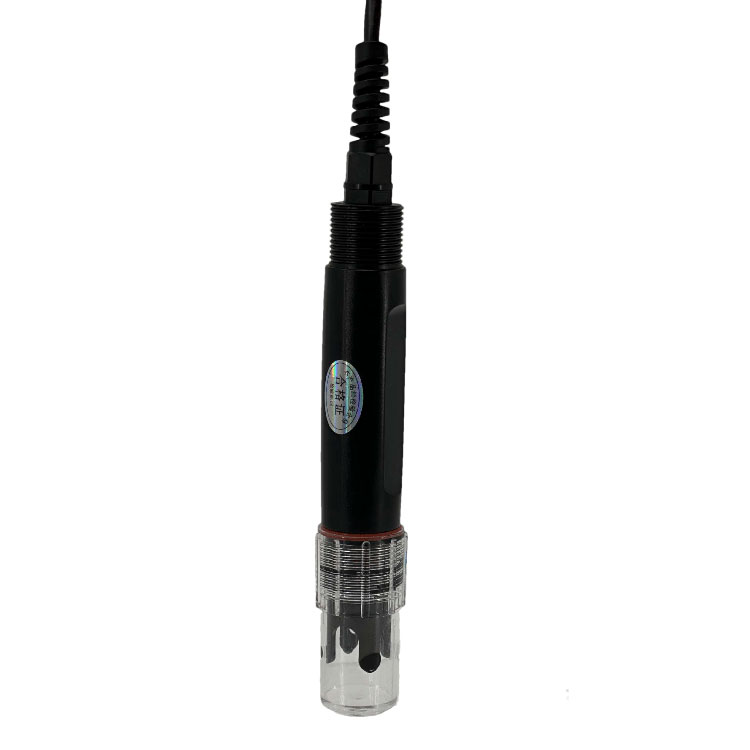 Soil pH sensor RS485 soil Testing instrument soil ph meter for agriculture |NBL-S-PH
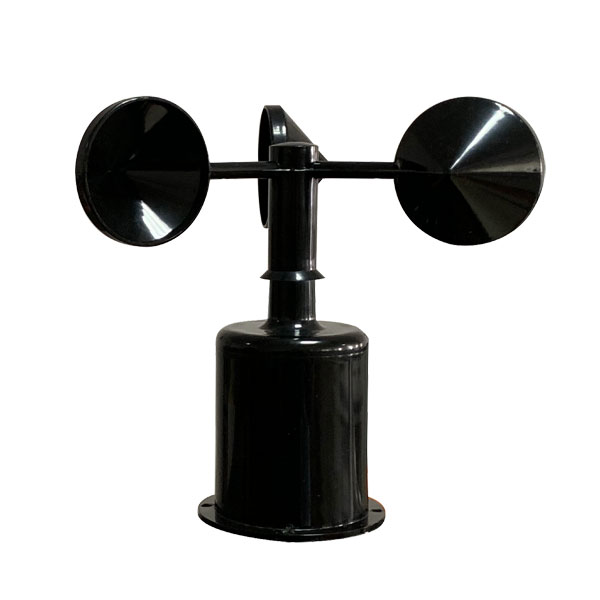 Wind Speed sensor Output Modbus/RS485/Analog/0-5V/4-20mA
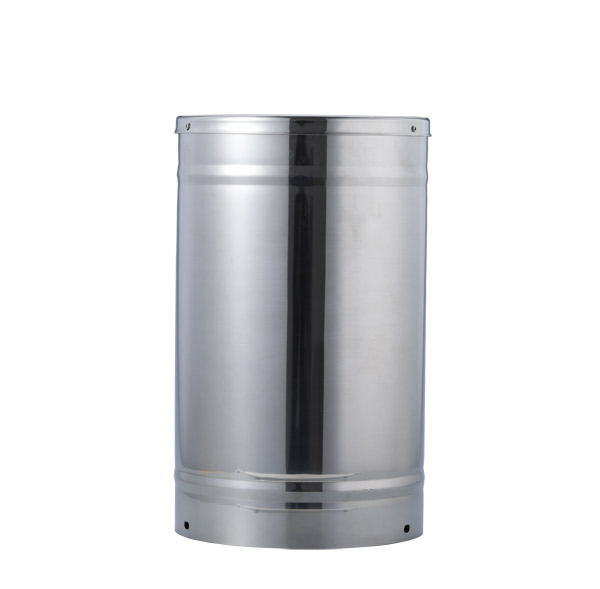 Tipping bucket rain gauge for weather monitoring auto rainfall sensor RS485/Outdoor/stainless steel
 Pyranometer Solar Radiation Sensor 4-20mA/RS485


Screenshot, WhatsApp to identify the QR code
WhatsApp number:+8615367865107
(Click on WhatsApp to copy and add friends)