

— Blogs —
—Products—
 Consumer hotline +8618073152920
WhatsApp:+8615367865107
Address:Room 102, District D, Houhu Industrial Park, Yuelu District, Changsha City, Hunan Province, China
Product knowledge
Time:2026-11-07 15:53:29 Popularity:10
An ambient air quality monitor produces a defensible record only when its inlet samples the air you care about, its calibration is traceable, and its dataset is read with humidity and response-time effects in mind. Most "bad sensor" complaints trace back to a canopy, a vent, a condensation event, or a logger that smoothed away the exceedance. The instrument is usually the last place to look.
NiuBoL's installation guidance for the 6-in-1 air quality sensor specifies mounting in open, well-ventilated areas using pole fixation with unobstructed sensor inlets. That short instruction encodes several survey requirements:
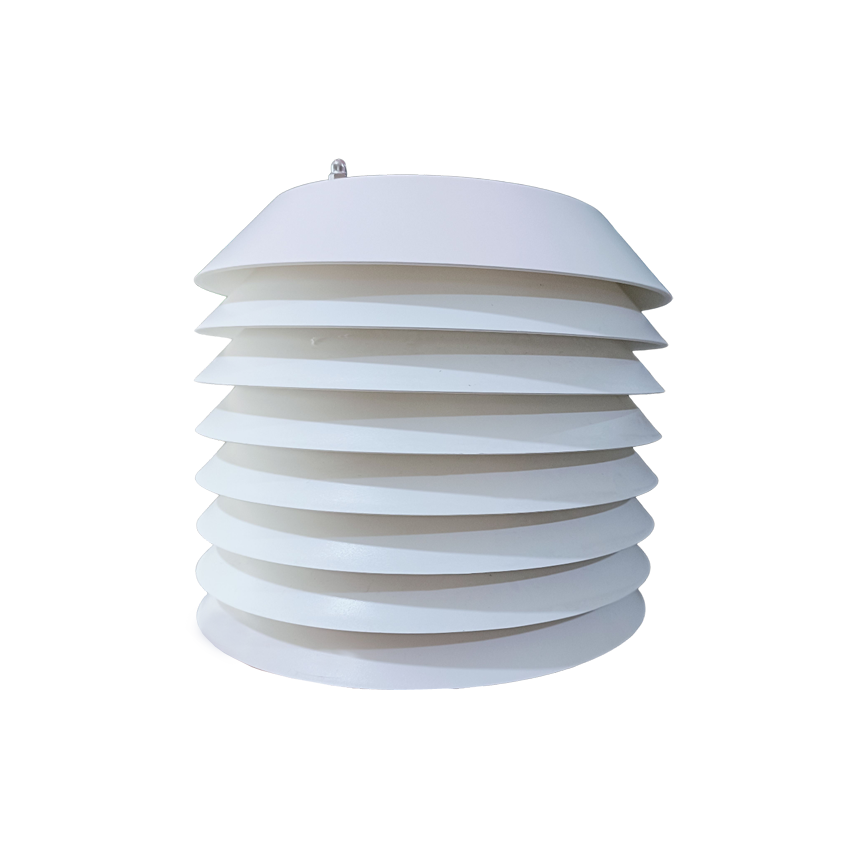
Figure 1. Particulate Matter Sensors (PM1, PM2.5 & PM10).
For particulate channels, NiuBoL's sensor series covers PM1, PM2.5 and PM10, with a documented PM2.5 measurement range of 0–1000 μg/m³. A separate PM100 sensor is described as a high-precision, fully digital detector with a high-strength structural design for harsh weather. For gas channels, NiuBoL's 2-in-1 TVOC & H2S sensor documents measurement accuracy ≤±3%, power consumption ≤50 mA, an operating temperature range of −20°C to +50°C, humidity ≤95% RH without dew, and RS485 signal output using Modbus-RTU. Those four values — accuracy, power, envelope, interface — are the minimum metadata to store with the site record.
| Item | Acceptance question | Why it matters |
|---|---|---|
| Inlet clearance | Unobstructed, open, well-ventilated | Defines the sampled air volume |
| Distance to local sources | Recorded with bearing | Separates ambient from plume |
| Inlet height and surface | Recorded in commissioning sheet | Comparability across sites |
| Gas sensor envelope | −20 to +50°C, ≤95% RH without dew | Defines where ≤±3% accuracy applies |
| Supply at device | Measured under load, not at panel | Prevents intermittent dropouts |
| Interface | RS485 Modbus RTU register map and baud | Preserves raw values and diagnostics |
| Logger buffer | Local storage + breakpoint resume tested | Prevents permanent gaps on uplink loss |
Calibration is a chain, not a certificate. Four steps make it auditable:
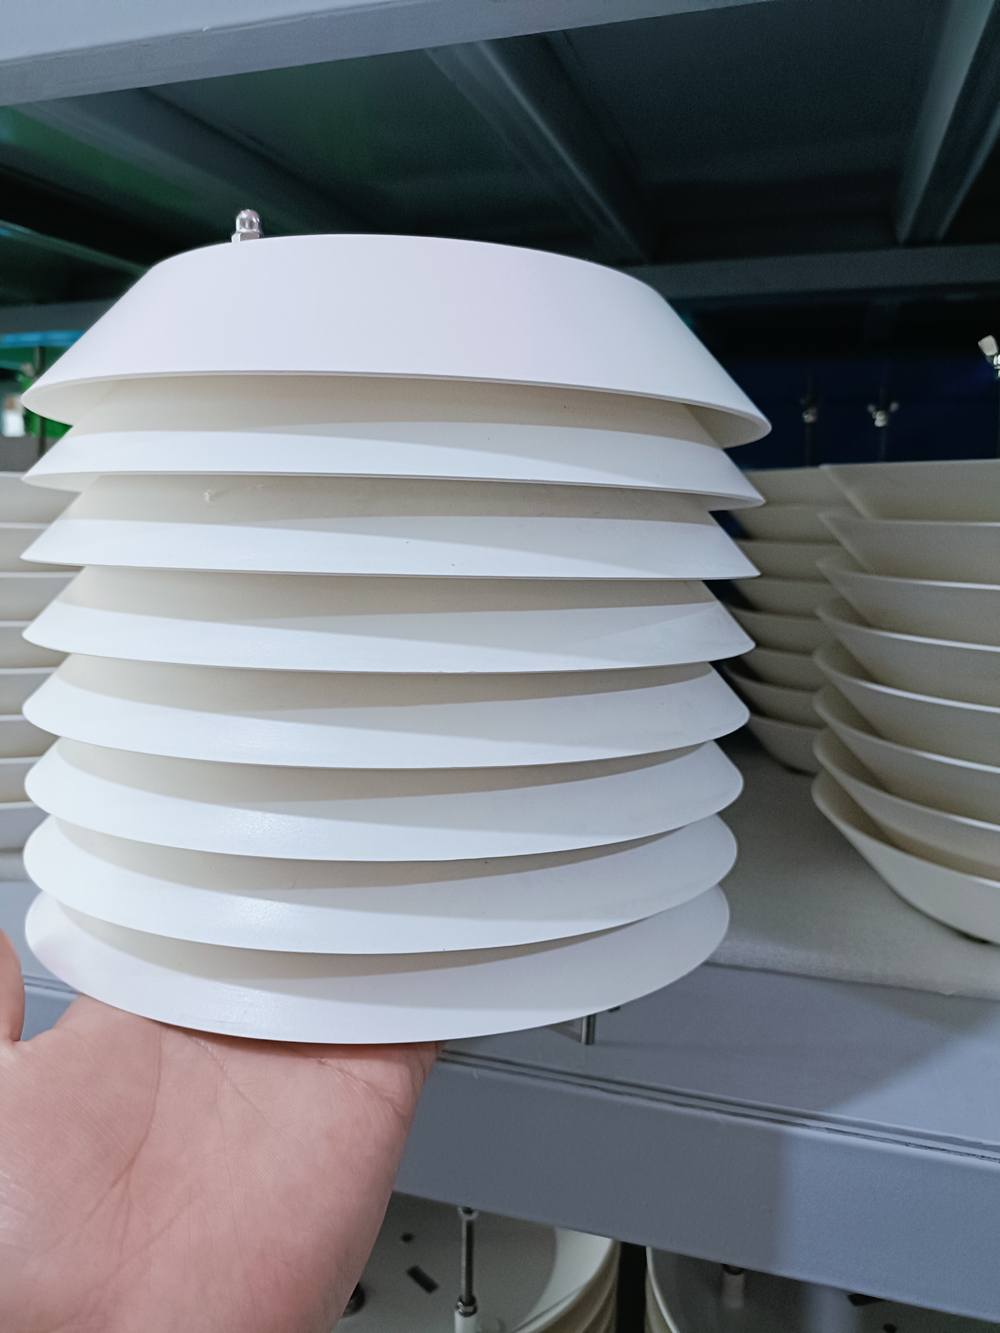
Figure 2. PM2.5/PM10 Integrated Sensor.
Do not overwrite the raw channel values with smoothed ones at the logger. NiuBoL's industrial collector is specified with 16 sensor inputs, 128 GB storage, breakpoint resume transmission and remote setting of sampling frequency and thresholds; use the storage to keep the raw series plus quality flags. Edge-side filtering is fine for alarms, but the archive must retain what the instrument actually reported.
The following is an illustrative dataset for method, not a NiuBoL project record. Consider a peri-urban node logging at five-minute intervals.
| Period | PM2.5 (μg/m³) | RH (%) | NO₂ (ppb) | CO₂ (ppm) | Reading |
|---|---|---|---|---|---|
| 00:00–05:00 | 12–18 | 78–88 | 8–12 | 420–450 | Stable overnight |
| 06:00–08:00 | 28–55 | 90–96 | 22–40 | 520–640 | Morning peak |
| 09:00–14:00 | 14–22 | 55–70 | 12–18 | 430–470 | Midday decline |
| 15:00–18:00 | 20–30 | 60–72 | 18–26 | 470–520 | Secondary traffic |
| 19:00–23:00 | 24–38 | 80–90 | 16–24 | 480–560 | Evening build-up |
The naive reading is a clear morning pollution episode. A careful reading has to account for RH reaching 96%, which is above the ≤95% RH without-dew envelope documented for the TVOC & H2S gas sensor and close to condensation for any optical particle channel. Three checks are needed:
Check the size ratio. If PM10 rises proportionally more than PM1 during the 06:00–08:00 window, hygroscopic growth is a plausible contributor. A combustion plume typically shifts the distribution toward fine particles.
Check gas channels against the same window. NO₂ rising from ~10 to ~40 ppb and CO₂ from ~430 to ~640 ppm with a time profile that matches the local traffic peak supports a real emission episode. If gas channels stayed flat while only PM2.5 spiked, the optical channel would be the suspect.
Check a co-located or nearby node. A humidity artefact is regional and appears at multiple nodes; a local plume is spatially limited. A single node cannot settle the question.
Now add a data-integrity check. Suppose the platform shows a smooth curve through the 07:00 peak, but the raw local buffer shows three missing five-minute records at 06:50, 06:55 and 07:00 followed by a sudden jump. If those records were interpolated without a quality flag, the reported peak time and magnitude are both uncertain. With breakpoint resume enabled and raw values retained, the buffered records arrive on reconnect and the episode can be reconstructed. Without it, the most important fifteen minutes of the day are gone.
A quantitative sanity check on the PM2.5 channel: the documented measurement range is 0–1000 μg/m³, so a 55 μg/m³ reading sits at 5.5% of full scale. If the accuracy is expressed as a percentage of full scale rather than of reading, the absolute uncertainty at this concentration is much larger relative to the measured value than it would be near the top of the range. Always state the convention before deciding whether a 28 → 55 μg/m³ doubling is meaningful.
Condensation. Readings near dew point are not mass concentrations in the usual sense. Flag them rather than archiving them silently.
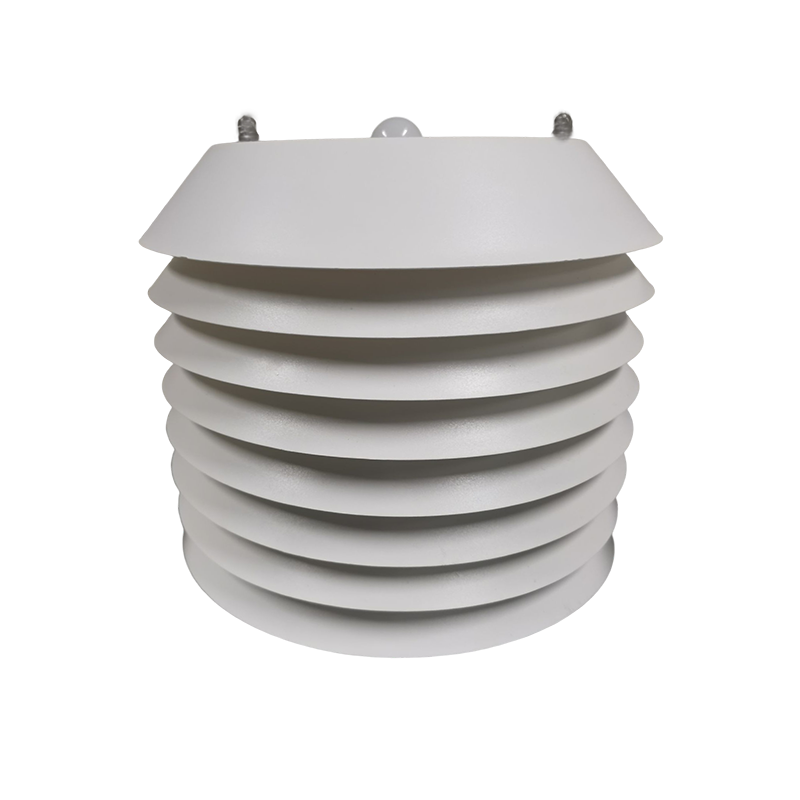
Figure 3. Accurate 5-in-1 Weather Station.
A sheltered or source-adjacent inlet. A canopy or a vent changes every channel at once, and no per-channel calibration repairs it.
Unflagged interpolation. A gap filled with plausible values is worse than a visible gap because it cannot be audited.
Missing accuracy convention. Without knowing whether the stated error is of full scale or of reading, a low-concentration change cannot be evaluated.
Common-mode power faults. All channels dropping or drifting together at one node is a supply symptom. Measure voltage at the device under load.
No co-location baseline. Absolute values from a single un-compared node should be treated as trends until a reference comparison is done.
A monitor does not become a reference station on the day it is bolted to a pole. A 30-day sequence turns a working instrument into a defensible dataset.
Days 0–1: installation record. Photograph the inlet and surroundings, record height, surface type, distances and bearings to local sources, mast dimensions, supply voltage at the device under load, RS485 address map and baud rate, firmware version and datasheet revision. Confirm the inlet is unobstructed and well ventilated.
Days 2–4: parallel comparison. Run the new node beside a trusted reference. Compare raw values at the same timestamps and note any systematic offset. Do not publish absolute concentrations yet; at this stage the node reports trends only.
Days 5–7: zero and span. Perform a filtered-inlet zero check for the optical channels and a reference-gas span check for the electrochemical channels. Record the reference material, concentration and temperature. Confirm the accuracy convention: a percentage of full scale behaves very differently from a percentage of reading at a low concentration such as 20 μg/m³ on a 0–1000 μg/m³ range.
Days 8–14: humidity events. Capture at least one high-RH morning. Compare PM1/PM10 ratios, RH and the gas channels, and check a nearby node. This is where you learn whether the site's fog produces an optical artefact. Flag data outside the ≤95% RH without-dew envelope instead of archiving it silently.
Days 15–21: outage rehearsal. Disconnect the uplink for a defined period, reconnect and verify that breakpoint resume re-sends every buffered record exactly once. Confirm sequence numbers are contiguous and that missing records are never replaced by unflagged interpolated values.
Days 22–27: alarm path test. Trigger a controlled threshold crossing and confirm that the alert carries a timestamp that matches the archived raw values. An alert with no supporting raw record is a data-integrity failure.
Days 28–30: handover. Set diagnostic thresholds from the first weeks' own baseline, fix the cleaning and re-check interval from observed drift, and publish the site record including the co-location results. Only then should absolute values be reported as measurements rather than trends.
The sequence costs three to five site visits. It is considerably cheaper than a season of data that cannot be defended when a client asks whether a morning peak was real.
For networks with more than one node, repeat the co-location step for each new unit against the same reference before its data enters a shared dashboard: a two-node comparison is only as good as the weaker calibration. Keep the reference instrument's own certificate and drift history with the site record. Re-run the humidity-event check each season, because new vegetation, a changed traffic pattern or a new exhaust source alters the local aerosol and gas mix without changing the instrument at all.
Q1. Where should an ambient air quality monitor be mounted?
In an open, well-ventilated area on a pole, with unobstructed sensor inlets, and with distances to local sources recorded.
Q2. What operating envelope applies to the TVOC & H2S sensor?
−20°C to +50°C and ≤95% RH without dew, with ≤±3% measurement accuracy and ≤50 mA power consumption on RS485 Modbus RTU, per the NiuBoL page. Verify against the current datasheet.
Q3. Why do PM readings spike on humid mornings?
Hygroscopic particle growth and fog droplets change the optical scattering signal. Check the PM1/PM10 ratio, RH and a nearby node before calling it an emission episode.
Q4. Is a 55 μg/m³ PM2.5 reading significant?
It is 5.5% of a 0–1000 μg/m³ range. Whether the change is meaningful depends on whether the accuracy is of reading or of full scale — state the convention first.
Q5. Should missing records be filled in?
Only with an explicit quality flag. Prefer breakpoint resume at the collector so the buffered records arrive intact.
Q6. What belongs in the calibration record?
Datasheet revision, firmware version, accuracy convention, zero/span results, co-location comparison, cleaning dates and the raw values with quality flags.
Prev:Environmental Monitoring Sensors: Parameter Choices, Signal Chains and Cross-Sensitivity
Next:no more
Related recommendations
Sensors & Weather Stations Catalog
 Agriculture Sensors and Weather Stations Catalog-NiuBoL.pdf
Weather Stations Catalog-NiuBoL.pdf
Agriculture Sensors Catalog-NiuBoL.pdf
Water Quality Sensor Catalog-NiuBoL.pdf
Related products
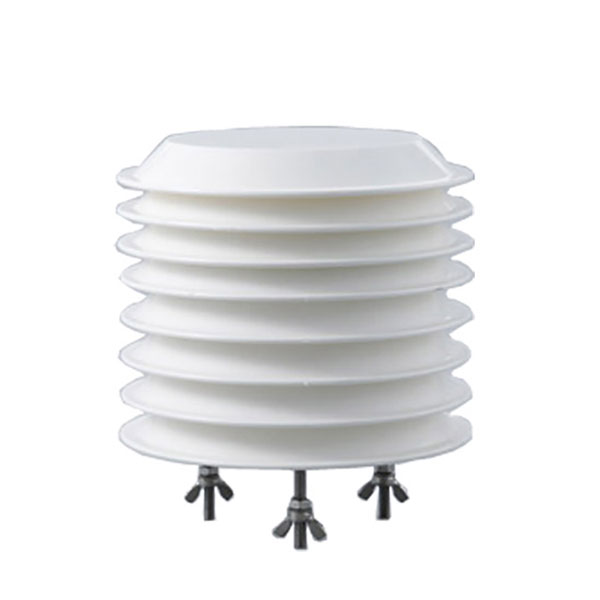 Combined air temperature and relative humidity sensor
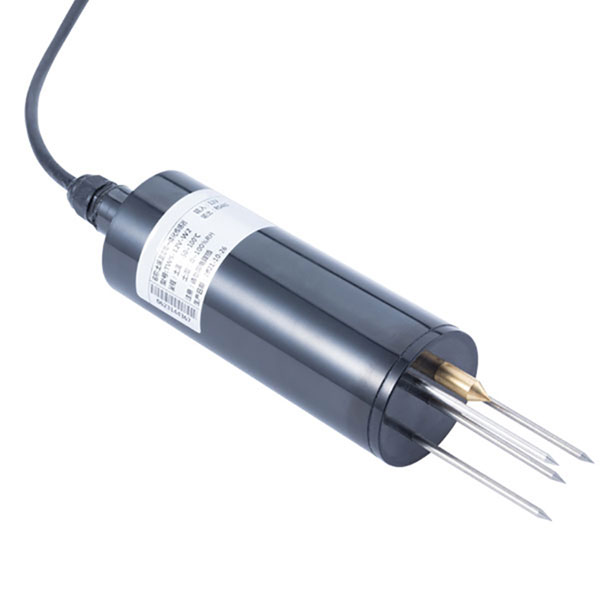 TDR Soil Moisture & Temperature Sensor for irrigation| RS485 |4-20mA| NBL-S-THR
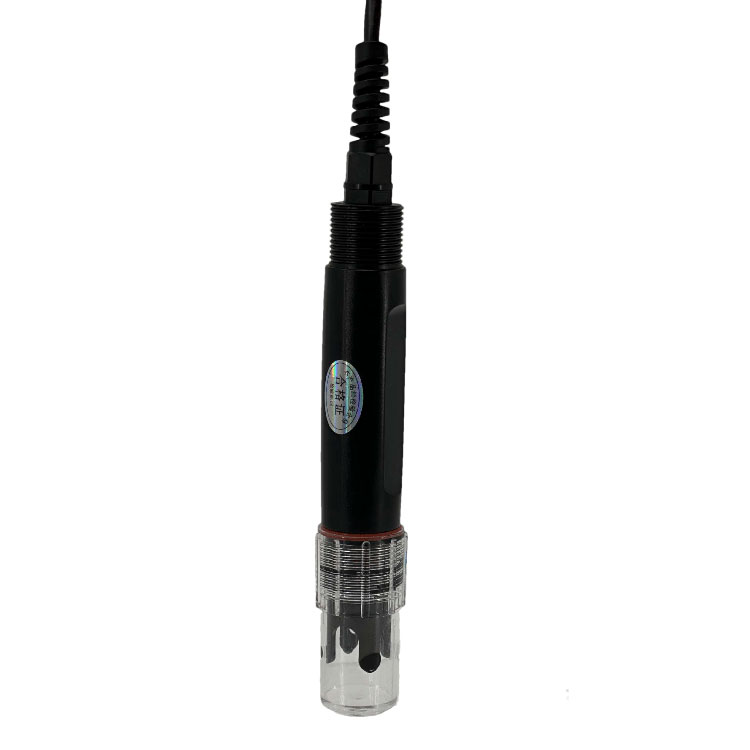 Soil pH sensor RS485 soil Testing instrument soil ph meter for agriculture |NBL-S-PH
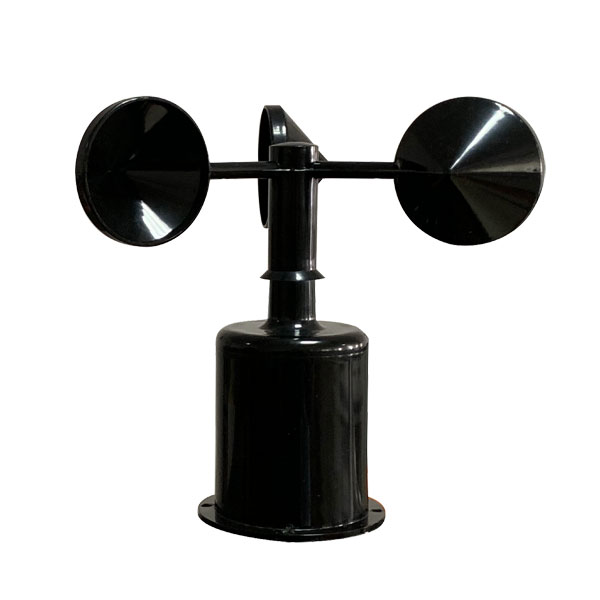 Wind Speed sensor Output Modbus/RS485/Analog/0-5V/4-20mA
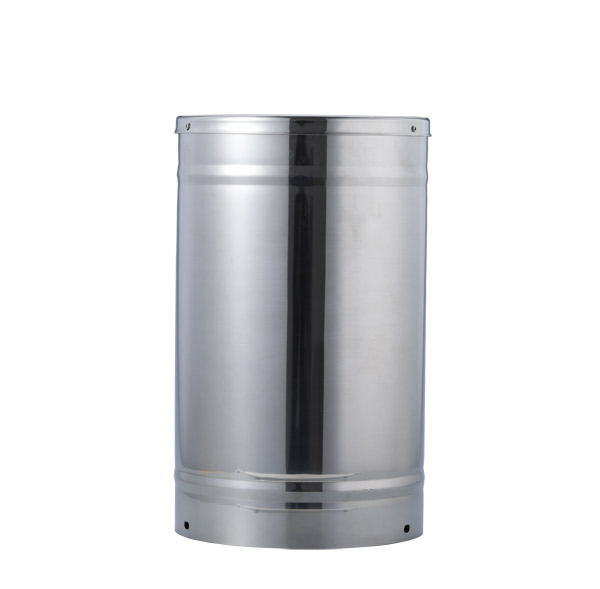 Tipping bucket rain gauge for weather monitoring auto rainfall sensor RS485/Outdoor/stainless steel
 Pyranometer Solar Radiation Sensor 4-20mA/RS485


Screenshot, WhatsApp to identify the QR code
WhatsApp number:+8615367865107
(Click on WhatsApp to copy and add friends)