

— Blogs —
—Products—
 Consumer hotline +8618073152920
WhatsApp:+8615367865107
Address:Room 102, District D, Houhu Industrial Park, Yuelu District, Changsha City, Hunan Province, China
Product knowledge
Time:2026-11-07 15:52:57 Popularity:8
Reliable environmental data is a product of the logging chain, not of the sensor alone. A probe can be perfectly accurate while the network records the right value at the wrong time, drops two hours during a cellular outage, or scales a Modbus word by a factor of ten. Designing for data integrity means specifying the register map, the sampling policy, the time source and the recovery behavior as explicitly as the measurement range.
A typical NiuBoL-style chain has four stages. An RS485 Modbus RTU sensor exposes one or more registers. A data logger or IoT gateway polls those registers, timestamps the values and stores them locally. The gateway forwards buffered records to a cloud platform or private server over 4G, Ethernet or another uplink. A downstream application stores, visualises and exports them.

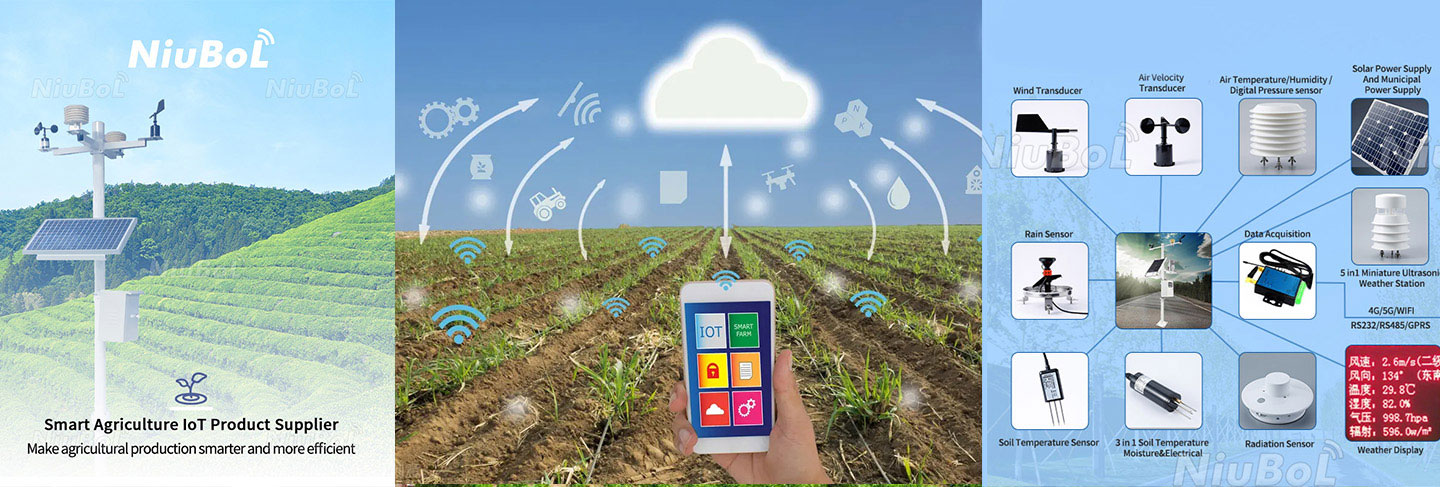
Figure 1. Weather Station Data Logger 4G/WiFi/GPS/RS232/RS485 Modbus.
The split is deliberate. Individual RS485 sensors do not need their own cellular modem; remote communication is normally handled by the data logger or gateway. NiuBoL's documentation also notes that an RS485 version can connect to compatible data loggers, PLCs or IoT gateways, which then transmit data to a cloud platform or private server depending on the system configuration. Understanding that split tells you where to look when data goes missing: an empty cloud series with a full local buffer is an uplink problem, while an empty local buffer is a polling or power problem.
NiuBoL's industrial collector specification lists 16 sensor inputs, 128 GB storage, breakpoint resume transmission, and remote configuration of sampling frequency and thresholds. Its solution-level material describes edge-cloud collaboration — local filtering and anomaly detection with encrypted cloud storage — and cites a transmission success rate of ≥99.9%. Those are the capabilities that decide whether an outage is a footnote or a permanent hole in the record.
Modbus RTU is simple enough to audit by hand, and that audit should be part of commissioning. NiuBoL's NBL-W-CO2 documentation gives a concrete case: the sensor returns one concentration word in the corresponding read format, and data bytes 01 B4 form hexadecimal 0x01B4, decimal 436, so the concentration is 436 ppm. The same page specifies 0–5000 ppm range, ±(50 ppm + 3% of reading) accuracy, 1 ppm resolution, 12–24 VDC supply, 0.2 W power, RS485 Modbus RTU and 9600 baud serial format.

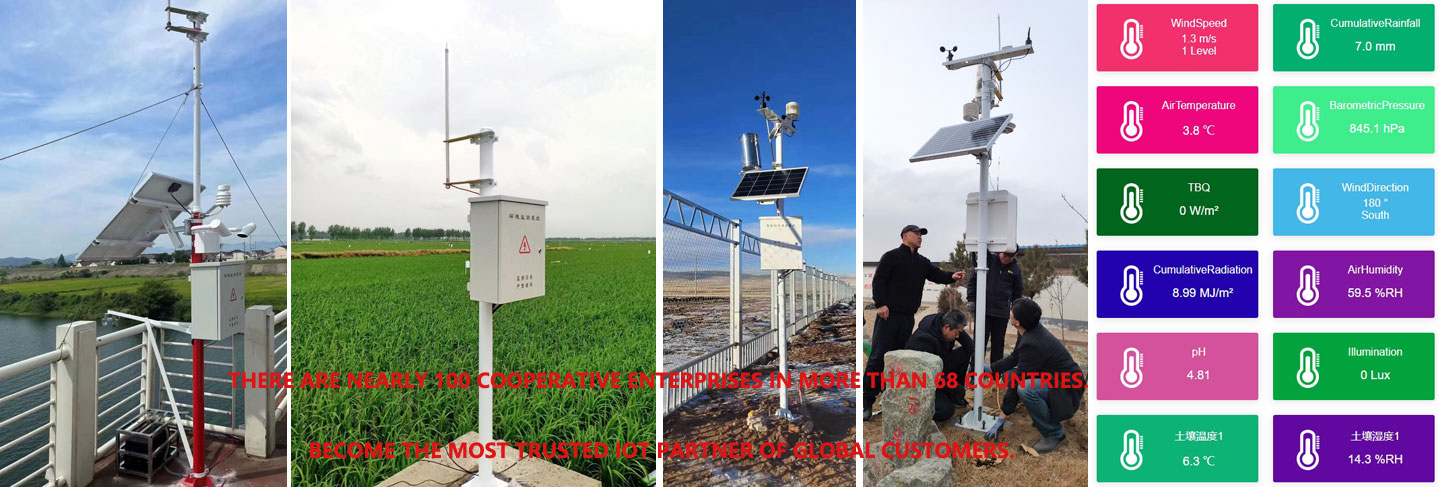
Figure 2. RTU Remote Measurement and Control, Weather Data Collector, 4G Data Collector For Environmental,….
Two warnings from that documentation are worth carrying into every project. First, do not assume additional baud rates or a universal device-count and cable-distance limit — confirm them for the specific installation. Second, RS485 A/B continuity does not prove adequate supply. A bus can poll successfully while a marginal supply causes intermittent, temperature-dependent dropouts.
| Field | Value in the worked example | Why it is logged |
|---|---|---|
| Raw bytes | 01 B4 | Proves byte order and register mapping |
| Decoded word | 0x01B4 = 436 | Independent check on platform scaling |
| Engineering value | 436 ppm | The published reading |
| Range / resolution | 0–5000 ppm / 1 ppm | Defines valid bounds and increments |
| Accuracy convention | ±(50 ppm + 3% of reading) | Error is of reading, not full scale |
| Serial format | 9600 baud | Must match logger configuration |
| Supply | 12–24 VDC, 0.2 W | Power budget and dropout diagnosis |
A practical rule: for the first week, store the raw word next to the scaled value. Any disagreement that is not explained by a documented scale factor is an integration bug.
Sampling frequency should follow the process being measured, not the maximum the logger supports. Soil moisture changes over hours; wind gusts change over seconds; an alarm threshold crossing may be brief but consequential. Logging every channel at one-second intervals produces large files, drains solar-powered sites and makes long-term trend analysis harder, without improving the decisions the data supports.
Define per-channel intervals, then define two other policies that are often forgotten:
NiuBoL's collector documentation notes remote setting of sampling frequency and thresholds, which is valuable only if changes are versioned. Record who changed what and when, otherwise a dataset spanning a threshold change is not internally comparable.
| Gap type | Typical signature | Where it is fixed |
|---|---|---|
| Poll failure | Repeated missing device address, other channels fine | Bus wiring, address map, supply at device |
| Power dropout | All channels at one site stop together, often temperature-correlated | Supply sizing, battery, connector |
| Uplink outage | Local buffer fills, cloud series has a hole | Breakpoint resume, buffer sizing |
| Clock jump | Records appear out of order or duplicated | Time sync and monotonic sequence numbers |
| Scaling change | Step change at a firmware or config update | Versioned register map and config log |
| Silent drift | Values present but slowly biased | Zero/span checks, not the logger |
Use sequence numbers and monotonic timestamps. A sequence counter at the logger makes a missing block obvious even if the timestamps are wrong. Store both device time and logger time.
Size the buffer from the worst realistic outage. With 16 sensor inputs and 128 GB of local storage on the collector, storage capacity is rarely the binding constraint for environmental sampling rates; the binding constraints are the uplink duration, the battery during that outage, and whether resume actually re-sends the buffered block. Test it deliberately: disconnect the uplink for a defined period during commissioning, reconnect, and verify that every buffered record arrives exactly once.
Distinguish gap-filling from measurement. Interpolated values must be flagged, never stored as if measured. A linear interpolation across a two-hour outage can look entirely plausible on a chart and be completely wrong for an alarm investigation.
Keep the raw series. Local filtering and anomaly detection are useful at the edge, but the archive should retain the unfiltered values plus a quality flag. Once a value is overwritten by a smoothed one, the original evidence is gone.
Verify time sync within one logging interval. A five-minute clock offset between two neighbouring stations makes a moving rain front appear in the wrong order. For a network, this is as damaging as a missing sensor.
The following is illustrative, not a NiuBoL project record. Suppose ten sites log six channels at five-minute intervals. Each record is 60 bytes including timestamp, sequence number, device ID and quality flags. Per site per day: 6 × 288 × 60 ≈ 104 kB. Across ten sites: about 1.04 MB/day. A 128 GB collector therefore holds years of data at this rate — confirming that capacity is not the design constraint.
Now consider a six-hour cellular outage. Affected records: 6 h × 12 samples/h × 6 channels × 10 sites = 4,320 records, roughly 0.26 MB. With breakpoint resume, all 4,320 arrive on reconnect. Without it, the network has 4,320 permanent holes — and if an exceedance occurred during those six hours, the alarm evidence is gone even if the alert itself was delivered. The case for resume is about evidence, not storage.
Assuming the sensor is the network. Individual RS485 devices do not handle remote communication; the logger or gateway does. Designs that skip the local buffer lose data on every outage.

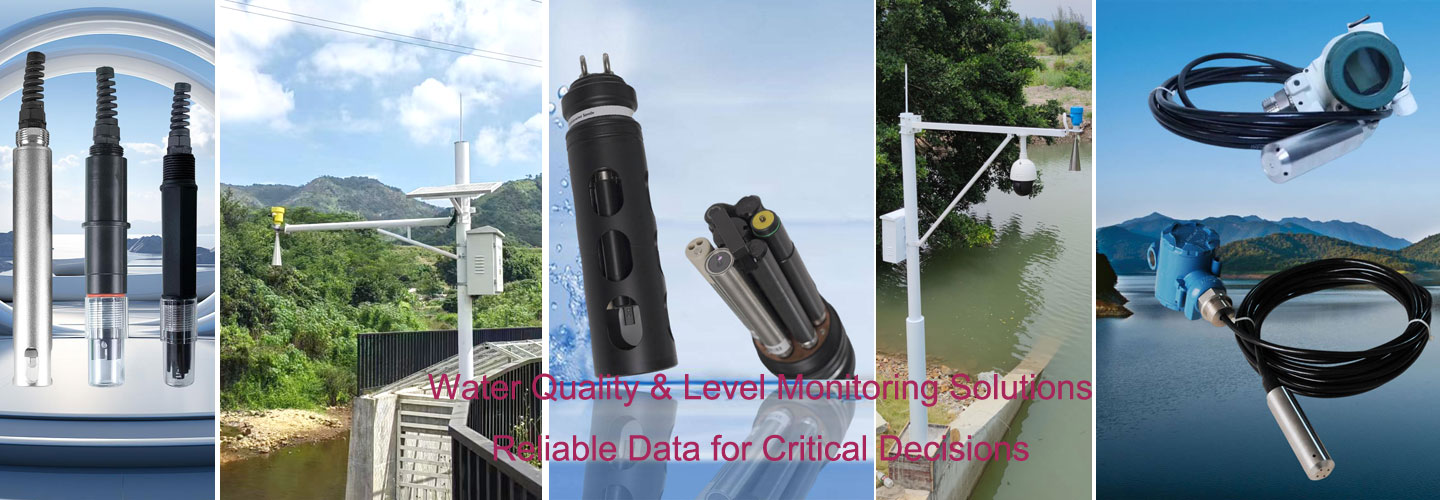
Figure 3. Agricultural Weather Station Products.
Unguarded scaling. A register map change that is not versioned turns a correct sensor into a wrong dataset overnight.
Interpolation without flags. A gap filled with plausible numbers is worse than a visible gap, because it cannot be audited.
No out-of-band alarm path. If thresholds are only evaluated at the next scheduled upload, a short exceedance may never be represented in the archive.
Common-mode power faults. All channels dropping together at one site is a power symptom. Measure voltage at the device under load; bus continuity alone proves nothing.
Unspecified accuracy convention in the archive. A dataset with ±(50 ppm + 3% of reading) values and no metadata cannot be compared later with a full-scale-based instrument.
A telemetry design is finished only when a third party can reconstruct an event months later. That requires a policy, not just a buffer.
Keep the immutable raw series. Store the raw register word, the scale factor and its version, the device ID, a monotonic sequence number, both device and logger timestamps, a quality flag, and any available supply or status reading. Derived, filtered and interpolated values live in separate columns and never overwrite the original. If a smoothed value is all that survives, an exceedance investigation cannot distinguish a real peak from an interpolation.
Version every configuration change. Record who changed the sampling interval, the threshold, the register map or the firmware, and when. A dataset spanning an untracked threshold change is not internally comparable, and an alarm that appears to have "started" on a given date may simply be the date a config was pushed. NiuBoL's collector supports remote setting of sampling frequency and thresholds; that convenience needs a change log beside it.
Separate the alarm path from the archive. An exceedance response time of a few seconds describes an alert path, not a routine logging interval. Both should be recorded with their own timestamps, and a delivered alert should be matched against the corresponding archived raw values. An alert with no supporting record is evidence that the archive, not the sensor, failed.
Define retention and export up front. State how long raw data is kept locally and in the archive, in what format it can be exported, and whether an export preserves the quality flags and the metadata. A CSV of engineering values without flags is not an audit trail.
Rehearse one reconstruction. Pick a six-hour window that includes an uplink outage, an alert and a config change, and ask a colleague to rebuild what happened from the archive alone. If the sequence numbers, resume records and change log make that possible without a phone call to the installer, the design is complete. If they do not, the missing element is almost always metadata rather than storage.
Q1. Where should remote communication live in an RS485 sensor network?
At the data logger or IoT gateway. Individual RS485 sensors do not need their own cellular modem.
Q2. What is breakpoint resume and why does it matter?
It re-sends locally buffered records after an uplink reconnects, so an outage becomes a delay rather than a permanent gap. Test it during commissioning.
Q3. How can I tell a polling fault from an uplink fault?
Check the local buffer. Full buffer with a cloud hole means uplink; empty buffer means polling, power or wiring.
Q4. Should missing values be interpolated?
Only if they are stored with an explicit quality flag and never presented as measurements.
Q5. What does a hand-decoded Modbus frame prove?
It proves byte order, register mapping and platform scaling. The 01 B4 → 436 ppm example is a repeatable commissioning check.
Q6. What metadata belongs with every record?
Device ID, raw word, scale factor and version, timestamp source, sequence number, quality flag, supply status where available, and the datasheet revision.
Prev:Choosing a Monitoring Station: Specs, Siting and Total Cost of Ownership
Next:Drip Irrigation vs Sprinkler and Surface Systems: Accuracy, Cost and Maintenance
Related recommendations
Sensors & Weather Stations Catalog
 Agriculture Sensors and Weather Stations Catalog-NiuBoL.pdf
Weather Stations Catalog-NiuBoL.pdf
Agriculture Sensors Catalog-NiuBoL.pdf
Water Quality Sensor Catalog-NiuBoL.pdf
Related products
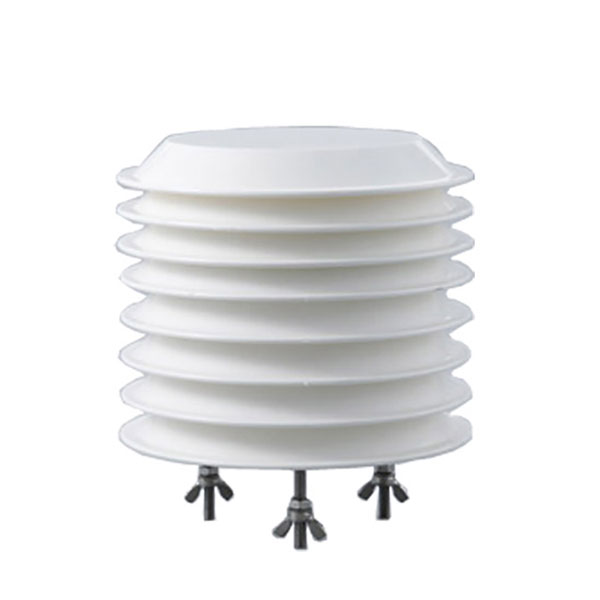 Combined air temperature and relative humidity sensor
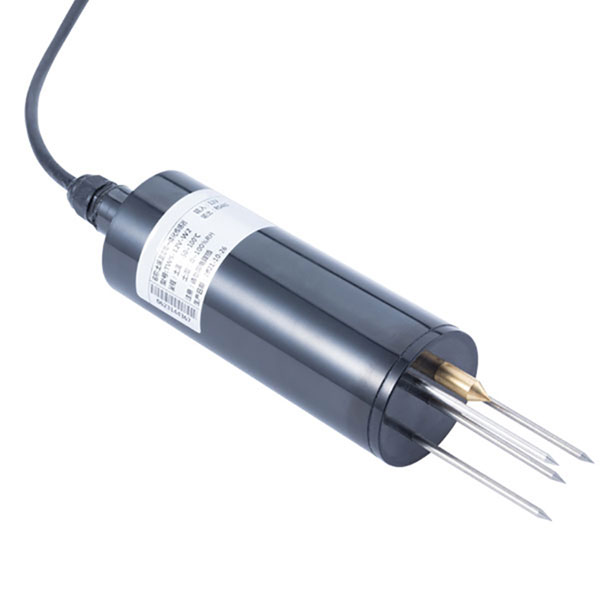 TDR Soil Moisture & Temperature Sensor for irrigation| RS485 |4-20mA| NBL-S-THR
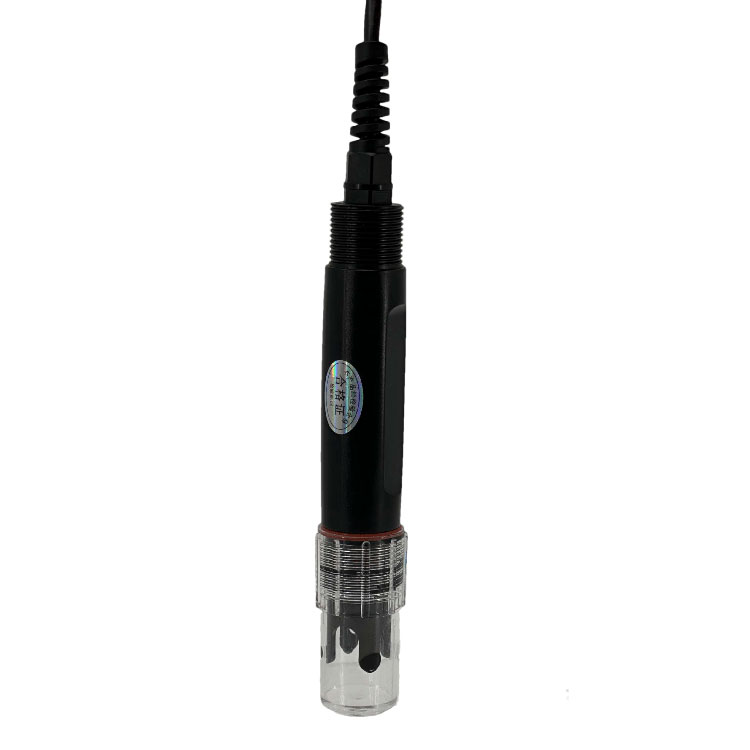 Soil pH sensor RS485 soil Testing instrument soil ph meter for agriculture |NBL-S-PH
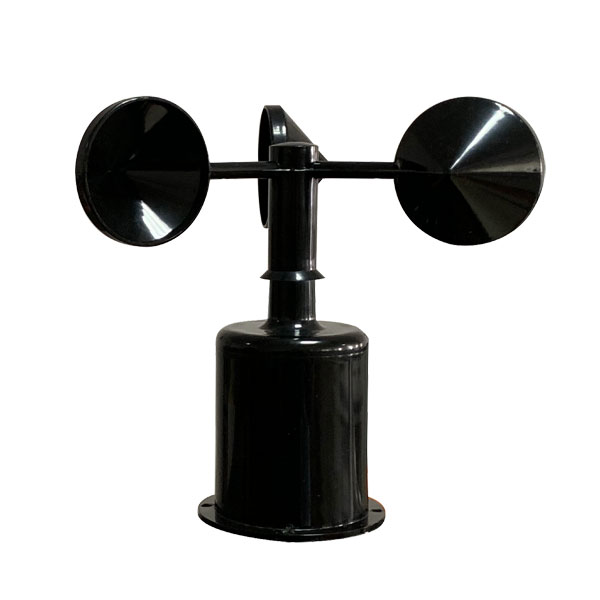 Wind Speed sensor Output Modbus/RS485/Analog/0-5V/4-20mA
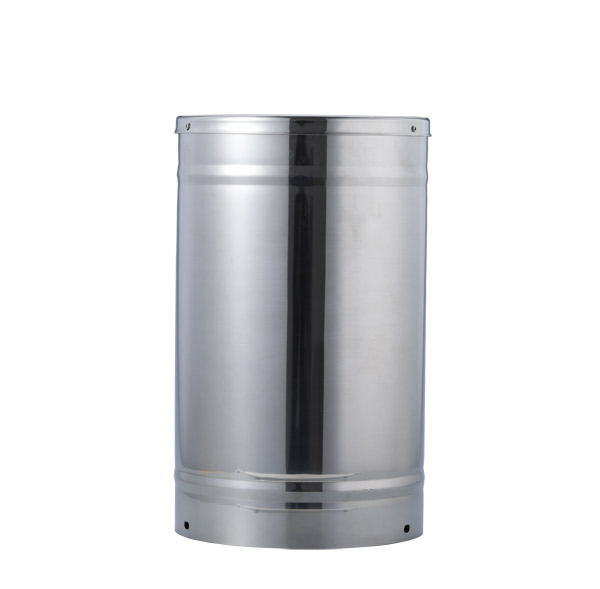 Tipping bucket rain gauge for weather monitoring auto rainfall sensor RS485/Outdoor/stainless steel
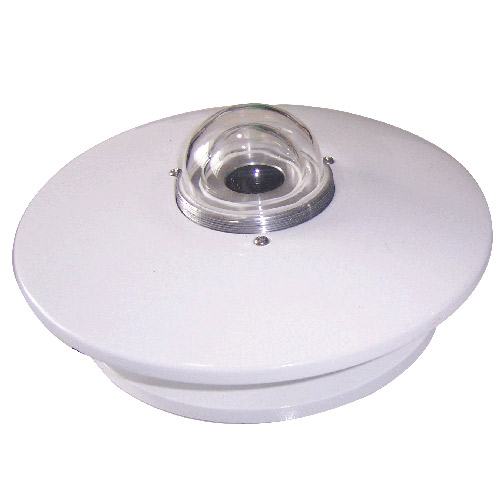 Pyranometer Solar Radiation Sensor 4-20mA/RS485


Screenshot, WhatsApp to identify the QR code
WhatsApp number:+8615367865107
(Click on WhatsApp to copy and add friends)