





— Blogs —
—Products—
 Consumer hotline +8618073152920
WhatsApp:+8615367865107
Address:Room 102, District D, Houhu Industrial Park, Yuelu District, Changsha City, Hunan Province, China
Product knowledge
Time:2026-11-09 09:20:00 Popularity:7
An insect monitoring trap produces a nightly image-based count of captured insects, not a pest forecast and not a spray recommendation. The count becomes useful only after non-target captures, repeat images and imaging limits are separated out, and after a forecast is checked against observed field events with a stated lead time.
The same tray can support three very different claims. A field team reviewed one night of images from a light trap and recorded the raw machine count, the count after manual review, and the count of the single species the forecast was meant to track.
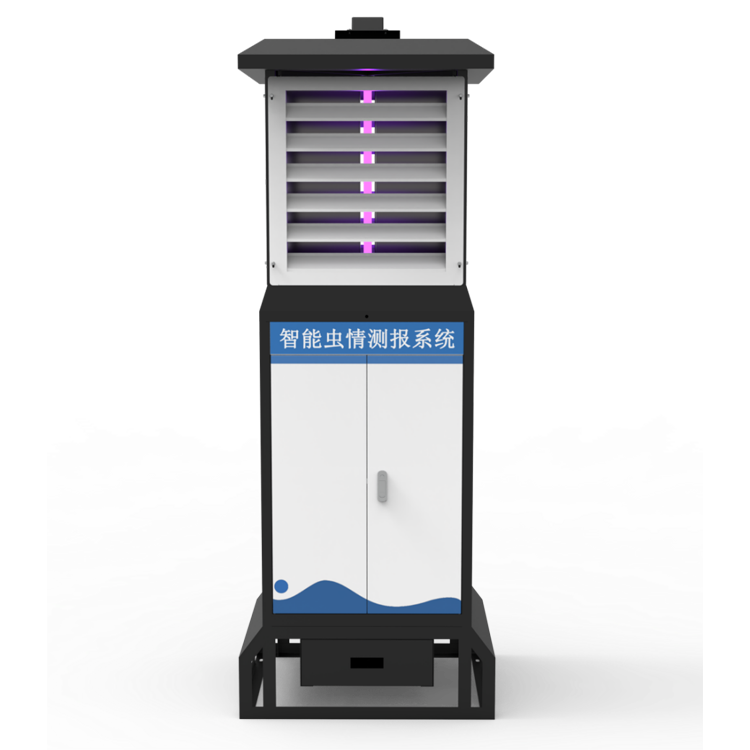
Figure 1. Smart Remote Insect Monitoring System Insect Monitoring Device.
The 340 figure and the 268 figure describe different things. The first is an event count produced by an imaging algorithm; the second is a biological count a grower could act on. Treating them as interchangeable adds 26.9% to the apparent pressure without adding a single insect to the field. An insect monitoring trap that reports only the raw number gives the operator no way to detect that gap.
This is the first question to put to any supplier of an insect monitoring trap: which of these numbers is exposed in the register map, and is the reviewed count available at all? A numeric channel carrying 340 and a report showing 268 can both be correct and still disagree, because one counts image events and the other counts animals.
The measurement chain runs from attraction to imaging to classification, and each stage changes what the final number means. A light source draws insects to a capture surface; the attraction radius depends on lamp spectrum, ambient moonlight, competing light sources and wind. A catch is therefore a sample of flight activity under those conditions, not a census of the local population.
At the imaging stage, the classifier separates objects from the tray background by size, contrast and shape. A finer pixel pitch helps with small bodies and debris, but it cannot separate two insects that land on top of each other: two moths on the same part of the tray produce one counted event. Conversely, a single insect photographed twice at slightly different positions produces two.
Neither error scales with pest pressure, so neither can be removed by a fixed correction factor. Ask for the smallest object the classifier accepts and for a reviewed confusion matrix, rather than a camera pixel count.
Classification adds a third filter. Non-target species, partial bodies and debris are either rejected or counted, depending on the model and its confidence threshold. A threshold tuned to avoid false alarms under-counts a real outbreak; one tuned for sensitivity inflates routine nights. The practical consequence is that count accuracy for an insect monitoring trap must be stated with a confusion matrix or a reviewed subset, not as a single percentage.
A separate station in the same network may carry a 12-megapixel industrial camera for crop images. That resolution belongs to a different module with a different purpose. Combining the two camera figures into one "imaging accuracy" claim hides the fact that insect counts and canopy photographs are separate data products.
A chamber temperature of 85 ±5 °C is specified for sample preparation in the forecasting equipment. That condition dries and fixes captured material before imaging, which stabilises the appearance of the sample. It does not correct a biased catch, and it does not turn a light-trap sample into a population estimate. The tolerance exists so that one night's image is comparable with the next.
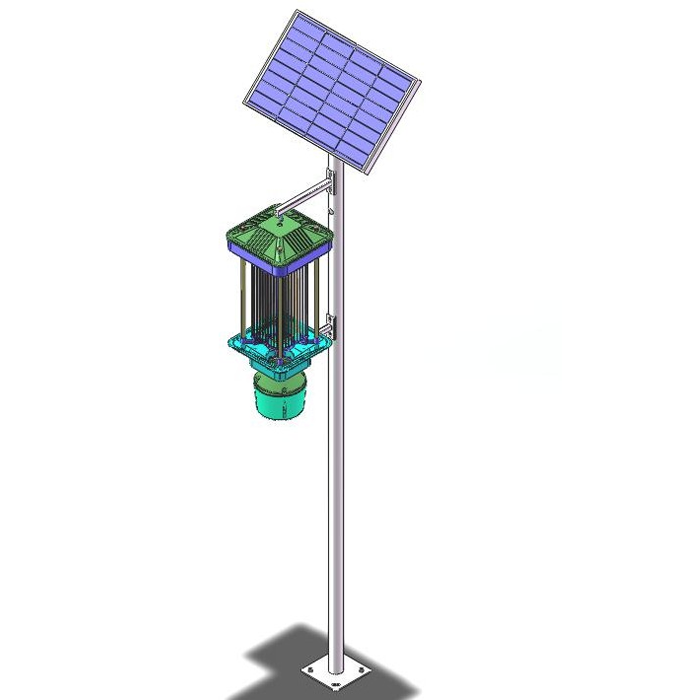
Figure 2. Frequency Vibration Solar Insect Trap.
The consumable path matters more for long deployments than the optical specification. A slide belt replaced once can support up to 365 days of operation when three images are taken per day, with an automatic alert when it runs out. That figure is a capacity calculation, not a calendar guarantee: 365 days at three exposures per day is 1095 exposures in total.
If a site raises the imaging cadence to four per day during a high-pressure period, the same belt supports about 274 days. If it drops to one image per day outside the season, the same belt lasts longer than a year but no longer resolves a one-night flight peak. Service life is a function of exposure count, so the operator should log exposures used rather than days elapsed.
The automatic end-of-belt alert is a useful boundary condition. Without it, an insect monitoring trap continues to publish plausible counts from a static surface. A number that does not change for many consecutive nights may be a genuine absence of flight activity, but it may equally be an exhausted belt; only the exposure counter and the alert state separate the two.
A notice delivered at 06:00 on Monday offers 24 hours before the Tuesday 06:00 observation window it refers to. That lead time is only meaningful if the forecast target is defined in advance: which species, which threshold of nightly count, and which field observation would count as the event. Without those three definitions, a 24-hour warning cannot be scored.
Suppose an insect monitoring trap sets an action threshold at 80 reviewed target adults per night. Over a 30-night validation window, the forecast issues 8 warnings and 6 of them are followed by a reviewed count above 80 within the stated 24 hours. That is 6 true warnings, 2 false warnings, and an unknown number of missed events that must be counted separately by checking the nights with no warning.
The hit rate of 6 in 8 is 75%, but that number alone is not a forecast accuracy figure until the misses are known. If 4 nights exceeded 80 with no warning, the recall is 6 in 10, or 60%. A supplier quoting 75% without stating the denominator and the missed-event count is describing the alarms it issued, not the events it caught.
Illustrative calculation based on assumed site values, not a measured field record. The 80-adult threshold, the 30-night window and the warning counts are worked examples. Set the threshold from local economic injury levels and validate against the current datasheet for your instrument before using any of these figures as an acceptance limit.
There are conditions under which a nightly count should be treated as context only. Heavy rain suppresses flight activity regardless of population, so a low count during a storm is not evidence of control. A bright moon or a nearby competing light source reduces the attraction radius, and a change of lamp type mid-season breaks the comparability of the whole series.
Condensation is another hard boundary. A 0–100% RH channel in a weather sensor describes an operating range for that sensor, not immunity to condensation on an optical window. A wet window scatters the illumination and raises the apparent object count. Log humidity alongside the count and discard images taken while the enclosure was wet rather than trying to correct them afterwards.
The count also fails when the decision needs a different quantity. An insect monitoring trap reports flying adults at one point. It does not report larval density, egg laying, crop damage or the fraction of the field affected. Using a nightly adult count as a direct spray trigger substitutes a proxy for the quantity the decision actually depends on.
An RS485 Modbus RTU connection carries selected numerical sensor values. A weather sensor using that interface does not establish that every cabinet status, insect image and forecast result is available through the same register map. Images and cabinet reports commonly use a separate transfer mechanism, and the four-condition monitoring equipment in this product class explicitly separates numerical channels from image acquisition.
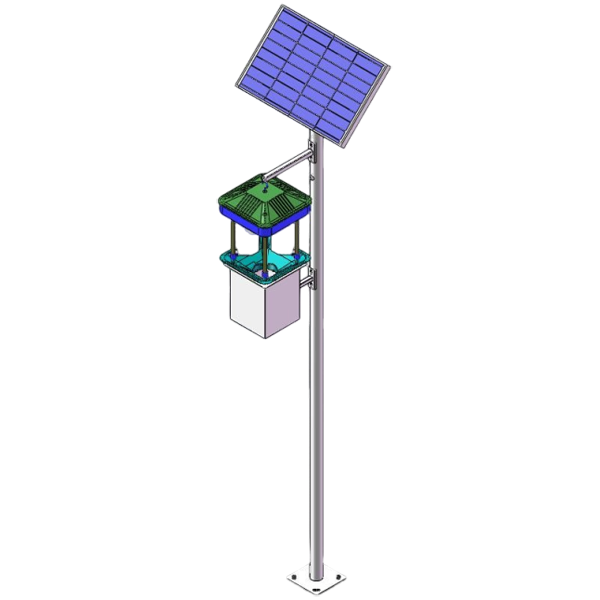
Figure 3. Wind-suction Solar Insect Trap Light.
Before commissioning, ask the supplier to state which numeric channels exist, what each register holds, and whether the nightly total is a raw event count or a reviewed count. In the worked night the two differ by 72 insects, so a register labelled only as a count is ambiguous. Keep any soil or weather probes sharing the cabinet in a separate table with their own depth nodes and units, so a moisture value is never mistaken for a nightly total.
The practical acceptance test for an insect monitoring trap is to request one night's raw count, one reviewed count and the corresponding image, then verify that all three can be retrieved and matched by timestamp. If the image path cannot be joined to the numeric path, a disputed count cannot be audited, and a forecast cannot be validated.
Record the lamp type, spectrum and mounting height, and keep them unchanged for the season.
Log exposure count against belt capacity, and confirm the end-of-belt alert reaches the operator.
Capture a reviewed subset of at least 30 nights with the raw count, reviewed count and non-target removals.
Score any forecast against a pre-defined species, threshold and event definition, and record both false warnings and missed events.
Store humidity and enclosure state with every image so wet-window nights can be excluded.
Verify the register map for numeric channels and confirm the separate route used for images and cabinet reports.
Re-run the reviewed subset after any firmware or classification-model change, since a silent model revision can shift counts without changing any specification.
Q1. What does an insect monitoring trap actually count?
It counts image events from insects captured at a light trap over a defined period, typically reported as a nightly total. That number includes non-target species and repeat or overlapping captures unless a review step removes them. It is a sample of flight activity under the night's conditions, not a census of the field population or a measure of larval damage. An insect monitoring trap is a counting instrument, not a population census.
Q2. Is a 365-day slide belt life a fixed service interval?
No. The 365-day figure assumes three images per day, or 1095 exposures in total on one belt. Raising the cadence to four images per day reduces the same belt to roughly 274 days. Log exposures used rather than days elapsed, and treat the automatic end-of-belt alert as a required alarm channel rather than an optional convenience.
Q3. Can the raw nightly count be used as a spray trigger?
Not on its own. In the worked example, a raw count of 340 fell to 268 reviewed target adults, a 26.9% overcount relative to the reviewed figure. A spray decision also needs larval density or damage assessment and a locally validated economic threshold. The trap count is best used to time scouting and to trigger a field check.
Q4. Does an 85 ±5 °C sample chamber improve count accuracy?
It stabilises sample preparation so one night's image is comparable with the next. It does not correct a biased catch, overlapping insects, or a classification threshold error. Treat it as a repeatability condition for the imaging step, not as an accuracy specification for the pest count.
Q5. Why can't the forecast be scored with a hit rate alone?
A hit rate counts the warnings issued, not the events that occurred. In the worked 30-night example, 6 of 8 warnings were followed by the event, but on 4 nights the count exceeded 80 with no warning, so recall was 60% rather than 75%. Record false warnings and missed events against a pre-defined threshold before quoting any accuracy figure.
Q6. Is a 0–100% RH weather channel enough for a wet site?
No. A numerical range for a humidity sensor does not make an optical window immune to condensation. Wet glass scatters the illumination used for imaging and can lift the apparent object count. Store RH and enclosure state with each image and exclude wet-window nights from the series instead of applying a correction afterwards.
An insect monitoring trap earns its place when the raw count, the reviewed count and the image can be reconciled for the same night. The 26.9% overcount in the worked example is larger than most season-to-season changes a grower would act on, so an unreviewed number can invert a decision. Ask for the register map and the separate image route, validate the forecast against a named species and threshold, and keep the exposure counter, humidity and enclosure state with every record. A defensible pest record states what was counted, what was removed, and what was never counted at all.
What a nightly count is worth
An insect monitoring trap reports flight activity at one point, not a field population. The worked night moved from 340 raw detections to 268 reviewed target adults, a 26.9% overcount, and an 80-adult action threshold produced 6 hits and 4 misses across 8 warnings in a 30-night window. Those figures belong together: a count without a confusion matrix cannot support a forecast claim. Request one night of raw images alongside the reviewed total, state the lead time on every warning, and keep the forecast and the count in separate columns of the acceptance record.
Comparing count methods for a pest forecasting station? Share the nightly image cadence and your action threshold via our contact page, and we will help you shape the raw-versus-reviewed acceptance record.
Prev:Field Sensor Deployment: RS485 Wiring and Registers
Next:Construction Dust Monitor: PM10/PM2.5 Fence-Line Alarms
Related recommendations
Sensors & Weather Stations Catalog
 Agriculture Sensors and Weather Stations Catalog-NiuBoL.pdf
Weather Stations Catalog-NiuBoL.pdf
Agriculture Sensors Catalog-NiuBoL.pdf
Water Quality Sensor Catalog-NiuBoL.pdf
Related products
 Combined air temperature and relative humidity sensor
 TDR Soil Moisture & Temperature Sensor for irrigation| RS485 |4-20mA| NBL-S-THR
 Soil pH sensor RS485 soil Testing instrument soil ph meter for agriculture |NBL-S-PH
 Wind Speed sensor Output Modbus/RS485/Analog/0-5V/4-20mA
 Tipping bucket rain gauge for weather monitoring auto rainfall sensor RS485/Outdoor/stainless steel
 Pyranometer Solar Radiation Sensor 4-20mA/RS485


Screenshot, WhatsApp to identify the QR code
WhatsApp number:+8615367865107
(Click on WhatsApp to copy and add friends)

