





— Blogs —
—Products—
 Consumer hotline +8618073152920
WhatsApp:+8615367865107
Address:Room 102, District D, Houhu Industrial Park, Yuelu District, Changsha City, Hunan Province, China
Product knowledge
Time:2026-11-09 10:05:00 Popularity:6
A construction dust monitor measures airborne particulate on two size channels, with PM10 tracking mechanical dust and PM2.5 checking combustion and background aerosol. Its fence-line alarm is defensible only when the channels move differently, the ratio points to a local source, and the trigger has been checked against a background station.
A working day at an earthworks site is a useful way to read a construction dust monitor, because the sources change on a schedule. The table below is a shortened log from one boundary node with a 1-minute sampling interval and an average reported every 10 minutes.
The morning jump from 68 to 410 μg/m³ on PM10, while PM2.5 rose only from 31 to 74 μg/m³, is the signature of coarse mechanical dust. The ratio falling from 0.46 to 0.18 says the added mass is in the larger fraction. The evening reading of 155 μg/m³ with a ratio of 0.57 is a different animal: both channels are elevated, fine particles dominate, and the site was idle.
That last row is why a single PM10 threshold is not enough. A fence-line limit applied to 155 μg/m³ at 17:50 would have blamed an idle site for a regional event. A construction dust monitor that logs only one channel cannot separate the two cases, and the operator ends up either over-watering or ignoring real exceedances.
A construction dust monitor in this class uses laser scattering to size suspended particles in the 0.3 to 10 μm range and to report mass concentration for the PM2.5 and PM10 fractions. The published ranges for one integrated unit are PM2.5 over 0–1000 μg/m³ and PM10 over 0–2000 μg/m³. Those are measurement spans, not site limits, and they should never be used as alarm thresholds.
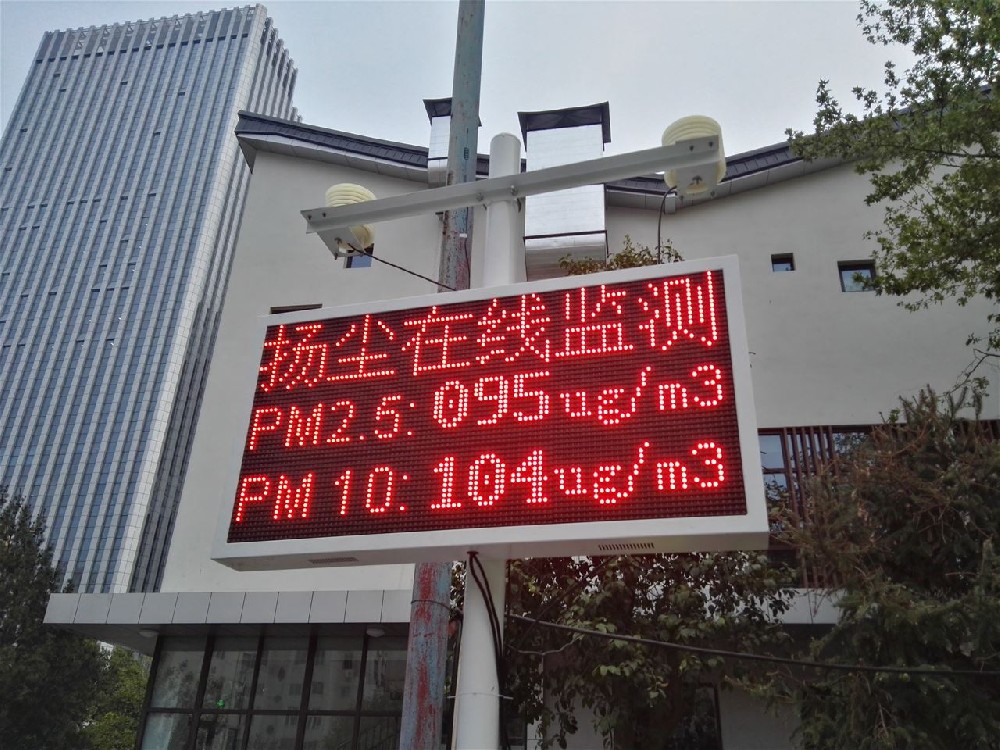
Figure 1. PM2.5 sensors and PM10 sensors.
A ratio near 0.15 to 0.20 during active work is consistent with coarse mineral dust from digging, crushing or a haul road. A ratio above 0.5 with both channels elevated points toward fine-mode aerosol that the site did not generate locally. Between those bands the ratio is ambiguous: a wet haul road, a nearby diesel generator or a change in wind direction can all move it.
Wind is not an optional extra channel for a construction dust monitor. A boundary node downwind of the works sees the site signal; the same node upwind sees background. Without wind speed and direction stored at the same timestamp, a peak cannot be attributed to the site at all, and a ratio becomes a number without a source. Log wind alongside both particulate channels, not as a separate daily summary.
Noise is a useful companion channel on a working site, because plant activity and dust generation often share a cause. A simultaneous rise in the noise channel and PM10 is stronger evidence of on-site activity than either channel alone. Store it at the same timestamp as the particulate and wind records, not as a separate daily summary.
The PM10 channel on one sensor in this range is specified at 0–2000 μg/m³ with a relative error of ±15% and a maximum error of ±10 μg/m³, stated at 25 °C and 50% RH, with a minimum detectable particle diameter of 0.3 μm. Both the percentage and the absolute term matter, and the stated conditions matter more than either.
At 68 μg/m³, ±15% is about ±10 μg/m³, so the absolute term and the relative term give roughly the same bound. At 640 μg/m³, ±15% is ±96 μg/m³, which is far larger than the ±10 μg/m³ term. An alarm threshold placed 20 μg/m³ above a background of 600 μg/m³ sits inside the measurement uncertainty of the channel at that concentration.
The 25 °C / 50% RH condition is a laboratory reference, not a description of a wet or cold site. Hygroscopic growth of particles at high humidity raises the apparent mass concentration on optical instruments, and water droplets can be counted as particles. The specification does not provide a correction for that, so the operator must treat humid periods as a separate data class rather than applying an assumed factor.
A 0.3 μm detection limit describes the smallest particle the optics can see. It does not establish accuracy at the low end of the range, and it does not make the instrument a reference method. Ask whether a quoted error applies to the reading or to the span, and keep the two conventions out of one acceptance table.
Consider a site that wants a construction dust monitor to drive an automatic watering trigger. A naive rule fires whenever PM10 exceeds 500 μg/m³ and resets as soon as it falls below 500 μg/m³. On the 10:30 to 12:10 part of the log, a single watering cycle drops PM10 below the threshold, the pump stops, the haul road dries, and the reading rises again. The system can cycle the pump many times in an hour.

Figure 2. PM2.5/PM10 Integrated Sensor.
A bounded rule uses three numbers: an on-threshold of 500 μg/m³, an off-threshold of 350 μg/m³, and a minimum off-time of 20 minutes. The gap between 500 and 350 μg/m³ is the hysteresis band; it stops the pump from chattering around a single line. The 20-minute floor gives the wetted surface time to work before another decision is made.
Illustrative calculation based on assumed site values, not a measured field record. With a 10-minute averaging interval, a 20-minute minimum off-time means at least two full averaging periods must complete between two pump starts. If a pump delivers 0.8 m³ per start, seven preventable chatter cycles in one afternoon waste 5.6 m³ of water. That volume is only valid for the stated pump and interval, so measure the delivered volume on site.
The trigger also needs a validity gate. If the node is upwind of the works, or if RH is above a site-defined wet threshold, or if the enclosure reports a fault, the PM10 value should be marked invalid and excluded from the trigger rather than clamped to the last good reading. An alarm generated from a flagged value is worse than no alarm, because it teaches the operator to ignore the system.
Each node in a construction dust monitor network measures the sum of site contribution and regional background. A second node placed upwind at comparable height and exposure measures the background on its own. The site contribution is the difference, and it is only meaningful when both nodes report valid data over the same averaging period.
Coverage is a practical constraint. With a 10-minute averaging interval, a 30-day month yields 4,320 paired intervals; if 3,456 of them carry valid readings at both nodes after rain, faults and calibration checks, paired coverage is 80%. Quoting a monthly site contribution without that denominator overstates what was actually observed.
A local logger with enough inputs to take both node series and enough memory to buffer them through an outage is the practical requirement here. Write the channel list and the storage retention into the commissioning record, then confirm both nodes share one clock source; a few minutes of offset between them destroys the difference calculation during a fast-moving dust peak.
Rain, fog and high humidity invalidate optical particle counts as measures of dry dust mass. A construction dust monitor cannot tell water droplets from mineral dust on its own. A peak that coincides with a rain event is more likely water droplets than an emission. Wind speeds above the site's normal range can resuspend material from outside the boundary. A change of inlet position, a dirty optical window, or a firmware revision that alters the scaling of one channel can all produce a step that looks exactly like a process change.
The upper range is another boundary. A PM10 channel specified to 0–2000 μg/m³ cannot report a higher concentration, so a severe event appears as a flat ceiling. A flat line at full scale is a saturation flag, not a stable reading, and the record should say so.
Finally, an online optical count is not a gravimetric compliance measurement. Use it to direct suppression, to schedule cleaning and to trigger a field check. Where a regulatory limit is in question, the acceptance method and its uncertainty must be agreed separately from the alarm logic described here.
Record the exact PM2.5 and PM10 ranges, the error convention and the stated reference conditions for the installed model.
Set on-threshold, off-threshold and minimum off-time as three separate values, and store them in a versioned configuration.
Confirm wind speed and direction are logged at the same timestamp and averaging interval as both particulate channels.
Install or identify an upwind background node and compute paired coverage for the first 30 days.
Verify the inlet height, optical window cleaning interval and the enclosure fault flags before enabling automatic suppression.
Hand-check one exceedance against a field observation and against the noise channel before trusting the first alarm.
Re-run the threshold check after any firmware change; a revised scaling factor shifts every stored exceedance count at once.
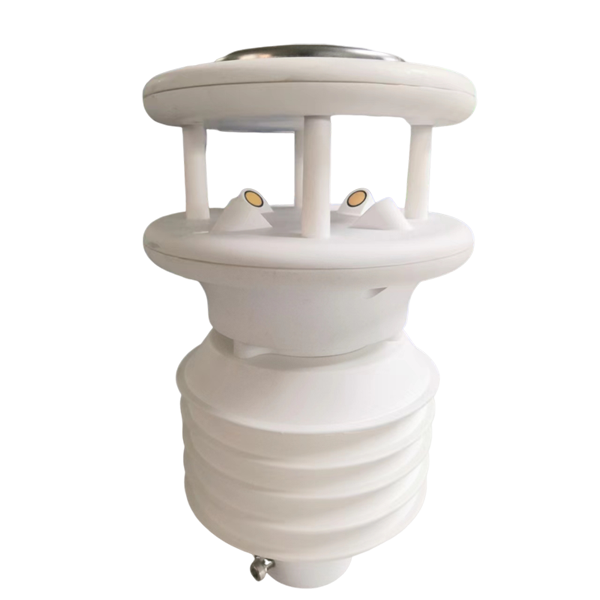
Figure 3. 8-in-1 Ultrasonic Weather Station Sensor with PM2.5 PM10 Noise — NBL-W-81GUWS.
Q1. Why does the PM2.5/PM10 ratio matter at a fence line?
It separates coarse mechanical dust from fine-mode background aerosol. In the worked log, active excavation pushed PM10 from 68 to 410 μg/m³ while PM2.5 moved only from 31 to 74 μg/m³, dropping the ratio from 0.46 to 0.18. An idle-site reading of 155 μg/m³ with a ratio of 0.57 indicated regional haze instead. A single-channel threshold cannot make that distinction. A construction dust monitor needs both size channels to make that call.
Q2. Is ±15% with ±10 μg/m³ a tight enough basis for a 20 μg/m³ alarm band?
Not at high concentrations. At 640 μg/m³, ±15% is ±96 μg/m³, far larger than the ±10 μg/m³ absolute term, so a threshold 20 μg/m³ above background sits inside the channel's uncertainty. Both terms are stated at 25 °C and 50% RH; field humidity needs its own validity gate.
Q3. Can the PM10 channel be used for compliance reporting?
An optical channel with a 0–2000 μg/m³ span and a 0.3 μm detection limit is suited to process monitoring and alarm triggering, not to a gravimetric reference determination. Say which error convention applies, agree the acceptance method separately, and never present a flat line at full scale as a stable measurement.
Q4. What stops a suppression pump from cycling on and off?
Hysteresis plus a minimum off-time. An on-threshold of 500 μg/m³ with an off-threshold of 350 μg/m³ and a 20-minute floor requires at least two complete 10-minute averaging periods between starts. In the worked example, seven avoidable chatter cycles at 0.8 m³ per start would waste 5.6 m³ of water.
Q5. Do I need a background station if the fence-line node is already calibrated?
Yes, for attribution. The fence-line node sees site contribution plus regional background; an upwind node isolates the background. Report paired coverage as well as the difference — 3,456 valid 10-minute intervals out of 4,320 in a 30-day month is 80%, and a monthly figure quoted without that denominator overstates the evidence.
Q6. What should happen when RH is high or the node is upwind?
Mark the interval invalid and exclude it from the trigger. Hygroscopic growth and water droplets raise apparent mass on optical instruments, and an upwind node is measuring background, not the site. Clamping to the last good value creates an alarm that looks valid but has no measurement behind it.
A construction dust monitor is useful when it answers a specific question: did the site add coarse particulate at this boundary, at this time, under valid conditions? That answer needs both size channels, wind at the same timestamp, an upwind reference, and a trigger with hysteresis and an explicit invalid-data gate. The 0–2000 μg/m³ span and the ±15% error statement bound what the number can support; they do not turn an optical count into a compliance measurement.
Write down the on-threshold, off-threshold, minimum off-time and validity rules before enabling suppression, then verify one exceedance by hand against a field observation.
The boundary condition behind every dust alarm
A construction dust monitor earns its keep when both size channels, wind and a background station are read together. The 06:40–19:20 fence-line log used a PM10/PM2.5 ratio near 0.17 during hauling and 0.59 under regional haze, with 500/350 μg/m³ hysteresis to stop a watering trigger from chattering. Rain, fog and high RH invalidate optical counts as dry dust mass, so no single-channel threshold can attribute a source. Commission both clocks from one source, record the error convention, and re-run the threshold check after any firmware change before treating an exceedance as evidence.
Setting fence-line dust triggers for a site? List the two size channels, background station and watering setup through our contact page, and our engineers will check the ratio and hysteresis assumptions before commissioning.
Prev:Insect Monitoring Trap: Count Accuracy and Forecast
Next:Multiparameter Water Quality Sonde: Drift and Calibration
Related recommendations
Sensors & Weather Stations Catalog
 Agriculture Sensors and Weather Stations Catalog-NiuBoL.pdf
Weather Stations Catalog-NiuBoL.pdf
Agriculture Sensors Catalog-NiuBoL.pdf
Water Quality Sensor Catalog-NiuBoL.pdf
Related products
 Combined air temperature and relative humidity sensor
 TDR Soil Moisture & Temperature Sensor for irrigation| RS485 |4-20mA| NBL-S-THR
 Soil pH sensor RS485 soil Testing instrument soil ph meter for agriculture |NBL-S-PH
 Wind Speed sensor Output Modbus/RS485/Analog/0-5V/4-20mA
 Tipping bucket rain gauge for weather monitoring auto rainfall sensor RS485/Outdoor/stainless steel
 Pyranometer Solar Radiation Sensor 4-20mA/RS485


Screenshot, WhatsApp to identify the QR code
WhatsApp number:+8615367865107
(Click on WhatsApp to copy and add friends)

