

— Blogs —
—Products—
 Consumer hotline +8618073152920
WhatsApp:+8615367865107
Address:Room 102, District D, Houhu Industrial Park, Yuelu District, Changsha City, Hunan Province, China
Product knowledge
Time:2026-09-07 14:00:00 Popularity:162
A multiparameter soil meter is useful in agricultural research and teaching when the experiment controls sampling depth, probe contact, soil preparation and record identity. Use it to compare defined conditions and examine measurement limitations. Do not treat every displayed nutrient value as an independent chemical analysis. Select a portable survey instrument or a permanently logged sensor according to the observation required, not simply the number of channels.
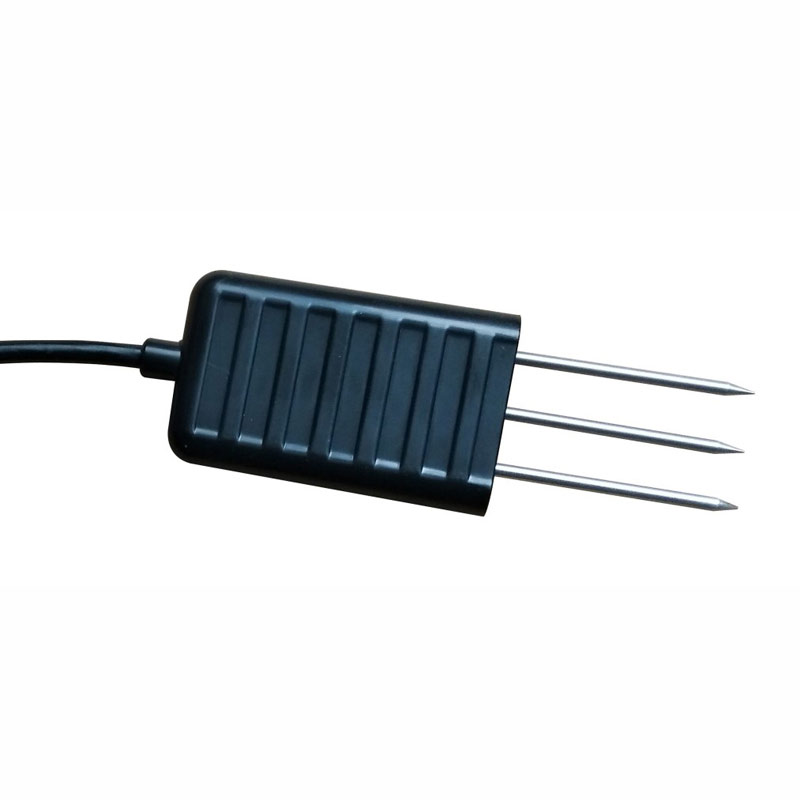
A teaching laboratory can produce many readings without producing a meaningful comparison. Students may insert probes at different depths, test freshly watered soil beside an undisturbed sample, or compare percentages that use different water-content definitions. The instrument purchase should support a protocol that prevents these errors.
Define the experimental unit first: a pot, a prepared soil sample, a field plot or a fixed depth. Record treatment, soil type, sampling position and time. Several readings in the same pot are repeated observations of that pot; they are not automatically independent treatment replicates.
Choose the observation schedule from the question. A mobile instrument is practical for comparing locations during a visit. An installed probe and data logger are more suitable for observing change between visits. Moving one probe among treatments can also introduce a time-order effect when the conditions are changing during the session.
| Displayed quantity | What the exercise should establish | Interpretation to avoid |
|---|---|---|
| Soil temperature | Temperature at a defined depth and observation time | Equating it with air temperature measured elsewhere |
| Volumetric water content | Water volume relative to bulk soil volume under the selected method | Comparing it directly with a dry-mass percentage |
| Conductivity | The electrical response under the actual contact and moisture conditions | Calling it the concentration of one specific nutrient |
| Salinity output | The instrument's defined salt-related calculation and calibration | Assuming equivalence with every soil-extract salinity method |
| Calculated nutrient indicators | How the instrument derives and reports its indicators | Presenting conductivity-derived NPK as independent chemical determinations |
For the NiuBoL USB soil-monitor family discussed here, NPK indicators are derived empirically from conductivity and factors. They are not direct, independent determinations of actual field nitrogen, phosphorus and potassium. This distinction makes a useful teaching exercise: several plausible-looking outputs can share one underlying electrical measurement.
Where a study needs quantitative nutrient analysis, arrange suitable laboratory methods and sampling. Do not validate all three nutrient indicators merely by showing that they change together after watering or fertiliser application.
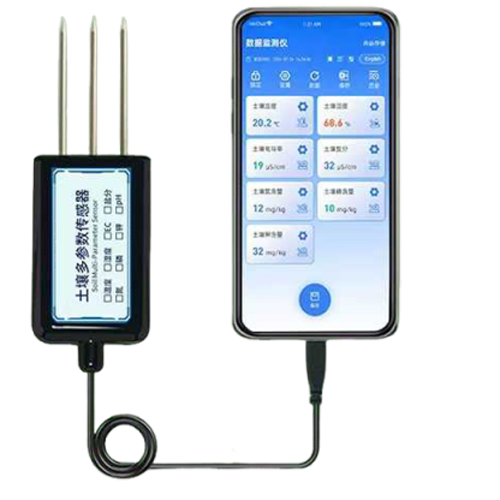
The NiuBoL 7-in-1 USB Type-C soil sensor provides a phone-connected arrangement for selected soil observations. The configuration includes temperature, moisture, EC, salinity and NPK indicators; it should not be assumed to include the separate pH function offered in an eight-parameter arrangement.
| Item | 7-in-1 USB configuration | Laboratory or teaching check |
|---|---|---|
| Temperature | -40 to 80 deg C; stated +/-0.3 deg C; 0.1 deg C resolution | These are measuring specifications, not a complete phone operating-temperature rating |
| Soil moisture | 0-100% volumetric range; stated +/-2%; 0.1% resolution | Clarify the accuracy basis and check the actual soil response |
| EC | 0-20000 microS/cm; stated +/-3%; 1 microS/cm resolution | Retain the method and unit; do not substitute an extract result without comparison |
| Salinity | Reported range 0-20000 mg/L | Identify the calculation basis before comparison with another method |
| NPK indicators | Reported range 0-1999 mg/kg for each indicator | Empirical conductivity-derived values, not separate chemical analyses |
| Connection and power arrangement | USB Type-C phone-connected configuration | Test the actual host, OTG support, app version and permissions |
| Records | App storage and Excel export functions | Test the exported columns, units and sample identifiers before the course |
Obtain a compatibility demonstration using the institution's actual phone or tablet. Do not infer support from a Type-C socket alone, and do not assume that every operating-system release supports the same app. Retain the tested device and app version with the equipment record.
A controlled exercise can compare the probe response with a suitable reference determination across several prepared moisture conditions. Use the same soil, maintain a documented packing condition and allow water to distribute appropriately before measurement. Avoid repeatedly making new insertion holes in the exact same small sample volume without recording the disturbance.
Gravimetric water content and volumetric water content need different denominators. When gravimetric content is expressed as water mass divided by dry-soil mass, conversion to a volumetric basis also needs dry bulk density and water density. USDA ARS research on soil sampling identifies bulk density as essential for that conversion.
For a numerical illustration, 0.20 g water per g dry soil, a dry bulk density of 1.30 g/cm3 and water density approximated as 1.00 g/cm3 correspond to 0.26 m3/m3, or 26% volumetric water content. This is a unit-conversion example, not a calibration claim or a typical value for every soil.
Record repeatability and disagreement across the tested conditions. A single matching result does not establish accuracy in other textures, packing conditions or salinity levels. Keep any local correction equation separate from the original measurements and identify the data used to derive it.
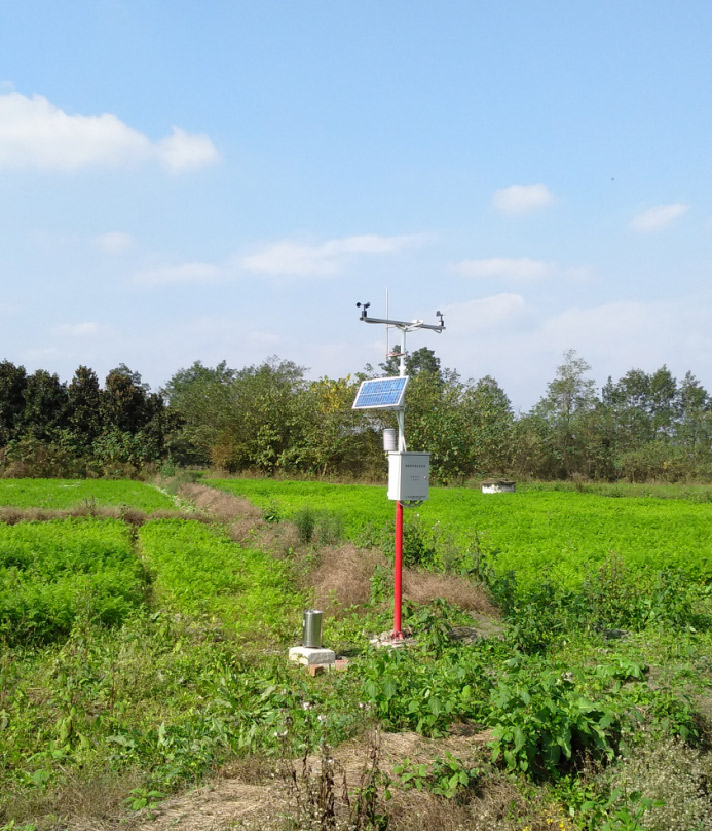
In field teaching, relate soil observations to irrigation, rainfall and the timing of the visit. An agricultural weather station can provide context for a soil dataset, but the air sensors and rainfall collector do not measure root-zone water content. Keep the soil point and weather-station location documented separately.
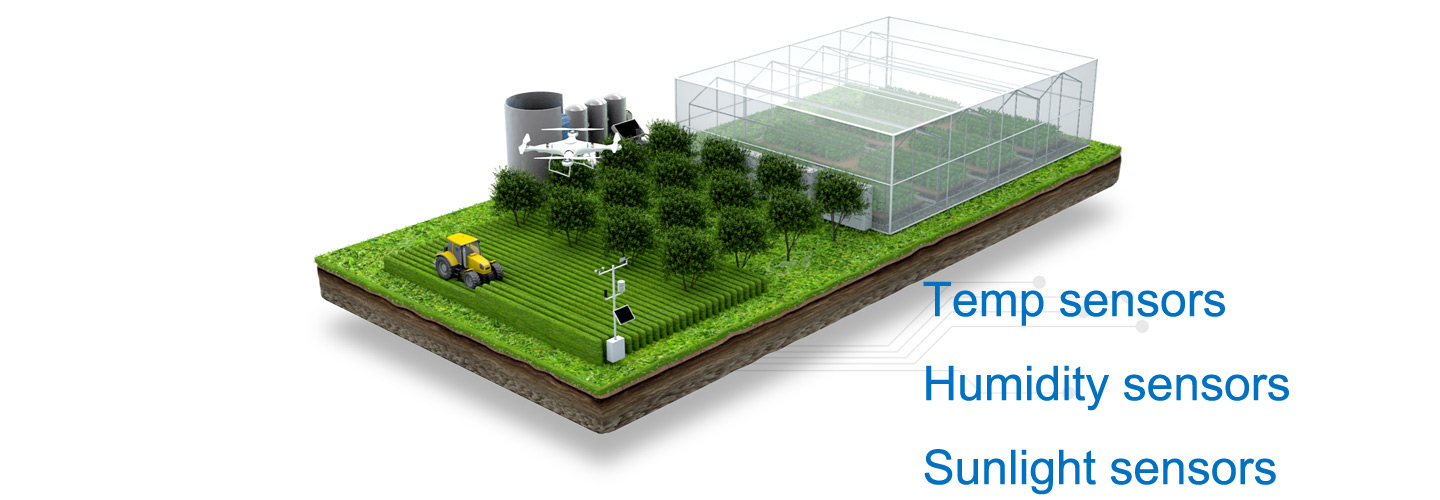
In greenhouse experiments, record irrigation delivery and the position relative to the emitter or pot edge. Air temperature, humidity and light may help explain treatment conditions, but a greenhouse diagram is not a soil calibration. Select companion measurements only where they answer a question in the experiment.
For permanently installed probes, use the exact interface required by the selected model. An RS485 Modbus RTU soil sensor needs suitable power, a correct register map and a compatible logger. The USB version instead needs its supported host and software arrangement. A family name does not make those interfaces interchangeable.
Export a short trial dataset and inspect it outside the app. Check decimal notation, unit, timestamp, point identifier and whether the same channel label is used consistently. Establish how the team will record depth, treatment and exceptions if the app does not provide dedicated fields.
Preserve unedited exports and keep analysis in a separate file. If one reading is rejected because of poor contact or a damaged probe, record the reason. Do not silently remove unusual values merely because they weaken an expected treatment pattern.
For a departmental purchase, provide NiuBoL the planned exercises, required independent quantities, soil types, number of groups and existing hosts or loggers. Ask for a pilot demonstration of the complete measurement-and-export workflow before standardising a class set.
Not when the required result is a quantitative chemical determination. The USB family's conductivity-derived nutrient indicators can demonstrate trends and method limitations, but they should not be reported as independently measured nutrient concentrations.
Check depth, soil contact, packing, moisture distribution and observation time before attributing the difference to calibration. Record these variables so the class can distinguish procedural variation from a real soil difference.
No. Their denominators differ. Converting dry-mass-based water content to volume-based content requires dry bulk density and water density; report the basis explicitly.
Choose USB for a compatible mobile observation workflow where appropriate, and a suitable RS485 Modbus RTU configuration for logged installations. Specify the required observation schedule and record format before choosing the interface.
The institution should be able to run its planned protocol, check the sensing method, identify each sample and export usable data on its actual equipment. A screen with seven values does not demonstrate those tasks.
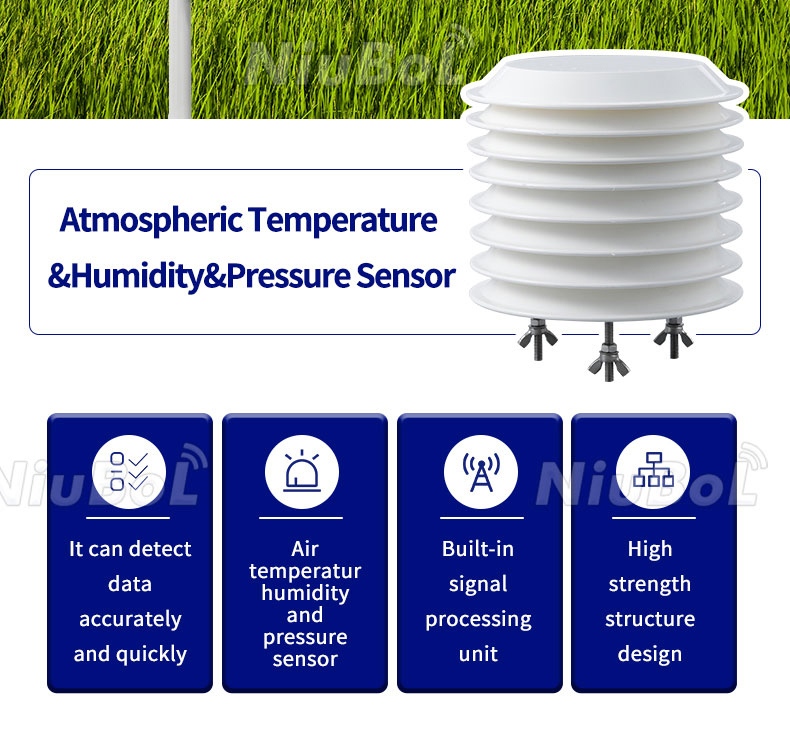
A multiparameter soil meter supports research and teaching when its outputs are tied to a controlled experiment and an auditable record. Separate directly observed quantities from calculated indicators, compare water content on a consistent basis and verify the complete host-and-export arrangement. NiuBoL can review a configuration against the institution's actual measurement tasks rather than a channel count alone.
Prev:Weighing Rain and Snow Gauge System: Principle, Installation and Acceptance
Next:Multi-Layer Tube Soil Moisture Monitoring System: Contact and Depth Checks
Related recommendations
Sensors & Weather Stations Catalog
 Agriculture Sensors and Weather Stations Catalog-NiuBoL.pdf
Weather Stations Catalog-NiuBoL.pdf
Agriculture Sensors Catalog-NiuBoL.pdf
Water Quality Sensor Catalog-NiuBoL.pdf
Related products
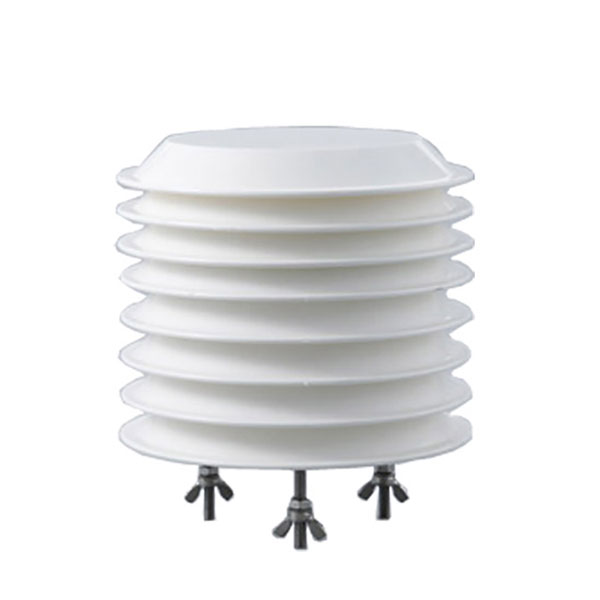 Combined air temperature and relative humidity sensor
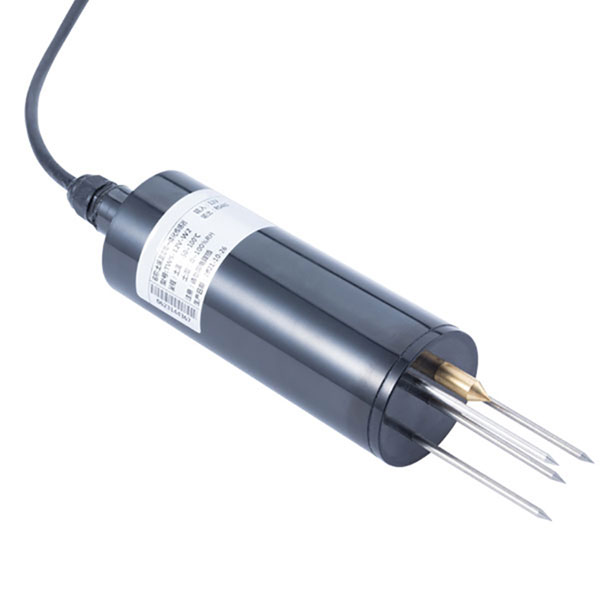 TDR Soil Moisture & Temperature Sensor for irrigation| RS485 |4-20mA| NBL-S-THR
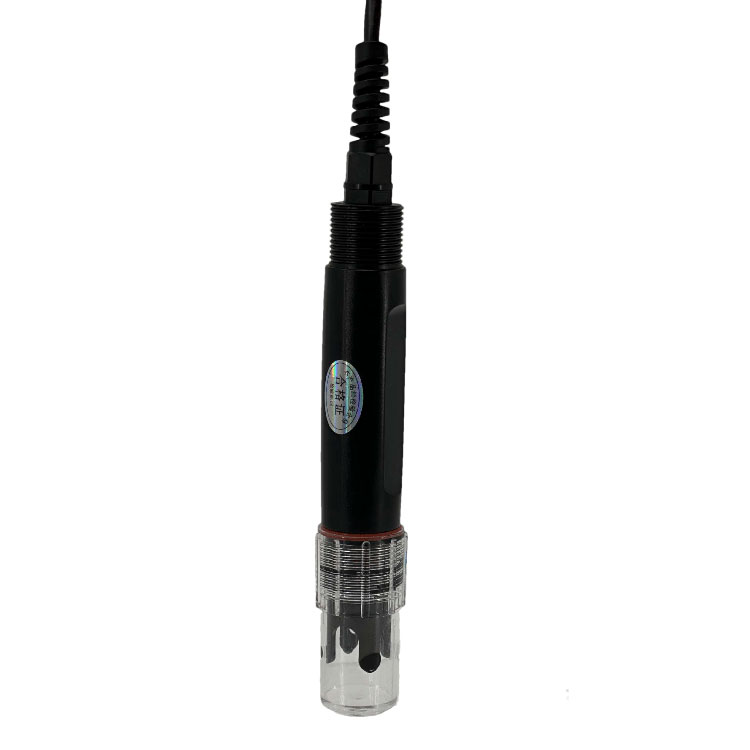 Soil pH sensor RS485 soil Testing instrument soil ph meter for agriculture |NBL-S-PH
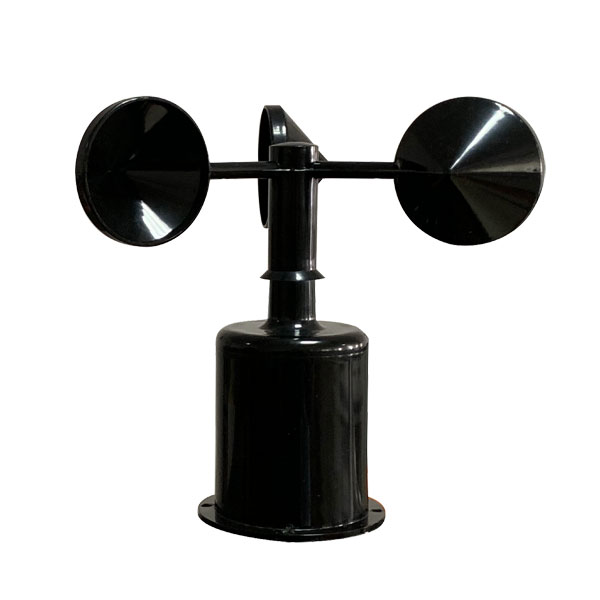 Wind Speed sensor Output Modbus/RS485/Analog/0-5V/4-20mA
 Tipping bucket rain gauge for weather monitoring auto rainfall sensor RS485/Outdoor/stainless steel
 Pyranometer Solar Radiation Sensor 4-20mA/RS485


Screenshot, WhatsApp to identify the QR code
WhatsApp number:+8615367865107
(Click on WhatsApp to copy and add friends)